Which “dependency ratio” should we use when forecasting the potential burden of Social Security on future taxpaying workers? Economists disagree.
You’ve undoubtedly heard that Social Security’s 80-year-old pay-as-you-go (PAYGO) financing method is riding a downtown train to insolvency. Indeed, even as Americans keep paying for Social Security, a majority believes that Social Security “won’t be there” when they retire.
It’s as if Americans were fatalistically paying insurance premiums while believing that their insurance company would soon be insolvent. It makes no sense.
Among the evidence for Social Security’s looming inability to meet its obligations in full (assuming Congress makes no changes in tax rates or benefit levels), the nation’s rising aged dependency rate is the statistic cited most frequently as the program’s fatal flaw. This dependency rate is the ratio of Americans over age 65 to Americans of working age (20 to 64).
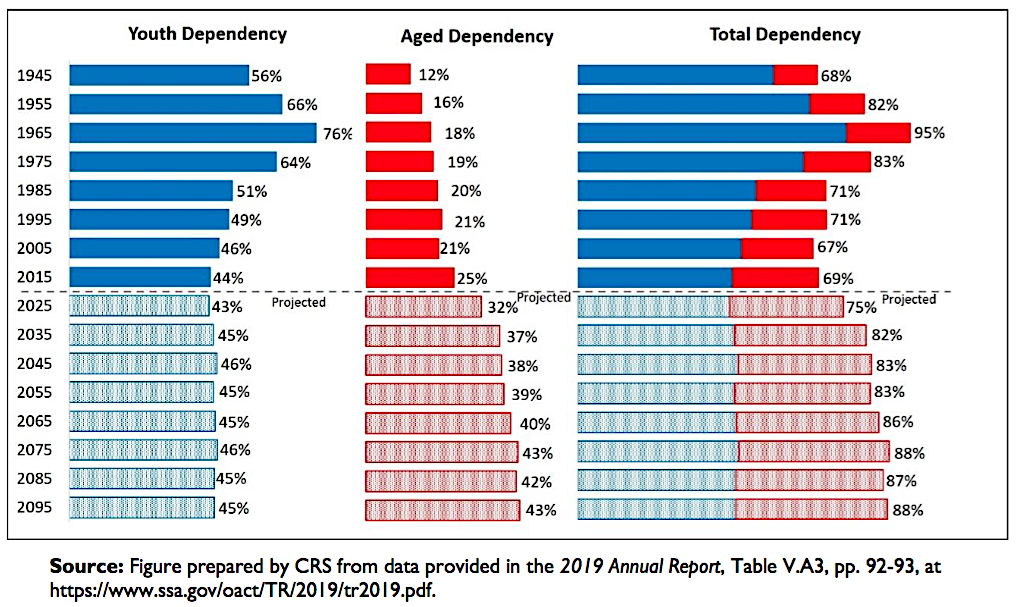
As a country, we’re just not as young as we used to be. In 1945, five years after Ida May Fuller of Ludlow, VT, received the first Social Security check, the aged dependency ratio was 12%, according to 2019 report by the Congressional Research Service (CRS). The aged dependency ratio has steadily risen since then. By 2025, according to the CRS, it will be 32%. That is, there will be 32 Americans over age 65 to every 100 people of working age. By 2055, when few if any Baby Boomers will still be living, the aged dependency ratio is expected to reach 39%.

Social Security Population Density Ratios 1945-2095
Economists have also looked at the ratio of workers to Social Security beneficiaries, not just those in specific age categories. In 2005, Kent Smetters and Jeff Brown estimated that the ratio of workers to beneficiaries had fallen from 16:1 in 1950 to just 3.3:1 in 2004. They predicted that by 2040, because of a declining birth rate and rising life expectancies, there would be only two workers per beneficiary.
The implication is that future workers will have to pay much higher payroll taxes to ensure that—as legally required under the PAYGO financing method—the tax revenue equals the benefits paid. Smetters and Brown estimated that the payroll tax might have to reach 18%, up from 12.4% today, to prevent benefit cuts of about 25%.
Total dependency ratio
But a few “heterodox” economists have suggested that the aged dependency ratio exaggerates the burden that Social Security benefits pose for the nation’s workers. They argue that we should use the total dependency ratio when assessing the nation’s ability to finance Baby Boomer retirement.
The total dependency ratio, which the Social Security Administration tracks each year, is the ratio of all presumably dependent Americans—children and adolescents age 20 and younger as well as people age 65 and older. It tells a different story from the aged dependency ratio.
Workers are also supporting fewer children than they used to. The same falling birth rate (the number of live births per thousand women of child-bearing age) that exacerbated the aged dependency ratio has reduced the youth dependency ratio—and buffered the total dependency ratio.
In their recent textbook, Macroeconomics (Springer, 2019), economists Randall Wray, William Mitchell and Martin Watts argue that the “standard way of calculating the dependency ratio provides a flawed indication of the relationship between active workers relative to inactive persons.”
As an alternative, they propose using an “effective dependency ratio.” In addition to young workers, this would include a more detailed accounting of the rate of labor force participation, the underemployment rate, and the contributions of unpaid labor such as child-rearing and housework.
Wray and a colleague at Bard College’s Levy Institute, Dimitri Papadimitriou, raised the same issue in a paper they published near the end of the Clinton administration, when Social Security reform resurfaced as a public issue.
“If we add the under age 20 population to the 65 and over population to obtain a ‘dependent’ population, workers in 1965 supported more dependents than any generation will support through the year 2075,” they wrote.
“The ratio was nearly 0.95 in 1965, indicating that each person of ‘normal’ working age supported about one person who was not of normal working age. That ratio fell to 0.71 by 1995, and will continue to fall slightly through 2020; it will rise to only 0.83 in 2075.”
US government figures support this. In 2019, the CRS reported (see chart above) that the total dependency ratio in the US peaked in 1965 at 95%. That figure included a youth dependency ratio of 76% and an aged dependency ratio of 18%. In other words, there were about 94 dependents per 100 workers.
Fifty years later, in 2015, the youth dependency ratio had fallen to 44% and the aged dependency ratio has risen to 25%, for a total dependency ratio of 69%. The total ratio is expected to surpass 80% in 2035 and level off in the high 80s afterwards. The youth ratio will remain in the mid 40s indefinitely.
From 1945 to 2015, the total dependency ratio rose only one percentage point, to 69%. It is projected to rise to 88% between 2015 and 2095. That’s significant, but it’s much less dramatic than the projected “tripling” of the aged ratio since 1945 and the 78% increase in the aged ratio (to 43% from 25%) between 2015 and 2095.
An ‘effective dependency ratio’
Clearly, most economists use the aged dependency ratio because the payroll tax goes primarily to pay for the benefits of aged Americans, and much less to pay for the benefits of American youth. Two Social Security experts told RIJ that simply makes the most sense.
“One needs to calculate an aged dependency ratio to see implications for programs for the aged,” Eugene Steuerle of the Urban Institute told RIJ. “We provide nowhere near the same support for the young through government programs, especially at the federal level. Spending on the young is also more likely to be growth enhancing; spending on the old is much more need-based; they aren’t substitutes.”
Similarly, Jason Fichtner, a former Social Security economist now at Johns Hopkins University, told RIJ, “The Trustees look at the aged dependency ratio because it is a measure of ‘financing’ stability as benefits are being paid out for a given year — the number of those age 65 and over are considered ‘dependent’ on those of working age 20-64. Children are excluded because they aren’t working and paying taxes to support the elderly.”
Those favoring the use of an “effective dependency ratio” have acknowledged that. ”We realize, of course, that the dependent aged have different kinds of requirements than do the dependent young,” wrote Wray and Papadimitiou in 1999.
But “there can be no doubt,” they added, “that the ‘real burden’ of providing for the educational, housing, recreational, and medical needs of the young baby boomers in the 1950s and 1960s represented a very large transfer of real resources toward production of the goods and services consumed by those under age 20—and much of that transfer was accomplished through the tax system as workers and property owners were taxed whether they had children or not (for example, property taxes paid for new schools).”
The point here is that a lot of variables go into painting the portrait we have of Social Security’s future finances. Besides the dependency ratios, those variables include future rates of productivity, immigration flows, recessions and pandemics, the labor force participation rate, national output, and many others. Not all models will use the same set of variables.
Even when economists use the same variables, they may not make the same assumptions about the quantities of those variables. They will reach different conclusions, and their conclusions will shape public opinion in different ways and lead to radically different policy recommendations. It may be safe to neglect the total dependency ratio, or it might be a mistake.
© 2021 RIJ Publishing LLC. All rights reserved.


