Suppressed Report Discredits “Supply-Side” Economics

"The reduction in the top tax rates have had little association with saving, investment, or productivity growth," said a September 14 report that was posted on the Congressional Research Service website but withdrawn two weeks later.

A recent report from the Congressional Research Service suggests that “supply-side economics”—essentially, the idea that tax cuts pay for themselves by stimulating business activity—isn’t supported by historical evidence.

The report, dated September 14, was posted on the CRS website for private use by members of Congress and their staff, but was withdrawn two weeks later after Republican lawmakers objected to several aspects of it, the New York Times reported last week.

According to the Times, the economist who wrote the report, Thomas L. Hungerford, has donated $5,000 to the Obama campaign or the Democratic Party, but the report was an official publication of the non-partisan CRS, not a work of opinion.

The summary of the report said:

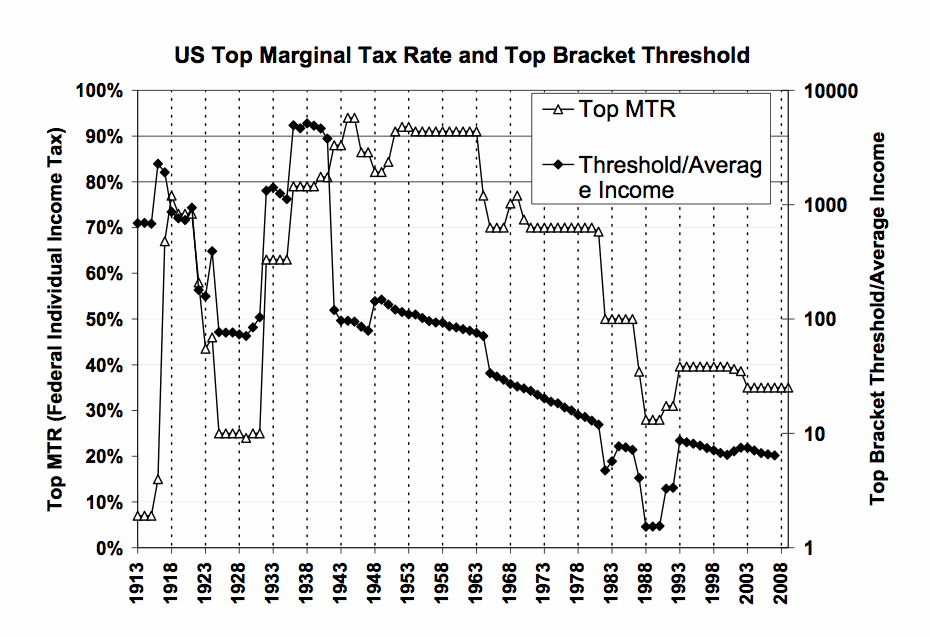
Throughout the late-1940s and 1950s, the top marginal tax rate was typically above 90%; today it is 35%. Additionally, the top capital gains tax rate was 25% in the 1950s and 1960s, 35% in the 1970s; today it is 15%.

The real GDP growth rate averaged 4.2% and real per capita GDP increased annually by 2.4% in the 1950s. In the 2000s, the average real GDP growth rate was 1.7% and real per capita GDP increased annually by less than 1%.

There is not conclusive evidence, however, to substantiate a clear relationship between the 65-year steady reduction in the top tax rates and economic growth. Analysis of such data suggests the reduction in the top tax rates have had little association with saving, investment, or productivity growth.

However, the top tax rate reductions appear to be associated with the increasing concentration of income at the top of the income distribution. The share of income accruing to the top 0.1% of U.S. families increased from 4.2% in 1945 to 12.3% by 2007 before falling to 9.2% due to the 2007-2009 recession.

The evidence does not suggest necessarily a relationship between tax policy with regard to the top tax rates and the size of the economic pie, but there may be a relationship to how the economic pie is sliced.

A 2011 report from the CRS by two other authors came to similar conclusions, saying that:

Potentially negative effects of tax rates on economic growth have been an issue in the debates about whether to extend the 2001-2003 income tax cuts, whether to increase taxes to reduce the deficit, and whether to reform taxes by broadening the base and lowering the rate.

Initially, it is important to make a distinction between the effects of policies aimed at short-term stimulation of an underemployed economy and long-run growth. In the short run, both spending increases and tax cuts are projected to increase employment and output in an underemployed economy. These effects operate through the demand side of the economy. In general, the largest effects are from direct government spending and transfers to lower-income individuals, whereas the smallest effects are from cutting taxes of high-income individuals or businesses.

Long-run growth is a supply-side phenomenon. In the long run, the availability of jobs is not an issue as an economy naturally creates jobs. Output can grow through increases in labor participation and hours, increases in capital, and changes such as education and technological advances that enhance the productivity of these inputs.

Historical data on labor participation rates and average hours worked compared to tax rates indicates little relationship with either top marginal rates or average marginal rates on labor income.

Historical studies on top U.S. marginal tax rates often refer to the tax rate but omit the income threshold to which the top rate applies. The chart below, from the Econometrics Laboratory Software Archive, compares the top marginal tax rate with the income threshold (expressed as a ratio of the top income threshold and the average income) between the years 1913, when the federal income tax was created, to 2008.

US Top Marginal Tax Rates and  Threshold Income


 © 2012 RIJ Publishing LLC. All rights reserved.