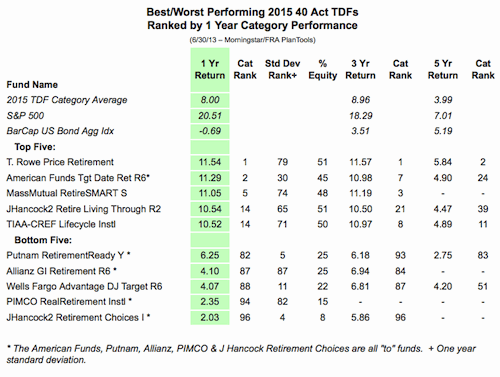
Rising equity markets helped generate strong returns during 2012 and early 2013. Experiencing more volatility, TDFs with equity rich glide paths, tactical overweighting, emerging market and real estate exposure fared particularly well last year. The defensive funds and those focused on real returns lagged, but it is important to review these funds on a risk-adjusted basis over a longer time period.
As noted in the 7/15/13 release by the Center for Due Diligence (CFDD) on TAA: Prudent, Generally Accepted & Diversified, a surprisingly large number of mainstream TDF managers, including T. Rowe Price, are now using a tactical element. Given the increased interest in tactical asset allocation, the CFDD’s white paper on TAA & ERISA Plans was specifically designed to provide an analytic framework for evaluating these complex strategies.
TDFs have diversified via international equity and foreign bonds in recent years. The Morningstar survey noted that TDFs with significantly different allocations and geography delivered somewhat similar results during 2012, but that will not be the case in 2013. In spite of this diversification, the average TDF generated a 13.1% return during 2012, not far from the 16.0% generated by the S&P 500.
Recognizing that few managers add attribution value beyond asset class selection, the flows into passive TDFs exceeded active funds for the first time during 2012. TDF fees continue to fall and while active funds still hold a 68% market share, that market share is down from 85% in 2006.
Bolstered by recordkeeping platforms and brand, Fidelity ($157 billion in TDF assets), Vanguard ($124 billion) and T. Rowe Price ($80 billion) remain the dominant mutual fund providers of TDFs. The big three held a 75% market share at the end of 2012, but that is down from 83% at the end of 2006.
Declining from 48% in 2006 to 32% at the end of 2012, most of the decline in market share was experienced by Fidelity. The increased use of CITs, mediocre performance and the trend towards open architecture contributed to the decline in Fidelity’s market share.
The Fidelity Direct and Fidelity Advisor platforms are quite different, but both offer robust non-proprietary TDF flexibility. Indeed, Fidelity Direct includes the vast majority of TDFs as part of their standard offering, including Vanguard and T. Rowe. Vanguard and the American Funds do, however, appear to be missing from the Fidelity Advisor platform.
Looking at the 2015 vintage, Fidelity’s absolute and risk adjusted returns were average or below during 2012, particularly the Index series. The somewhat conservative glide path and commodity allocation are no doubt taking a toll. Fidelity is the only one of the big three with a commodity allocation and while it was ill-timed, smart allocations could be muted by conservative glide paths during periods of rising equity markets. Unlike the Freedom Series, the Index series does not use High Yield, Emerging Market Debt or REITs. Despite average volatility, Fidelity’s TDF performance did not improve much during the first half of 2013.
From an absolute performance standpoint, T. Rowe, TIAA-CREF, Principal, Great West and John Hancock led the 2012 charge. T. Rowe Price, TIAA-CREF and Principal were also among the top performing TDFs over the trailing three-year period calendar period. Vanguard’s growth rate was the highest among the “big three” last year and while most TDF managers experienced organic growth during 2012, the smaller funds generated the highest growth rates.
TDF managers with more than $1 billion in assets experiencing robust growth during 2012 included John Hancock, up 43%, JP Morgan, up 51%, and Great West, up 71%. TDF Managers with less than $1 billion experiencing robust growth included MFS, up 49%, PIMCO, up 127%, Invesco, up 57%, and Allianz, up 149%. Interestingly, these four firms lack recordkeeping platforms and use different strategies.
2012 was a good year for most TDF managers, but six of the TDF series tracked by Morningstar experienced negative growth, including Alliance Bernstein, DWS and Putnam. Given their less than stellar performance, attribution value and lack of scale, these TDFs should be monitored more closely. While we aren’t sure about their other asset allocation solutions, Putnam’s TDF performance has been particularly poor over the trailing 1, 3 & 5 year periods.
American Independence, Columbia, OppenheimerFunds and Goldman Sachs shuttered their TDFs in 2012, primarily due to a lack of scale. Goldman Sachs is, however, positioning to leverage the market for custom solutions and turmoil in the fixed income markets.
As noted in the lead copy, the first half of 2013 was very different from the 2012 results. The TDF managers are also diverging. US equities performed well during the first half of 2013, but US bonds, foreign bonds, TIPS and commodities all ended in the negative column for the year-to-date period ending 6/30/13.
As noted by Jon Chambers, Principal, Schulz Collins Lawson Chambers, “Those advocating heavy bond allocations may be fighting yesterday’s battle. Asset allocation is about balancing risk, not avoiding it, something that is impossible.” Indeed, the inevitable end of quantitative easing and the record outflows from US bonds during June are reminders that equity and longevity risk are not the only risks facing TDF investors. For more on fund flows and asset class performance, see the CFDD’s DC Plan & TDF Statistical Supplement.
TDF performance varies by vintage. Given the impact of rising interest rates, the long-dated funds fared better than the short-dated funds for the period ending 6/30/13. In other words, the most risk-averse investors came up short.
Based on the lowest cost share class TDF in Morningstar’s mutual fund database—which does not include funds of funds, target-risk funds & CITs—the average TDF in the 2015 vintage was DOWN 1.4% for the quarter, up 2.1% for the year-to-date June period and up 8.0% for the trailing year. In sharp contrast to the average target date fund, the S&P 500 was UP 2.9% for the quarter, up 13.8% for the year-to-date period and up 20.6% for the trailing year.
When comparing TDF performance, it is important to note that Morningstar’s database does not separate the “to” and “through” funds. This is a serious limitation because these funds have different objectives. As noted previously, comparing funds with different objectives is like comparing apples to oranges.
Given that different strategies and wide ranging glide paths make performance comparisons difficult, we have identified the “to” and “through” funds and added a column with the 2015 vintage equity exposure as of 12/31/12. To assist with risk adjusted performance comparisons, we have added a column with standard deviation for the trailing 1, 3 and 5 year periods. Going forward, the CFDD will separate the “to” and “through” TDFs. We will also include CITs. Based on the Morningstar data, the SSgA Target Retirement CIT actually outperformed T. Rowe Price, the top-ranked TDF manager, with far less volatility.
T. Rowe Price was the top performing TDF for the trailing 1, 3 & 5 year periods in Morningstar’s mutual fund database. The American Funds, MassMutual and TIAA-CREF also placed among the top five for the trailing 1 & 3 year periods. Contrastingly, Putnam was the only manager among the bottom five for all the periods shown. Unlike T. Rowe Price & Vanguard, Fidelity was the only one of the top three managers that failed to place among the top five for any of the time periods. They also avoided the bottom five for the same time periods.
As you might expect, the top performing TDFs—particularly T. Rowe Price—were accompanied with high standard deviation. In other words, these funds may suffer the most if the equity markets tank. By focusing on dividend paying securities, the American Funds Group was the sole exception, i.e., they delivered top decile performance over the trailing 1- and 3-year periods with low standard deviation.
© 2013 Center for Due Diligence. Used with permission.