Retirement readiness calculators are back in the news, thanks to a provision in the SECURE Act that requires retirement plan sponsors to send participants an annual “lifetime income disclosure” that would show how much monthly income their savings would generate in retirement.
That monthly dollar figure would be based on the monthly payout from a SPIA (a single premium immediate annuity, single life or joint and survivor) that the participant would purchase at retirement with his or her entire account balance.
Another provision of the Act orders Secretary of Labor Eugene Scalia to write a “model disclosure” to serve as a standard for projecting and reporting monthly incomes. The SECURE Act also exempts plan sponsors from liability for participant misuse of that information, as long as they use the standard.
The idea for disclosing future income estimates to 401(k) participants has kicked around since the mid-Obama administration. Behavioral finance and “nudges” were in the air. Experts agreed that if 401(k)s were to replace pensions, then people should start viewing their 401(k) balances through a prism of monthly income.
The Department of Labor has offered an online calculator since 2012. It more or less takes your current 401(k) balance, grows it by 4% a year (7% growth minus 3% inflation), and spits out a hypothetical annuity quote (monthly income, in today’s dollars).
Not ideal
This government-issue calculator is quite simple and easy to use, and it was offered as a model for 401(k) plans when it was created. But it assumes that plan participants purchase a SPIA. In practice, very few participants buy, intend to buy, are encouraged to buy, or will be required to buy a fixed annuity with even half of their savings, let alone all of it.
(The DOL does offer a detailed online questionnaire/calculator and a 68-page workbook, “Taking the Mystery Out of Retirement Planning,” but their purposes are different from the kind of brief annual disclosure that’s contemplated for 401(k) participants.)
Another problem: You can’t assess a household’s retirement readiness using only one person’s current 401(k) balance. Even as a crude benchmark, it’s as likely to scare people (when they see how underfunded they are) as it is to encourage them to save more.
So, as the Secretary of Labor works on the new disclosure, we decided to survey half a dozen private sector calculators for ideas that the DOL might use to make the disclosure more useful, but still simple.
RIJ played mystery-shopper and test-drove half a dozen online calculators. From countless eligible candidates, we chose those at Fidelity, Vanguard, Schwab, Pacific Life, New York Life and the Alliance for Lifetime Income, which is the retirement industry’s non-profit “protected lifetime income” education group.
As we knew they would, different wizards yielded different outcomes, depending on their assumptions. Some assume a classic 4% withdrawal rate. Others assume a life annuity rate, which pays out about 6%. Some calculators seek input on only one person, others about couples.
Hypothetical inputs
To fill the data fields on each wizard, we assumed the following hypothetical couple:
- A 50-year-old primary worker, earning $100,000/year
- A 50-year-old secondary worker, earning $50,000/year
- No defined pension or existing annuity
- Moderate risk tolerance (60% equities)
- $150,000 saved so far by the primary worker; savings rate $6,000/year
- $75,000 saved by the secondary worker; savings rate $4,000/year
- Target retirement ages of 67
- A home worth $250,000 with $100,000 left on the mortgage
- A retirement length of 25 years
- No known inheritance
- Zero non-mortgage debt (for simplicity)
We thought that a single 50-year-old American earning $100,000, with savings of $150,000 and new contributions of $6,000 a year (or a two-income household earning $150,000, with $225,000 saved and contributions of $10,000 a year) would surely be “on track” for retirement. Those numbers put them in the top 15% of Americans, money-wise.
Vanguard Retirement Income Calculator
A major retirement plan provider, Vanguard may have designed this wizard for its plan participants. It asks for only one person’s information, uses a conservative 3% withdrawal rate (4% minus inflation) and suggests an 85% replacement rate (i.e., a retirement income equal to 85% of pre-retirement income). It asks the user for an expected asset growth rate for the $150,000 in savings plus future contributions. We input “5%.” The wizard reduced it automatically to 4% for inflation and got $440,000.
In our case, the wizard said we’d need a pre-tax $7,083 per month (in current dollars) in retirement, but have only $4,099. That included our estimate of $3,000 from Social Security and $1,100 from investments (3% of $440,000).
If we used the tool’s handy sliders and shoehorned in the second earner’s salary ($50,000) Social Security ($1,500) and savings ($4,000 per year; $75,000 accumulated) to the equation, assumed a 6% growth rate and 70% replacement rate, the expected monthly income rose to $6,463, but the monthly need became $8,750, based on the higher income ($150,000). To achieve that income, the couple would need to save $41,000 every year for the next 17 years.
Pacific Life Retirement Income Translator
Pacific Life’s wizard compares the advantage of a life annuity over the 4% rule. Based on our primary earner’s $150,000 in savings today, the calculator estimated savings of $435,231 by age (67). Assuming a 6% return, 2% inflation, and a 4% withdrawal rate, the wizard projected total income of $675,343 over 28 years (to age 95).
The wizard highlighted the fact that the total retirement income would be $822,506 if the investor bought a single premium income annuity (SPIA) at retirement, or $147,163 more than the 4% rule provided. Pacific Life assumed a 3% internal rate of return. (Interest rates and annuity payouts have declined since the Pacific Life wizard was created.)
Fidelity Retirement Score
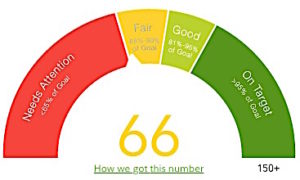
From Fidelity
Fidelity’s calculator needed six pieces of information to create a retirement readiness score. Along with age, current salary, accumulated savings, and monthly savings rate, it asks if the investor intends to spend more or less in retirement than he or she currently does. (We chose “less.”) The wizard assumes when the person reaches age 65 he’ll claim $2,114 in monthly benefits and that he’ll live to age 93.
The calculator offered nine risk profiles, from “Short-Term” (all cash) to “Most Aggressive” (all stocks). He chose “Balanced,” which allocated 50% to stocks, 40% to bonds and 10% to cash.
He scored a dismal 48 on a scale where 100 represented full funding. His projected monthly income of $3,447 (including Social Security) would fall far short of his estimated pre-tax need of $7,185.
Using the digital toggles on the web page, the investor could score 73 (a solid “C”) by saving $1,000 a month, retiring at age 67, reducing retirement expenses by 15%, and allocating 60% to equities.
But his new income of $4,596 would still be $1,700 a month (27%) shy of security. By retiring at age 67 and adding his wife’s savings and Social Security benefit, the couple might squeak through—if they could “live as cheap as one.”)
Schwab Retirement Calculator
Schwab asks for current age, income, expected age of retirement, risk tolerance (five options, from Low to High), Social Security claiming age, savings rate, current savings amount and—this was unusual—“Supplemental Income in Retirement.” This question allowed the user to report rental income or a spouse’s income during the primary earner’s retirement. The wizard calculated the Social Security benefit automatically. When prompted, we stipulated a 70% replacement rate instead of estimating the couple’s retirement expenses.
The calculator estimated that the saver would need savings of $1.36 million by age 67 but would have only $610,000 saved by the retirement date. Dauntingly, the wizard suggested that the investor retire at age 76, start saving $27,000 per year, or cut retirement spending to $44,600 per year. It offered sliders to adjust age of retirement, savings rate, and retirement spending rate. If we added the secondary earner’s savings and Social Security benefit, and set the couple’s spending at $60,000 in retirement, then a secure retirement appeared within reach.

New York Life Retirement Savings Calculator
New York Life’s calculator is built for a couple. It provides fields for partner’s income, accumulated savings and annual savings rate. The wizard self-calculates the couple’s combined Social Security income. We entered 5% for expected rate of return, 25 years for expected length of retirement, and a 70% replacement rate. ).
From New York Life
Based on our couple’s data, the calculator estimated their total savings at retirement of $792,633 and a combined Social Security income of $74,823. To reach the 70% desired replacement rate, the couple would have to save an additional $1,866 a month over the next 17 years. By cutting their replacement rate to 60% and doubling their savings rate to $20,000, the couple would be assured an adequate income to age 92, with some $642,577 left over. New York Life had assumed annual increases of 2% and 1%, respectively, in salaries and savings rates. Taxes were left out of the model. (New York Life has another online calculator for 401(k) clients, but it doesn’t appear geared to retirement income adequacy.)
Alliance for Lifetime Income Retirement Income Security Evaluation (RISE)
Life insurers and asset managers started the Alliance for Lifetime Income in 2018 as a non-profit vehicle for educating the public about annuities. Its calculator, like Fidelity’s, produces a score. Like New York Life’s, it accommodates couples or singles.
Our hypothetical couple’s inputs ($225,000 in current savings, $10,000 saved per year, $4,500 in combined Social Security benefits, monthly expenses of $6,000 in retirement, and a 20% allocation of savings to an unspecified annuity) earned them a score of only 398 on a scale of 800. That was “Poor.”
“The expected income in retirement, including portfolio withdrawals, may cover 73% of expenses in average scenarios and 59% of expenses in the worst 10% of scenarios,” the Alliance’s calculator showed. Milliman, the global actuarial consultant, engineered this wizard.
According to a disclosure sheet, this wizard modeled annuity-related results using deferred variable annuities, and fixed indexed annuities with guaranteed lifetime withdrawal benefits, as well as SPIAs. This was the only calculator that modeled all of the types of deferred annuity products that life insurers are likely to offer plan participants under the SECURE Act.
Takeaways
Our hypothetical couple turned out to be much less prepared for retirement than we expected. Every calculator found them deeply underfunded. Yet this imaginary couple is far better off than most. The median 401(k) balances among Vanguard plan participants for those ages 45 to 54 is $40,243, according to Vanguard research. The average balance, which by rule of thumb represents roughly the 75th percentile, is only $115,497 for that age bracket.
Our exercise was educational, however. A simple annual “disclosure” of future income based on one person’s retirement plan balance—which Congress has asked the Department of Labor to create this year—might be worse than useless. (See the Anecdotal Evidence column in today’s issue of RIJ.) Calculators should accommodate the incomes and savings of a couple, as well as individuals. “Sliders” that allow participants to adjust their inputs will be essential for motivating people and enabling changes in savings habits. Otherwise, a secure retirement may look discouragingly out of reach.
© 2020 RIJ Publishing LLC. All rights reserved.