Not retiring is the most reliable retirement income strategy, judging by AARP’s December 2013 Fact Sheet. The report was based on data from the U.S. Census Bureau’s March 2013 Current Population Survey Annual Social and Economic Supplement.
About one-fifth (21.6%) of the 43.3 million Americans who are age 65 or older still work full-time or part-time. They had the highest personal incomes ($44,470 average; $25,000 median) in 2012. No other sub-group came close.
More older people are working. Americans who are 65+ now get 30.3% of their income from earned income, up from 15.3% in 1990, a generation ago. This reflects their growing labor force participation. In 2000, only about one in eight (13.5%) of people age 65+ worked; In 2012, about one in five did (19%).
Those with the most income—from any source—were the most likely to be working. More than half (54.8%) of the members of the highest income quintile (with at least $43,259 in income, and a median of $65,567) had earned income. While that group also had the highest median Social Security benefits ($18,384) and highest income from pensions and savings ($30,000), their earnings (median, $50,000) was what set them apart, income-wise.
These numbers, based on quintiles and averages, paint a rough picture, of course. They fail to reveal much about the finances of the very wealthiest older Americans. But they also don’t reinforce the stereotype of idle rich with big incomes from pensions and investments. While investment income may distinguish the top 1% or 5%, employment income is still the biggest source of income for top 20%.
Though members of the top income quintile were least likely to receive public welfare assistance (less than one percent do), they were the most likely (8.2%) to receive other government transfers, such as veterans’ benefits, at a median rate of $13,200.
The older people in the lowest income quintile receive a median Social Security income of just $7,559, and only two-thirds receive it at all. Their next highest source of income for that group was public welfare, at a median of $6,000 for those who receive it. Interestingly, only 8.5% of the poorest older Americans reported receiving public welfare. Almost 10% received other types of government transfers, but their median income from that source was just $1,050 per year.
If Social Security vanished overnight, the top quintile of older Americans (income over more than about $43,000) might not miss it. It accounts for only about one-sixth of their income, according to the AARP data. But for all other older Americans, Social Security benefits represent between 45% and 86% of their incomes, on average.
The AARP data was for individuals, not couples or households. So, for some households, these income numbers could presumably be doubled.
The average and median benefit for the 36.4 million Americans ages 65+ who received Social Security in 2012 was only about $14,000 in 2012, according to AARP. The richest Americans ages 65 or older had a median income of $65,567. The income threshold for entrance to the top 20% was only $43,259. More than half (54.8%) of those in the highest income had earned income.
The AARP data doesn’t take into account the uneven dispersion of income throughout the U., or the possibility that the cost of living in low-income areas is much lower than in high-income areas. As everybody knows, it can cost a lot more to live in New York City than in rural Arkansas. In addition, many older people undoubtedly confine their needs and appetites to fit their income.
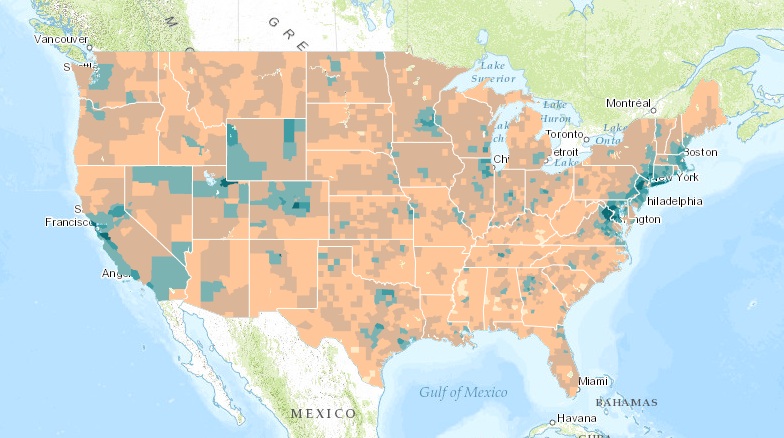
Below is a chart of income by county in the United States, provided by ArcGIS.com. The areas of darkest green have median household incomes of $82,000 or more, and a more likely to be urban. The areas of lightest brown have median incomes of $24,000 or less, and are more likely to be rural. To people who stay close to home and don’t visit a lot of different or distant zipcodes, the U.S. might appear more financially homogeneous than it actually is.
© 2013 RIJ Publishing LLC. All rights reserved.