Watching the Fed raise interest rates a little bit at a time reminds me of the classic family game of Jenga, where players remove a block at a time from a tower of 54 wooden blocks. A similar kind of suspense is involved, I guess.
Back in 2005 and 2006, I remember watching Alan Greenspan raise rates a quarter point at a time and thinking, ‘If this guy can get us back to a normal yield curve without crashing the stock market, he’ll deserve the Nobel Prize.’ (Or maybe I didn’t think that; maybe I’m suffering from hindsight bias.)
We know how that ended. And we know from handwringing press reports this week that Fed tightening and flat yield curves (defined as a narrow spread between 2-year and 10-year rates) are very often harbingers of recessions.
When a highly leveraged system encounters rising rates, bad things can happen. The more leveraged you are, the less you can afford an increase in your financing costs or a decline in the value of your collateral. Leverage in the system can be like high blood pressure: You don’t know how high it is until you have a stroke.
Peaks in margin debt sometimes presage a stock market crash. According to Yardeni Research, margin debt reached at all time high this week of about $650 billion. That sounds bad. Before the financial crisis of 2008, it peaked between $400 and $450 billion.
But as a percentage of the value of the Wilshire 5000 equity index, margin debt is lower today than ten years ago: about 2.4% (down from a spike of more than 2.8%). And it’s moving sideways, not spiking. That doesn’t sound as ominous.
To understand all this, you have to grasp fixed income at a deep level. Sometimes, when contemplating bonds, I feel like I’m walking in a mental Möbius strip. Joan, a former co-worker of mine at Vanguard, used to say that you’re either born with the “bond gene” or not. Difficulty with bonds, she believed, isn’t density. It’s destiny.
As a consumer, I’ve benefited from low rates over the past 10 years. A few years ago, a mortgage refinance helped us replace our old kitchen’s turquoise appliances and mock-Tudor cabinets with pale wood and stainless steel. But, inconsistently, I’ve also hoped that long-term rates would rise, helping savers and annuity issuers.
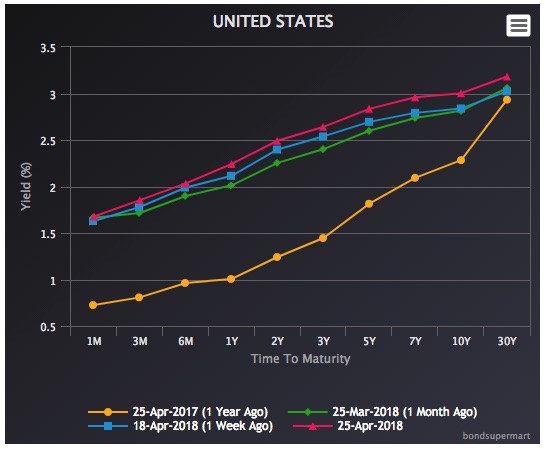
Ten-year rates have been rising, but not as fast as short-term rates. Exactly two years ago, the 10-year Treasury yielded 1.46%. Yesterday, that number was 2.84%. But in the last two years, the one-month yield has risen to 1.79% from just 0.25%. So we have a flattening yield curve.
A flat yield curve can become an inverted yield, where long-term bonds are paying lower yields than short-term bonds, despite their higher interest-rate risk. That’s considered a possible leading indicator of recession. But we’re nowhere near the kind of inverted yield curve that occurred before the 2008 recession.
Scrolling through the Treasury Department’s pre-crash interest rate data, I found some very strange numbers this week. On January 22, 2005, the one-month government yield was 1.89%, the two-year yield was 3.21% and the 10-year yield was 4.20%. That sounds healthy, right? But by February 1, 2006, when Ben Bernanke succeeded Alan Greenspan as Fed chairman, the one-month rate was 4.33%, the two-year rate was 4.59% and the 10-year rate was 4.57%. Talk about inversion.
It got worse. A year later, on February 21, 2007, the one-month rate was 5.27%, the 2-year was 4.82% and the 10-year was 4.69%. (That sounds bizarre. On the other hand, the yield curve was similarly shaped during the middle of the dot.com boom ten years earlier.) Bernanke must have been worried about inflation in 2007: the Consumer Price Index spiked at just above 4%.
Back to the present: The Fed could presumably push up longer-term rates and steepen the yield curve by selling some of the dodgy fixed income instruments it bought during its Quantitative Easing period, when ended in 2016. But there has been no indication of that. In January 2015, the Fed’s assets totaled $4.516 trillion. Last week, that number was $4.316 trillion, a drop of just 4.4%.
Putting a lot of long-term assets on the market could also kick off an undesirable chain reaction. By increasing the supply of long-term assets relative to demand, it would reduce the prices of existing bonds. That could create the equivalent of margin calls on bonds used as collateral and raise the payments of borrowers who planned to roll over their debts or refinance. A vicious cycle could lead to further sell-offs and then to you-know-what.
Jenga!
© 2018 RIJ Publishing LLC. All rights reserved.