

U.S. life/annuity companies sold nearly half a trillion dollars’ worth of annuities in 2025, a record. But the available sales data doesn’t tell us why Americans bought the annuities, or help us distinguish net flows from gross sales, or explain why we still call vastly different products, “annuities.”
That’s not the “annuity puzzle,” as evoked by Menahem Yaari’s famous 1965 paper on the wisdom of annuitizing one’s savings. But it’s puzzling.
LIMRA, the life/annuity industry’s Connecticut-based market research arm, reported U.S. annuity sales of $464.1 billion in 2025, up 7% from 2024. Fourth quarter Q2025 sales were $117.2 billion, up 14% from 4Q2024. LIMRA’s sales survey covers 93% of the market.
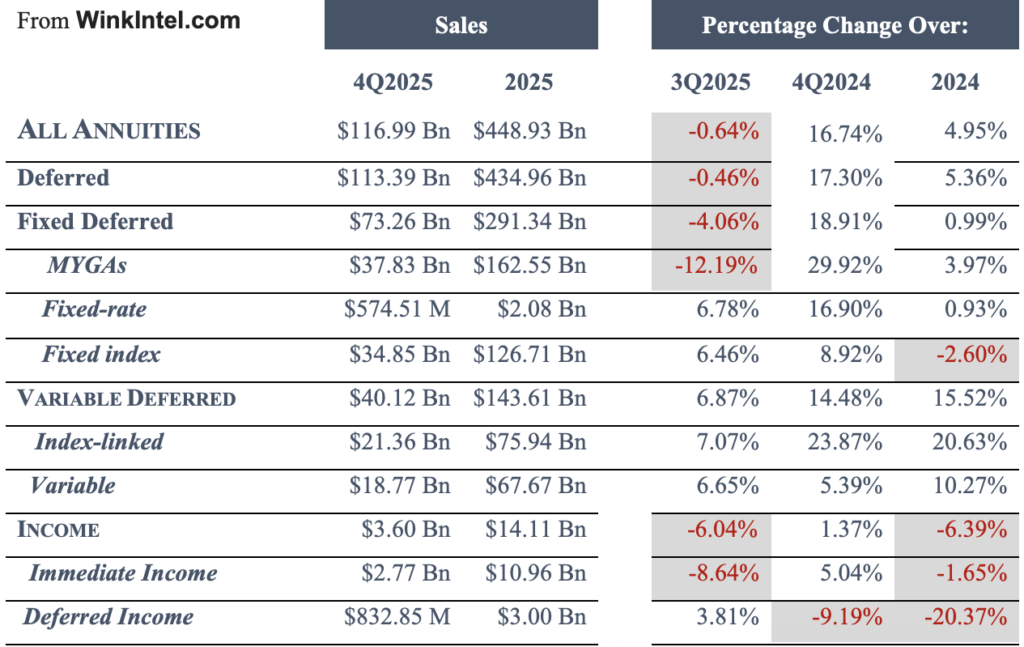
Des Moines-based WinkIntel, whose survey includes slightly different data, reported $448.9 billion in overall sales in 2025, up almost 5% from 2024, and $116.9 billion in 4Q2025, up almost 17% from 4Q2024.
Both LIMRA and WinkIntel gather sales information from life insurance and annuity issuers, tabulate the data, and sell subscriptions to the information back to the companies. LIMRA says its individual annuity sales survey covers 93% of the market. It identifies the top 20 annuity sellers in each of the main annuity categories: Fixed-rate, multi-year guaranteed rate, fixed indexed, “payout” annuities (including single-premium immediate, or SPIAs, and deferred income, or DIAs), traditional variable, and registered index-linked variable (RILAs).
At WinkIntel, CEO Sheryl Moore has chosen another taxonomy. It labels annuities as either “Deferred” or “Income.” Deferred annuities include variable (traditional and RILAs) and fixed (indexed, fixed-rate and MYGA. Income annuities include SPIAs and DIAs.
Moore lists the top 10 sellers in each product category, along with the top five sellers in each of the various distribution channels: Banks, full-service national broker-dealers, independent broker-dealers, registered investment advisers, independent insurance agents, career insurance agents, and direct response.
Data on gross sales of annuities can be misleading. Owners of investment-like deferred annuities (unlike illiquid, irrevocable income annuities) can exchange them for or replace them—subject to surrender penalties or contract breakage fees known as market-value adjustments—with new and typically more attractive ones.
Replacements are counted as new sales. Payouts of interest, benefits or distributions aren’t subtracted from the gross revenue. So gross sales far exceed actual industry growth. According to Conning Insurance Research’s 2025 Life-Annuity Market Overview, “aggregate net flows improved in 2024, ending at $81 billion compared to $59 billion in 2023. The strong direct premiums in 2023 caused positive net flows. This was the third consecutive year of positive net flows for the individual annuity line.”
It’s also hard to tell whether people are using annuities merely as safe fixed-income investments, or a way to trade mutual fund-like investments without generating current-year taxable gains, or for the purpose that their name implies: as sources of annual income in retirement.
LIMRA and WinkIntel suggest that owners of deferred annuities, which primarily offer safe growth, are switching on the income riders (guaranteed lifetime withdrawal benefits, or GLWBs) to get income-for-life while still being able to dip into principal for emergencies.
LIMRA research chief Bryan Hodgens suggested as much when he attributed rising annuity sales to the societal loss of income from guaranteed pensions. In a release, he said annuity demand is augmented by the “4.1 million Americans [who] are turning 65 each year ― many who don’t have pensions or other income sources to meet their basic living expenses in retirement.”

“The most recent data illustrates that 53.2% of indexed [annuity buyers] are electing a GLWB,” WinkIntel’s Moore told RIJ in an email. And contract owners aren’t merely buying that rider, paying an annual fee, and forgetting to use it to turn the annuity’s cash value into a guaranteed stream of income.
“The insurance companies are reporting that 28.7% (on average) of GLWBs are currently distributing income to the client,” she said. But “individual company results range from 1.3% to 52.3%,” Moore said. She didn’t identify those companies.
Many publicly-traded life/annuity companies were burned by their over-issuance of under-priced GLWBs on variable annuities in the 2000s and 2010s. Some of those issuers went out of business, were divested from foreign owners, were restructured, or switched to products with less tail risk. More than a decade later, some life/annuity companies are still selling or reinsuring their blocks of VAs with GLWBs to get them off their balance sheets.
Anecdotally, we hear little about the use of deferred annuities as part of a deliberate lifetime income planning. We asked Jamie Hopkins, financial advisor and co-author with Bonnie Treichel of “Your Retirement Sketchbook,” if he does. “Short answer: I am not,” Hopkins said. “What I am mostly seeing lately or being asked about from clients is RILAs and the fixed indexed annuities—but we have not seen as much use of GLWB riders with them.”
Single-premium immediate income annuities and deferred income annuities, which strictly produce retirement income from an irrevocable lump-sum investment, are still the annuities that Americans are least likely to buy.
“Total income annuity sales were a non-starter this quarter,” wrote Moore in WinkIntel’s analysis of last year’s sales. “SPIA and DIA sales aggregately dropped more than 6% [in 2025], while only experiencing a 1% increase over 4Q24.”
Yet, for the handful of mainly mutual companies (i.e., owned by their customers) that sell payout annuities, led by New York Life ($7.1 billion in 2025), last year ended on a high note. “Ten percent of [life insurers] had triple-digit gains” in 4Q2025 from 3Q2025, Moore said.
In the fourth quarter of 2025, SPIA sales increased 23% from the prior quarter to $3.9 billion, LIMRA reported, while DIA sales rose 22% to $1.4 billion. For the year, SPIA sales ticked up 6% to $14.4 billion and DIA sales fell 3% to $4.8 billion.
Nearly 30% of [life insurers surveyed] experienced double-digit sales increases” in DIA sales in 4Q2025, LIMRA agreed. But DIA sales were down by more than 9% when compared to the fourth quarter of 2024, and down more than 20% in 2025 from 2024. “It is expected that DIA sales will be down again in 2026,” a LIMRA release said.
The top-selling annuities in 2025, as in most years, are the deferred annuities that investors use for loss-resistant, tax-deferred accumulation—i.e., growth rates that beat other fixed income alternatives. These included multi-year guaranteed-rate annuities aka MYGAs ($162.55 billion), fixed indexed annuities ($126.7 billion), registered index-linked annuities aka RILAs ($75.94 billion) and traditional variable annuities ($67.67 billion).
What about the annuity puzzle, which asks why more people don’t annuitize their savings in accordance with the principles of Yaari’s paper?
In a country like the U.S., whose universal Social Security system protects almost everyone from longevity risk, and where most retirees need more liquidity to complement their state-provided guaranteed income, the low take-up of illiquid private annuities shouldn’t puzzle us.
The U.S. life/annuity industry posted a 34% year-over-year increase in net income to nearly $40 billion in 2025, the largest total in the last five years, according to a new Best’s Special Report, “First Look: 2025 Life/Annuity Financial Results.” The data is derived from companies’ annual statutory statements received as of March 19, representing an estimated 93% of the total life/annuity industry’s premiums and annuity considerations.
According to the report, total income for the U.S. life/annuity industry increased by 13% in 2025 over the prior year, driven by a $101.2 billion increase in other income, largely due to a combined $84.8 billion increase of reserve adjustments on reinsurance ceded at American General Life Ins. Co. and Athene Annuity and Life Co., along with an 8% increase in net investment income.
Total expenses for the industry increased by 13% as general insurance and other expenses rose 66%. The resulting pretax net operating gain of $51.8 billion was a 22% increase from 2024. A 15.7% reduction in taxes was offset by an increase in realized capital losses, resulting in the net income increase.
Capital and surplus increased by nearly $24 billion, or 4%, from the end of 2024 to $530.7 billion, as a combined $64.7 billion from net income plus increases in unrealized gains and contributed capital and other changes in surplus were reduced by $40.8 billion, owing to changes in the asset valuation reserve and stockholder dividends.
© 2026 RIJ Publishing LLC. All rights reserved.
