After the financial crisis, the fixed indexed annuity (FIA) emerged from its original habitat in the independent insurance agent channel to compete against certificates of deposit in the bank channel and (when combined with an income rider) with variable annuities-with-living-benefits in the broker-dealer channel.
With its disarming marketing hook—equity-linked upside with no risk of loss—the FIA seems to answer the anxieties of sidelined investors. And recent retooling (into no-commission FIAs and “index-linked structured annuities”) has only broadened its appeal. Though the Department of Labor’s “fiduciary rule” has slowed FIA sales, the effect may be temporary.
But FIAs, which first appeared in 1995, have always been hard to benchmark. The product’s complexity, opacity and “manufactured returns” defy easy comparison. The best readily available public data is six years old—a study by Advantage Compendium showed an average annualized index annuity return of 3.27% over the period from 2007 to 2012. WINK (www.looktowink.com) produces a ton of information about FIAs for its subscribers, but not performance information. Anecdotally, FIAs have produced single-year returns as high as 12%.
Now CANNEX, the annuity data vendor, has released a report that measures the yields of commission-paying FIAs with a variety of crediting methods against the yields of multi-year guaranteed rate annuities (MYGAs). The report is entitled, “Accumulation Value of Fixed Annuities (MYGA & FIA): Understanding Yield by Product Design.”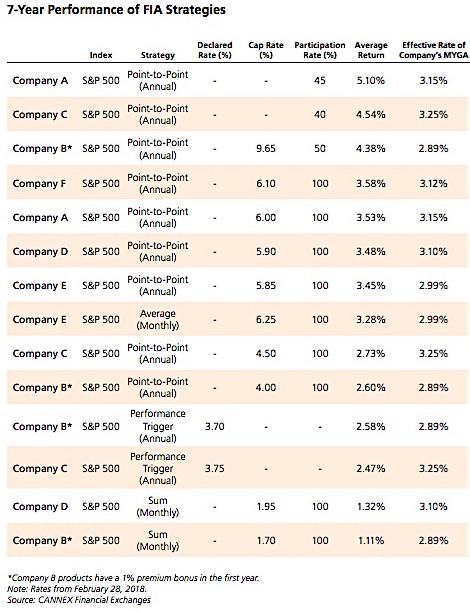
CANNEX looked at 14 FIA products from six life insurance companies. Within that sample, the team “calculated the average annualized rate of return for each seven-year FIA contract… along with the distribution of returns across 10,000 market simulations for the S&P 500 Index.” The results were randomized rather than pulled from market history.
The report demonstrates—and this conclusion may feel self-evident—that contracts with the most generous performance caps and participation rates (or, better yet, no caps at all) do best against the MYGAs issued by the same companies when run through 10,000 Monte Carlo simulations of S&P500 Index returns.
The study depicts a horse race between MYGAs and FIAs as well as a horse race between FIA crediting strategies. (The analysts measured each FIA contract’s performance against the performance of the same issuer’s MYGA because the same interest rate assumptions presumably go into both.)
The results prove more or less what a lot of FIA watchers assume anyway: That the annual point-to-point method is best and that higher caps are better than low caps and no caps are better than a high cap—all else being equal (although all else is never equal).
The two contracts with uncapped S&P500 strategies in the study offered the highest returns relative to the MYGAs issued by the same two companies. Of those two, the contract with a higher participation rate (45% v. 40%) offered the highest average over seven years: 5.1% for the FIA v. 3.15% for the same company’s MYGA.
The products that on average tend to exceed the MYGA returns had the following strategies:
- Annual point-to-point with a higher rate cap (between 5.85% and 6.10%) and 100% index participation
- Annual point-to-point with no rate cap and an index participation rate less than 100%
- Average monthly return with a high rate cap (6.5%) and 100% index participation
The products that on average performed less well than their MYGA counterparts included these strategies:
- Annual point-to-point with a lower cap rate (between 4.00% and 4.50%) and 100% index participation
- Annual performance-triggered with a declared rate
- Monthly sum
On average, however, the differences between FIA and MYGA returns was thin, this study showed. When the team compared the averages with the yields of the most competitive seven-year MYGA return from the same carrier, they found an average for all seven-year MYGAs of 3.08% and for FIAs of 3.26%.
On the risk-reward spectrum, FIAs are evidently closer to fixed annuities than they are to equities. “People make such a strong connection between FIAs and equity indexes, but FIAs don’t perform like equities,” said Tamiko Toland, head of annuity research at CANNEX.
“They’re really a fixed product, and their performance is commensurate with fixed products. Our study gives you a range of returns, and shows that you could get less than a MYGA with an FIA. It depends on what your conviction is about the equities market. FIAs are for people who are willing to take more risk to get a higher yield than the MYGA offers.”
The CANNEX study was criticized by Sheryl Moore, CEO of WINK, which tracks sales and other data on indexed annuities. “As the recognized expert in the indexed annuity space, I put no salt in the findings in the CANNEX ‘research,’” she told RIJ in an email.
“This information is not consistent with my nearly 20 years of product administration, illustration development, and product development experience,” she wrote. “CANNEX is comparing apples-to-oranges here. Indexed annuities shouldn’t be compared to MYGAs; they are comparable to fixed annuities with a one-year rate guarantee.”
In reporting the results of their study, CANNEX maintains the anonymity of each carrier. If companies that subscribe to CANNEX data could identify the carriers—they can’t at this point, according to Toland—they might use such benchmarking data to support their claims of having a decision-making process that demonstrates their pursuit of the clients’ best interests.
The study doesn’t encompass FIA contracts that include some of the more recent innovations, such as custom or hybrid indices, index-linked structured annuities that permit losses up to a floor or beyond a buffer, or lifetime income benefits.
More comparative FIA should help confirm or deny the legitimacy of FIAs and, depending on the results, make advisors either more or less confident about recommending them.
© 2018 RIJ Publishing LLC. All rights reserved.