The market for financial planning software is huge, and no wonder. The need among financial advisers for productivity-enhancing tools ensures a steady demand. The vast computing power and algorithmic creativity of techno-geeks generates a steady supply.
Advisers in search of the latest planning software could find a lot of it in one place at Joel Bruckenstein’s and David Drucker’s annual T3–Advisor’s Edition conference and trade show, held last week at the Hilton in sunny, palm-studded Anaheim, Calif.
One takeaway from the conference: FAs who still rely on Excel spreadsheets or scratch pads—and many still do, evidently—will find it hard to compete in a world where everybody has an iPhone or ‘Droid. “You’re in danger of falling behind your own clients,” warned one presenter.
Undisputably. But of the dozens of products available, which should an adviser choose? If income distribution is your game, a product with strong distribution capabilities is a must. Unfortunately, distribution wasn’t a strong theme at T3—but it wasn’t absent.
In this article, rather than explore the distribution-related features of products from the better-known exhibitors at T3—MoneyGuidePro, Advisor Software Inc., and Advicent (NaviPlan), for example—in this article I’ll focus on my visits to the booths of three smaller outfits whose products were new to me: RetireUp, AskTRAK, and Riskalyze.
RetireUp. As its name implies, this may have been the only firm at T3 that clearly positions its product as a decumulation tool. Created by LPL Chairman’s Council advisor Jeff Feinendegen and physicist/songwriter Dan Santner, this program aims at replacing time-intensive retirement plans with a process that advisers and their clients can complete “in minutes.”
The demo on the RetireUp website (a 14-day free trial is offered) walks you through a multi-step process that starts with the creation of a client Profile, proceeds to an analysis of “Assets,” “Liabilities,” and Custom Goals, and ends with the creation and presentation of a Retirement Plan.
One of the demos involved a fictional couple named Brian (age 55) and Michelle (age 56). They hoped to generate an after-tax retirement income in about 10 years of $80,000 (with an annual 2.5% inflation adjustment and survivor’s income of $60,000).
Their assets included Brian’s 401(k) (currently $750,000; projected to be $1.22 million at retirement) and their joint savings ($300,000; $403,000 at retirement). At full retirement age, they’d get about $38,000 from Social Security, and Brian had a $12,000-a-year pension with a 50% spousal benefit.
Probably to keep the example simple, the Brian and Michelle were blessed with no liabilities and their only “Custom Goals” were the anticipated expense of their five-year-old daughter’s wedding ($25,000) and a $5,000 vacation once every three years throughout retirement. Potential college expenses were not listed.
After plugging in these and other numbers, the adviser and client could generate a Retirement Plan page. In the demo, the Plan screen was filled with the inevitable but potentially bewildering rows and columns of numbers, all populated with precise but hypothetical values.
But it wasn’t overwhelming. By toggling back and forth between different spending rates or assumptions about longevity, Brian and Michelle could experiment with various drawdown scenarios that could (or failed to) satisfy their income needs and neutralize their longevity risk exposure.
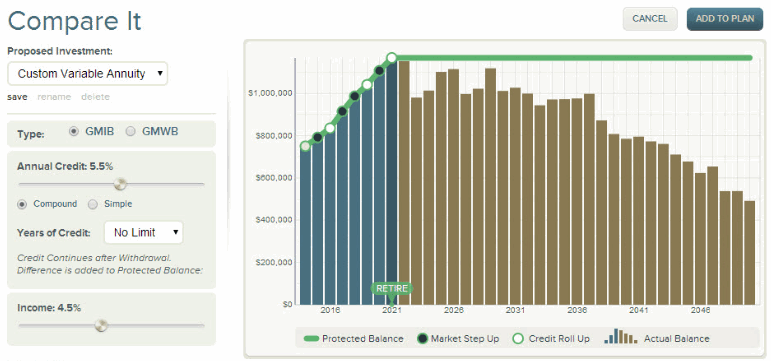
One of the dashboard indicators on the Plan page was an Income Stability Ratio, which provided a calculation of the percentage of Brian and Michelle’s income that was coming from guaranteed sources such as pensions and Social Security. RetireUp also allows comparisons of variable annuities with living benefits through its “Compare It” function. “We believe our software does a good job of identifying when it is or isn’t appropriate to move into a variable annuity,” said Brian Bossler, RetireUp’s vice president of business development.
AskTRAK. Dallas, Ore.-based Trust Builders, Inc., developed the TRAK planning and education tool (TRAK stands for The Retirement Analysis Kit) largely to help plan sponsor advisers. Defined contribution plan advisors can use it show participants how much to save. In public pensions, it can be used to project future income streams or to coordinate the drawdown of pension and after-tax savings in the most tax-efficient manner. But individual advisers and their clients can evidently use it too.
The AskTRAK toolkit is chock-full of calculators. A Multi-Tiered Split Annuity calculator, for instance, allows advisers to show clients how to split a given lump sum into income from a succession of as many as five tiers of deferred and/or immediate annuities.
In one strategy that’s illustrated on the AskTRAK website, a newly retired 62-year-old with an after-tax $500,000 lump sum decides to build a three-tiered split annuity. The first tier, which uses $118,300 of the $500,000, provides a $2,300 monthly income until age 67.
Over those five years, a $102,500 piece of the original asset grows (at an assumed rate of 6%) to a projected $137,200, which provides $2,600 a month until age 72. The remaining $279,200 is allowed to grow (at an assumed 6%) for 10 years, reaching a projected $500,000. That amount can be used to buy more income, if needed, or to fund a legacy.
Like other software, TRAK’s Tax Wise Distribution Strategy can generate the now-familiar Rock of Gibraltar-shaped retirement income chart. But instead of refracting each year’s income into colored bands that correspond to its sources, this chart refracts income into colored bands that correspond to tax brackets.
A client who is drawing down savings from both pre-tax and after-tax accounts, for example, can use this chart as a guide to spending the pre-tax money first (so that it is taxed at the lowest rate) and then relying on after-tax money when income climbs into the higher tax brackets.
For retirees who anticipate using qualified plan assets for legacy purposes, AskTRAK also has a Stretch IRA calculator. It can illustrate the projected annual withdrawals and the declining value of a 401(k) account as it passes from the original account owner to a surviving spouse and then to children or grandchildren.
Riskalyze. This specialty software applies Daniel Kahneman and Amos Tversky’s Nobel Prize-winning “prospect theory” to the task of quantifying a client’s risk tolerance. It aims to replace the traditional risk tolerance questionnaire with a more quantitative and scientific approach.
Every client gets a “Risk Number” from one to 100. Like many risk assessment tools, it’s based on the client’s professed tolerance for loss and desire for gain, along with the his or her “financial devastation” amount—defined by Riskalyze as the amount of paper loss that compels the investor to panic-sell.
The Risk Number is presented to the client in the form of a speed limit sign. The greater the risk tolerance, the higher the Risk Number will be. Portfolios are also assigned risk numbers, enabling the adviser to match clients and portfolios with similar scores.
Using the tool, the adviser can also generate a Risk Number for a new client’s existing portfolio, to see how far it varies from the client’s risk tolerance. The Risk Number is only a starting point in terms of portfolio building. Many different combinations of assets might all generate a score of 45, for instance.
“Heat maps” are popular these days, and Riskalyze offers a “risk/reward heat map” of the investments in a client’s portfolio. It allows the adviser and client to see the projected range of a specific asset’s performance over the subsequent six months.
Aside from showing the possible gain and possible loss, the heat map displays how much of each investment’s downside risk is likely to be buffered by the other investments in the portfolio.
Fans of Kahneman’s 2011 book, “Thinking Fast and Slow,” might be impressed to hear that Riskalyze applies his prospect theory to the task of assessing risk tolerance. A pillar of behavioral finance, this theory has helped describe how people actually weigh and choose between risky alternatives, rather than how a hypothetical “rational investor” might behave.
© 2014 RIJ Publishing LLC. All rights reserved.