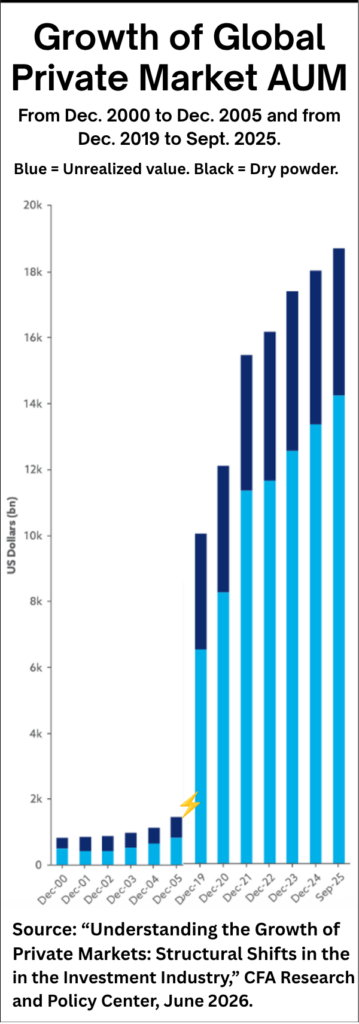


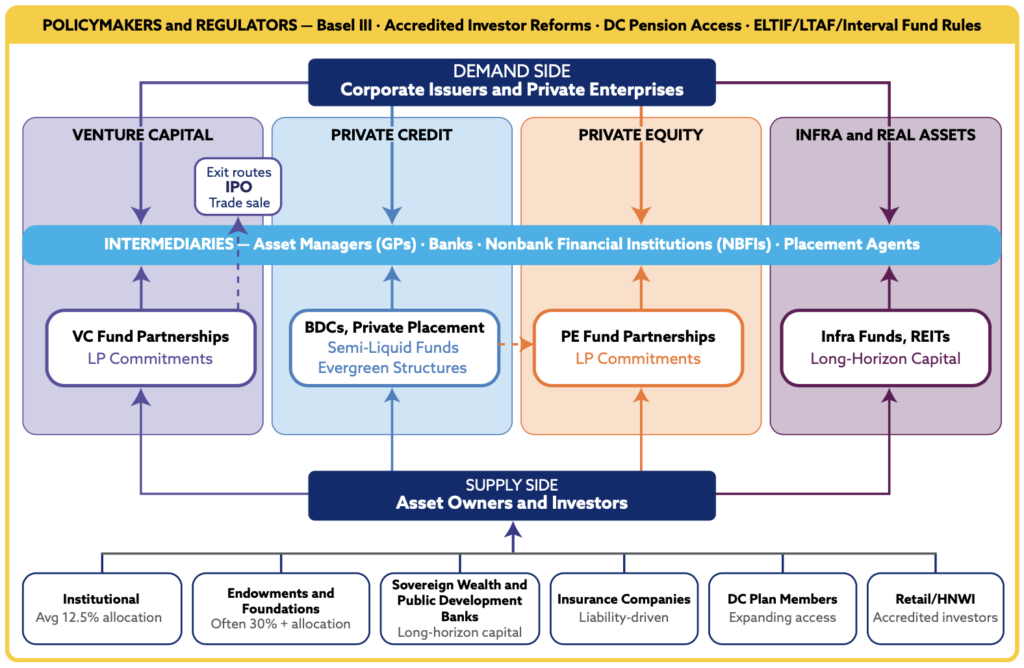
In a recent report, “Understanding the Growth of Private Markets: Structural Shifts in the Investment Industry,” the CFA Institute’s Research and Policy Center has done a useful service to Bermuda Triangle watchers by mapping the world of private market assets and its stakeholders. (See chart above/at right.)
That world represents one of three three legs of what RIJ calls the Bermuda Triangle strategy, which includes, within the same holding company: an alternative asset manager (e.g., Apollo, Blackstone, KKR, Eldridge, Guggenheim Partners), one or more life insurers that issue fixed deferred annuities (e.g., Athene, F&G, Global Atlantic, Security Benefit, Delaware Life) and an affiliated reinsurer in Bermuda or the Cayman Islands.
[Long-standing, stalwart life insurers like Prudential, MassMutual, Lincoln Financial, Pacific Life and others have adopted parts of this strategy. They’re more likely to sell registered index-linked deferred annuities (RILAs). These are SEC-regulated contracts that these insurers distribute through their familiar broker-dealer partners instead of through the insurance market organizations (IMOs) that emphasize fixed annuities.
The private market investment, and the alt-asset managers, can claim to represent the apex of the Triangle, since the other two legs are there primarily to help finance private credit and related high-yield assets. The life insurers buy the asset managers’ alt-assets and the reinsurers expand the life insurers’ annuity sales capacity by assuming the cost of some of their risks and letting them conserve capital or “release” it for stock buybacks or new ventures.
So, if you want to understand the Bermuda Triangle–or the increasing distribution by alt-asset managers of their private market products through retail channels (via exchange-traded funds) or through institutional channels (via 401(k) plans, it helps to understand the apex of the triangle. This chart will help.
Understanding The Private Market Ecosystem Stakeholder chart
Start at the low end of the chart. Asset Owners and Investors (bottom row) deploy capital upward through access vehicles—limited partner commitments to venture capital (VC) and private equity (PE) fund partnerships, business development companies (BDCs), interval funds, evergreen structures, and infrastructure funds—into four private market channels.
Corporate Issuers and Private Enterprises (top) access financing downward: startups and growth firms via venture capital, mid-market firms via private credit, restructuring and buyouts via private equity, and real asset projects via infrastructure funds. The Intermediaries bar (center) represents the asset managers, banks, NBFIs, and placement agents that channel capital between the two sides. Exit routes connect private to public markets (IPOs, trade sales).
The dashed connection between Private Equity and Private Credit reflects frequent cross-channel financing. The Policymakers and Regulators frame (yellow border) represents the regulatory architecture shaping the ecosystem—rules include Basel III, accredited investor reforms, defined contribution (DC) pension access, and dedicated fund structures (e.g., European long-term investment funds [ELTIFs], long-term asset funds [LTAFs]). GP stands for general partner; HNWI stands for high-net-worth individual.
© 2026 RIJ Publishing LLC.