Have annuity manufacturers turned the corner? Have they regrouped and repaired and retooled enough to make another strong bid for domination of the Baby Boomer retirement market?
Or have “bad liabilities” and low interest rates forced them to downsize their ambitions? And if so, what will that mean for distributors and for the Boomers themselves?
Questions like those simmered under the cordial surface of the American Council of Life Insurance meeting a few weeks ago in New Orleans—a city that, like the life insurance business, is still recovering from disaster. On the one hand, there are reasons to believe that the worst may be over.
Life insurer stocks have risen by about 40% in 2013, on average. The bull market in equities—itself a by-product of low interest rates—has kept variable annuity subaccounts values high and unlocked some of the insurers’ reserves for deferred acquisition charges.
Insurers have withdrawn, de-risked, re-designed, “bought back” and shut off new contributions to old, problematic annuities and introduced an array of new products that carry less risk and require less capital. Bitter medicine has been swallowed—witness Prudential’s recent $1.7 billion pre-tax charge for adjusted lapse-rate assumptions and AXA Equitable’s costs in trying to buy back in-the-money living benefits.
But annuity issuers—some more so than others—aren’t out of the woods yet. Many have big blocks of in-force variable annuity business that were priced with expectations of higher interest rates and lower lapse rates than we’ve seen. General account revenues have been trending down, a result of persistent low interest rates. Sales of new variable annuities are not benefiting as much from rising stock values as they once did.
Given the big variations in life insurers’ experience in (and responses to) the financial crisis, a one-size-fits-all interpretation of the VA market probably doesn’t exist. But, it appears that, for some companies, binging on sales of generous variable annuities and other products during the boom has led, since the financial crisis, to a kind of hangover.
While it’s easy to say so in hindsight, at least one industry analyst who presented at the ACLI conference believes that things might have turned out better if the VA industry had reacted more pragmatically to the shift from non-qualified to qualified premiums that started in 2002.
At the ACLI conference
That analyst, Colin Devine of C. Devine & Associates, worries that some of the liabilities assumed over the past decade will be millstones around the necks of certain life insurers for a long time.
“Bad assets you can sell. Bad liabilities you’re stuck with forever,” said Devine in an interview with RIJ after the conference. He thinks those liabilities will diminish, though not destroy, life insurers’ capacity to meet the Boomers’ retirement needs.
“I don’t think there’s enough capacity in the industry as it stands today to service the Boomer need for longevity protection,” Devine said. “For one thing, the opportunity is so big. The second piece is the life insurers’ legacy liabilities.
“Whether it’s variable annuities, long-term care (LTC) or no-lapse guarantee universal life, these liabilities similar to the old non-cancelable own-occupation individual disability income polices sold back in the’80s and ’90s will stay around a long time, consume a lot of capital and deliver a low return. Many insurers may find a meaningful portion of their reserves and capital will be committed to supporting these underachieving liabilities and not be available to fund new growth opportunities.”
Another long-lasting problem, he said, has been the decline in general account yields. Life insurers have to make long-term assumptions when they price certain products, like annuities. A significant level of liabilities on insurers’ books today was priced with the assumption that incoming premiums would be invested at much higher rates of return than insurers are able to earn today.
While there may be some ability to adjust for this in terms of the cost of insurance charges and policy dividends, insurers are still feeling their margins being squeezed. Low rates can also adversely impact lapse assumptions (as investors seek better opportunities), which in turn can hurt mortality/morbidity experience, according to Devine.
“Nobody’s crippled, but they are constrained in leveraging the Boomer market opportunity,” he said.
In its own way, the financial crisis and the low rate environment may have changed certain life insurers’ attitudes toward equity market risk almost as dramatically (though less visibly) the way 9-11 changed the way the airline industry handles airport security risk.
Today, it no longer matters whether life insurers should have assumed lower lapse rates or if demutualized companies took too much equity market risk in pursuit of higher returns on equity. Going forward, there are new questions: Having been bitten once by equity risk, will life insurers be doubly shy? And if they are too cautious, how will that affect product design, profitability and competitiveness in the face of challenges from private-equity firms or fund companies, which also want to manage a chunk of the Boomer retirement savings?
A sticky wave of qualified money
Devine’s presentation at ACLI was called “Lots of Opportunities, Lots of Challenges. Looking Ahead at the U.S. Life Insurance Industry.” He was upbeat on the asset side but downbeat on the liability side. “Because of their low lapse rates, it is going to take not quarters, not years, but decades to run down these closed blocks,” he said. In its latest earnings call, Prudential said it has adjusted its VA lapse assumption to 6% per year from 9%.
While higher equity prices help insurers recover VA acquisition costs faster and unlock some reserves, low interest rates are pushing down on lapse rates (and raising reserve requirements) by making the 5% to 7% (of the benefit base) annual payouts of those products look very good by comparison.
If VA issuers calculated that contract owners who delayed income until the end of the deferral period—10 years, for many contracts—wouldn’t live long enough to drain their account values and start dipping into insurers’ pockets, they may have been banking on overly-optimistic equity market expectations and high lapse rates.
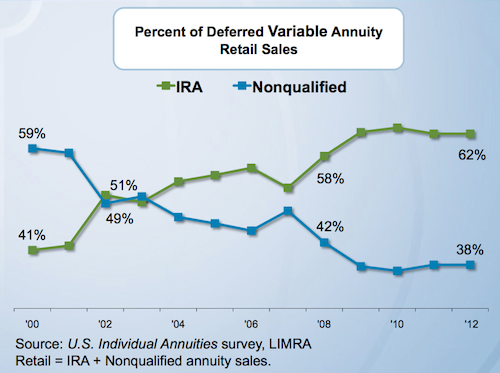
Starting in 2002, a reversal occurred: more premium started coming from qualified money than non-qualified money. That meant that more policyowners probably bought their contracts for the lifetime income, and would likely hold onto their contracts until they died.
“In 2000, 60% of VA sales were non-qualified. Let’s look at today: 60% of sales come from tax-deferred money. People are buying them in their IRAs. For the past 10 years they’ve been buying the contracts for retirement income, not tax deferral. All the VA issuers have known this. They have watched the percentage of their deposits that are tax qualified steadily rise,” Devine said.

But the implications of that switch for lapse (and pricing) assumptions were not sufficiently heeded, he suggested. “People who bought VAs with non-qualified money might just let it sit there and never use their living benefit. Nobody stepped back and re-thought their pricing assumptions as the percentage of purchases using qualified funds began to rise.
“Some insurers continued to assume these products would get exchanged every six or eight years [as surrender periods expired]. But qualified customers are different. It’s not a matter of if the tax-qualified buyer will start taking withdrawals; it’s a matter of when. You know that by age 70½ they will have to start taking required withdrawals because that is when the tax code mandates that must begin required minimum distributions or RMDs.”
The mutual insurers and a couple of public life insurers—Protective and Principal, notably, which at mid-year 2013 held only about $11 billion and $7.2 billion in VA separate account assets, respectively—largely sat out the VA arms race, but others “chased sales, even though it was obvious that people bought their living benefits with the full extent of using them,” said Devine.
A more sanguine view
Other observers, however, prefer to focus on the positive. Consulting actuaries at companies like Milliman and Ruark, who get paid to help insurers out of jams like these, take a more sanguine view than Devine, a former equity analyst.
“I don’t necessarily agree that products were ‘mispriced,’” said Tim Paris, CEO of Ruark Insurance Advisors. His company studies lapse rate data and works on reinsurance deals for life insurers with burdensome VA blocks.
“Even before the financial crisis, the manufacturers understood that the cost of the guarantee would be affected by policyholder behavior and surrender rates,” Paris told RIJ. “But they said, ‘We need to make certain assumptions. We’ll do our best.’ Now it looks like it hasn’t turned out the way they might have hoped.
“As we’ve seen since 2008 and 2009, policyholder behavior is turning out to be a lot different from what was anticipated. Directionally, the surrender rates are a lot lower than they used to be, and lower than what companies would have expected.”
Milliman has played a big role in the engineering of managed-volatility portfolios, which reduce VA manufacturers’ equity risk exposure by building equity risk dampeners into the separate accounts themselves. VA issuers like Ohio National and Securian can now afford to bring living benefit riders with rich deferral bonuses to market because they require contract owners to use those portfolios if they want those riders. The crisis has produced that and other product innovations.
“My view is that the life insurance industry will find ways to benefit significantly from the Baby Boomer demographic trend. Looking for a silver lining, the financial crisis taught the life insurance industry that it is critical that guaranteed products are manufactured in a sustainable way,” Milliman principal Ken Mungan told RIJ.
“The industry has made tremendous progress in improving product design and risk management to create VAs that meet customer needs with significantly lower risk profiles. Bit by bit, VA writers are applying the knowledge that they have gained to the management of the in-force as well. It will take longer to make changes to the in-force vs. new products, but I think those efforts will pay off.”
“In my mind, the lesson of the last five or six years, for variable annuities, is that these products may be trickier to deal with than was first hoped. That has spurred creativity in the development of products that meet the challenge of longevity risk management. And that’s a good thing,” Paris said.
Necessity has in fact sparked an explosion of actuarial creativity in the annuity product sector since the financial crisis. Fixed indexed annuities sprouted GLWBs. New York Life launched a new kind of deferred income annuity and sparked a flurry of fast-follower products. AXA Equitable, MetLife and others introduced buffered accumulation products. Jackson National introduced an accumulation-stage VA specializing in alternative investments. Executives at other firms say they are looking for products that don’t require much capital, like life insurance/life annuity hybrids. There’s not a lot of talk about selling equity market protection.
What’s next
Asked to speculate on the future of the VA business in the U.S., Paris said, “The issue of longevity risk management is only going to get bigger. It could be that we will see less focus on capital markets guarantees and more focus on longevity protection.
“With VAs, there was so much emphasis on a bundled product. But there’s another school of thought, and we’re beginning to hear more about this, that it would be reasonable for the life insurers to just stick to covering the longevity risk and not get involved in the investment risk,” he said.
“It’s analogous to the debate between buying universal life insurance and buying term life and investing the difference. Maybe the bundled solution isn’t the way to go. The fact that we’re seeing all these deferred income annuities is some indication of that. Handling longevity risk is what life insurance companies are uniquely qualified for,” Paris added.
Why were the publicly held companies so much more aggressive in VA pricing and asset gathering? “In the mid-2000s, our shareholders told us they wanted equity-type returns, and we went into the equity markets to get them,” a product chief at a major publicly-held life insurer said in a press briefing recently. The S&P Life Index more than doubled between September 2003 and the end of 2007. After dropping steeply in 2008, it has rallied, recovering about two-thirds of its 2003-2007 gains.
Paris was asked if he saw a link between demutualization in the 1990s and the risk-taking that publicly held life insurers engaged in just before the financial crisis, and if the risk-taking was a bad idea. He said it was too soon to tell.
“There’s no question that if you want the higher returns, you have to take more risk. Which means you’re going to have more volatility,” he said. “But we may look back 40 years from now and see that, although there were zigs and zags along the way, and periods when [those companies] may have had to put up a lot of reserves, they did get a 15% return, and that may be more than the returns of a company that just stuck to selling term life insurance.
“Yes, we’ve seen massive changes in the last few years. It may very well have lasting effects on the life insurance companies. But no matter how severe the crisis was, the truth is that these products will stay in force for decades, and we don’t know yet what will happen. It’s still very early.
“Of all the GLWB products that have been sold since the mid-2000s, and among all of the companies whose capacity you’re concerned about, not one has yet paid a claim to a GLWB policyholder. Even contract owners who are taking income are still just withdrawing their own money. None of them have exhausted their own money.”
© 2013 RIJ Publishing LLC. All rights reserved.
