Please click on box below to watch preview.


IssueM Articles
Please click on box below to watch preview.
Income projections have small but significant effect on participant savings rates
Sponsors and providers of workplace retirement plans have been encouraged to provide participants with quarterly estimates of the amount of monthly income each might receive during retirement based on their current or projected account balances.
Three researchers from Stanford and the University of Minnesota decided to test participants in the university’s retirement plans to see if such information actually produces higher savings rates and, by extension, greater financial security in retirement.
Their results, published by the Center for Retirement Research at Boston College, showed that income projections changed the savings behavior of only a small percentage of people, but that those people increased their savings rate by $1,150 a year on average.
The researchers divided 17,000 University of Minnesota employees into four groups—a control group that received no special education and three treatment groups. Each treatment group received one of these brochures:
Compared to the national population, the university workers were more educated and had more retirement savings. They are covered by Social Security and by one of two generous employer plans. They can also contribute to a tax-deferred Voluntary Retirement Plan (VRP).
The results show that the “income treatment” had a small but significant effect on savings rates. Compared to the control group, members of the income group were 1.2 percentage points more likely to change their contributions during the six-month period following receipt of the brochures – 5.3% vs. 4.1%.
Members of the income group as a whole increased their retirement saving, on average, by just $85 more per person than the control group. But, considering only those who made a change, members of the “income group” increased their savings by $1,150 more per year than those in the control group.
Relative to the control group, individuals in the other two treatment groups – the “planning group” and “balance group” – were also more likely to change their VRP contributions but did not show a statistically significant increase in the amount of saving.
“It was not the income projections alone, but the combined effect of providing retirement planning information along with the balance and income projections that encouraged the increase in saving for those in the income group,” the researchers wrote.
The effect of the income treatment on retirement saving was significantly reduced among people who had difficulty in paying bills, who said they live “pretty much for today,” and who were inclined to procrastinate. The effect was enhanced among people who described themselves as “good at following through.” Intelligence and financial literacy scores had no measurable impact on savings behavior.
The authors of the study were Gopi Shah Goda, a senior research scholar at the Stanford Institute for Economic Policy Research, and Colleen Flaherty Manchester and Aaron Sojourner, who are assistant professors at the Center for Human Resources & Labor Studies, a part of University of Minnesota’s Carlson School of Management.
New York Life’s operating earnings up 18.4% in 2012
New York Life announced a record operating earnings of $1.6 billion in 2012, an increase of 18.4% over 2011. Surplus and asset valuation reserve in 2012 rose to a record $19.6 billion, the company said in a release. Combined life insurance face value was $816 billion, also a record.
Individual recurring premium life insurance sales through the company’s 12,000 agents grew 4% over 2011, while annuity sales through agents were up 9%. Sales of long-term mutual funds through agents rose 34% over the prior year. Assets under management for New York Life increased 12.6% to $381 billion.
In 2012, $8.1 billion in benefits and dividends was paid out to the company’s life insurance policyholders and annuity contract owners.
On the annuity side, New York Life continued to lead the industry in providing guaranteed lifetime income, with a 28% market share in fixed immediate annuities, according to LIMRA.
Morningstar webinar to focus on variable annuities
Morningstar will sponsor a free webinar next week to review the past year in the VA industry, highlighting product development and distribution as well as trends and expectations for 2013.
The presenters will be Kevin Lofreddi, vice president, Morningstar, and John McCarthy, product manager, Morningstar. The webinar will take place at 3:30 p.m. Central (4:30 p.m. Eastern) on April 11.
Nationwide Financial has agreed to acquire 17 equity and bond mutual funds from HighMark Capital Management, Inc.. The transaction is expected to bring Nationwide’s fund business about $3.6 billion in new assets. Terms weren’t disclosed.
The transaction, which has been approved by the boards of both mutual fund complexes, is expected to close by the end of the third quarter, pending regulatory and shareholder approvals. Afterwards, Nationwide’s mutual fund business is expected to have about $51 billion under management.
HighMark Capital Management, a unit of Union Bank, N.A., will become the subadviser for the successors to the nine funds that it currently manages in the form of nine new Nationwide Funds. Eight of the 17 mutual funds are subadvised by three other asset managers: Bailard, Inc., Geneva Capital Management Ltd, and Ziegler Lotsoff Capital Management, LLC. Those relationships will continue.
HighMark Capital Management will focus on managing institutional and high net worth assets for its wealth management and separately managed institutional businesses, where it will oversee more than $15 billion in client assets.
Nationwide Financial engaged Cambridge International Partners Inc. as its financial advisor and Stradley Ronon Stevens & Young, LLP as its legal counsel. Berkshire Capital Securities LLC acted as the financial advisor and Bingham McCutchen LLP as the legal advisor for HighMark Capital Management and Union Bank.
© 2013 RIJ Publishing LLC. All rights reserved.
U.S.-listed U.S. equity mutual funds and exchange-traded funds received $52.0 billion in the first quarter, the biggest quarterly inflow since the first quarter of 2004, according to TrimTabs Investment Research.
“Many pundits dismissed the huge inflows into U.S. equity funds in January as a one-off related to seasonal and tax factors,” said David Santschi, TrimTabs’ CEO. “But inflows reached $17.7 billion in March, which was the second-highest monthly level in the past two years.”
The big inflows into equities did not come at the expense of bonds. Bond mutual funds and ETFs received $72.3 billion in the first quarter, the seventeenth consecutive quarterly inflow.
U.S. equity funds, global equity funds, and bond funds each posted inflows in all three of the first three months of 2013, TrimTabs said. Global equity mutual funds and ETFs took in $65.7 billion in the first quarter, the fifth consecutive quarterly inflow and the highest quarterly inflow since the first quarter of 2006.
“Investors seem convinced the Fed has their back,” Santschi said. “They snapped up equities across the board as the Fed pumped an average of $4 billion per business day of newly printed money into the financial system.”
“Lots of market strategists are eagerly anticipating a ‘great rotation’ out of bonds and into stocks, but no such rotation has materialized,” said Santschi. “Last quarter’s inflow into bond funds was right in line with the inflows in previous quarters.”
PHL Variable Insurance Co., a unit of the Phoenix Companies, has issued the Phoenix Next Generation Annuity, a fixed indexed annuity to be distributed by The AltiSure Group and aimed at middle-market retirees and pre-retirees.
As a special promotion, Phoenix and AltiSure are offering higher fixed and index crediting rates until June 30, 2013.
The contract’s Protected Inheritance Benefit combines a guaranteed lifetime withdrawal benefit (GLWB) with a return of premium death benefit paid to beneficiaries in five equal installments. Unlike competing contracts, the death benefit in this contract doesn’t decrease as the lifetime withdrawal benefits are drawn, the company said.
The annuity will be offered through a partnership between Phoenix and The AltiSure Group, a life and annuity design and distribution firm that aims to offer its members access to a handpicked group of productive agents. According to a Phoenix release, the new FIA helps people near or in retirement “balance income needs during retirement with the desire to leave an inheritance.”
With the optional Protected Inheritance Benefit, available for an added fee, the income level for the GLWB and the return of premium death benefit percentage are selected at issue. The owner can choose a base level income after year one or a higher income guarantee after a five-year wait.
The return of premium percentage at death is available at 100%, 75% or 50% and does not change even after the initiation of GLWB payments. The bonus version of the Next Generation Annuity adds between 6% and 10% of the premium (depending on the state) to both the account value and the return of premium death benefit.
© 2013 RIJ Publishing LLC. All rights reserved.
Two of Romania’s pension funds, which account for almost one-sixth of the assets in the nation’s defined contribution or “second pillar” pension, have merged due to MetLife’s purchase of Aviva’s Central and Eastern European (CEE) business, IPE.com reported.
Last summer MetLife bought Aviva Life Czech Republic, Aviva Life Hungary and Aviva Life Romania, which ran the second pillar fund Pensia Viva.
MetLife already owns Romanian insurer and pension fund provider Alico, which it purchased from AIG in 2010.
Romania’s pension regulator, The Supervisory Commission of the Private Pension System (CSSPP), approved the merger of the pension funds run by Aviva and Alico last week. Pensia Viva was merged with Alico and saw its market share in the second pillar increase to 14% from 6.8% with 822,420 participants, according to the CSSPP.
At year-end 2012, more than 5.7 million Romanians participated in the second pillar with net assets of RON 9.64bn (€2.18bn) in nine funds. Since 2008 the number of funds has been halved to eight funds following several mergers, the CSSPP said.
“As long as it does not affect the competitiveness of the system, this process is beneficial to maintain a stable market,” said Marian Sarbu, CSSPP’s president, adding that mergers make funds bigger and better able to benefit from economies of scale.
The market could “expect other mergers and acquisitions transactions, as part of a natural process,” Sarbu noted, saying that pension fund managers could decide to further restrict their business on an “international, regional or local level.”
In 2012, the funds in the Romanian second pillar returned 10.5%, having invested almost 94% of assets in domestic securities, while the remainder was invested in other EU member states’ bonds.
© 2013 RIJ Publishing LLC. All rights reserved.
If one of your relatives or friends or acquaintances has dementia, you know how stressful, and expensive it can be to treat and support someone with the disease, which sometimes requires years of full-time nursing home care and/or unpaid care by relatives.
A study published this week in the New England Journal of Medicine asserts that the cost of care for people with dementia “represents a substantial financial burden on society, one that is similar to the financial burden of heart disease and cancer.”
“The total monetary cost of dementia in 2010 was between $157 billion and $215 billion,” said the RAND Corporation study. “Medicare paid approximately $11 billion of this cost.”
Those numbers were based on an estimated prevalence of dementia among Americans over age 70 of 14.7% in 2010, and an annual estimated cost per patient of between $31,000 and $70,000.
More specifically, the yearly cost per person was either $56,290 (95% confidence interval (CI), $42,746 to $69,834) or $41,689 (95% CI, $31,017 to $52,362), depending on the method used to value unpaid care, according to the study.
The researchers studied 856 people from the population of 10,903 that participated in the long-term, nationwide Health and Retirement Study (HRS). They were diagnosed on the basis of a 3- to 4-hour in-home cognitive exam and a review by an expert panel.
The cost estimates were based on self-reports of out-of-pocket spending, the use of nursing home care, and Medicare claims data. Unpaid care provided by family members and others was valued at the cost of equivalent formal care or by an estimate of the lost wages of the informal caregivers.
According to a report in the New York Times today, “The RAND results show that nearly 15% of people aged 71 or older, about 3.8 million people, have dementia. By 2040, the authors said, that number will balloon to 9.1 million people.
“The study found that direct health care expenses for dementia, including nursing home care, were $109 billion in 2010. For heart disease, those costs totaled $102 billion; for cancer, $77 billion.
“Researchers project that the total costs of dementia care will more than double by 2040, to a range of $379 billion to $511 billion, from $159 billion to $215 billion in 2010. Because the population will also increase…, the burden of cost per capita will not grow quite as fast, but will still be nearly 80% more in 2040.”
Despite recent equity market highs, 401(k) plan participants still hold a significantly smaller share of their tax-deferred savings in equities than they did before the 2008 meltdown, according to the Spectrem Group’s Retirement Market Insights Report 2013.
Equity exposure has dropped by 10 percentage points. In 2012, 401(k) participants held 36% of their assets in diversified equities and another 13% in company stock. In 2006, these investors had 40% of their assets in diversified stocks and 19% in company stock.
 Investors are taking more risk with their retirement funds than they did in 2008, however, when 401(k) plan participants held just 29% of their assets in equities and 13% in company stock.
Similarly, 401(k) participants just held 21% of their total in money market funds in 2012 versus 32% in 2008. But they still are keeping more funds liquid than in 2006, when just 16% of their assets were invested in money market funds.
Nearly half, or 46%, of plan participants who are age 55 to 64 say their household is not saving enough to meet their financial goals, Spectrem found. Just 35% of participants in that age group expect to retire comfortably.
The Spectrem report showed the concentration of assets and participants of the 401(k) industry in the largest plans. For instance, 40% of the participants (20.2 million) and almost half of the assets ($1.44 trillion) are in the approximately 1,500 plans that have 5,000 or more participants.
At the other extreme, 14% of the participants (7.2 million) and about 11% of the assets ($310 billion) are in the 489,000 plans that have fewer than 50 participants.
 Other insights from the report include:
• Both private and public defined contribution plans continue to outperform private and public defined benefit plans.
• Private sector defined contribution plans, aided by ongoing employee contributions, have surpassed the previous peak in 2007.
• Total U.S. retirement assets grew to $16.3 trillion by year-end 2012 from $15.1 trillion at the end of 2007.
© 2013 RIJ Publishing LLC. All rights reserved.
Affluent investors and financial intermediaries (brokers, advisors) apparently don’t see eye to eye when asked to name their favorite financial services companies, according to two sets of data released recently by Phoenix Marketing International.
When surveyed by Phoenix, the two groups were not asked the same question. Affluent investors were asked to name their ten favorite providers of retirement products. Advisors were asked to name their ten favorite fund companies.
Many of the differences in the lists, which were generated over several survey periods and among advisors in five different distribution channels, seemed to boil down to the simple fact that the investors favored direct providers and the advisors didn’t. American Funds, however, appeared frequently on both sets of lists.
Affluent investors’ picks
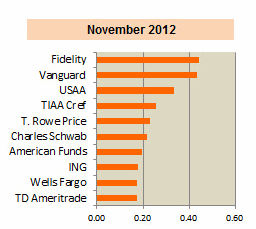
Among investors, Fidelity, Vanguard and USAA had the “highest overall brand impression and consideration as a provider of retirement products and services among affluent investors,” according to four separate surveys by Phoenix Marketing International between May 2011 and November 2012.
Fidelity ranked first in three of the surveys, and USAA ranked third in all four. Vanguard ranked first in the May 2012 survey and second in the other three. Other companies consistently placing among the top 10 were TIAA-CREF, T. Rowe Price, Charles Schwab, ING, and American Funds.
The presence of Vanguard, Fidelity, T. Rowe Price, Schwab and TIAA-CREF on the survey listings suggests that affluent investors are very familiar with the direct and low-cost providers, many of whom specialize in passively-managed index funds. The results of the latest survey can be seen at right.
Advisors’ picks
PIMCO, which specializes in actively-managed bond funds, was ranked among the top five brands, based on “overall impression and consideration to recommend,” by advisors in all five distribution channels. Otherwise, Phoenix found that advisors’ “overall impression and likelihood to consider for recommendation to their clients in the next six months, varies by the advisor’s role and type of firm where they are employed.”

BlackRock was among the top 10 in all five channels. Vanguard, which was rated first by Registered Investment Advisors, was among the top 10 in only one other channel, regional broker dealer, where it was ranked ninth.
Fidelity was on every list except for regional broker dealer, but was never ranked higher than third. American Funds was ranked first or second in each of the three broker-dealer channels, and was seventh in the RIA channel, but was not among the top 10 at national full-service firms (wirehouses). MetLife was on every list but the independent broker-dealer. Franklin Templeton was on every list except insurance broker-dealer.
Advisors in the wirehouse channel were the only ones to list wirehouses among their ten favorite brands (Morgan Stanley and JP Morgan Chase). Similarly, advisors in the insurance broker/dealer channel listed six insurance companies (Genworth Financial, Lincoln Financial, New York Life, Mass Mutual, Prudential, and MetLife) among their most respected brands.
About the surveys
The semi-annual Phoenix study among affluent individual investors has been conducted since November 2008 and was last administered in November 2012 among 1,447 respondents. Study data are representative of the U.S. population by age and geography. Also reported are detailed evaluations of Print and TV advertisements, plus investors’ likelihood to consider such leading brands such as:
Aetna, AIG, Allianz, American Century, American Funds, Ameriprise, Aviva, AXA, Berkshire Life, Charles Schwab, CNA, Columbia Funds, E*Trade, Edward Jones, Fidelity Investments, Franklin Templeton, Genworth Financial, Goldman Sachs, Guardian, The Hartford, ING, Invesco, Jackson National, Janus, John Hancock, Lincoln Financial, MassMutual, Merrill Lynch/Bank of America, MetLife, Morgan Stanley Smith Barney, Mutual of America, Nationwide, Northwestern Mutual, NY Life, Oppenheimer, Pacific Life, PIMCO, Prudential, Putnam, Raymond James, State Farm, Sun Life, TD Ameritrade, T. Rowe Price, The Principal, TIAA-CREF, Transamerica, Travelers, US Trust/Bank of America, Vanguard, and Wells Fargo.
© 2013 RIJ Publishing LLC. All rights reserved.

None of the ads for financial services companies during this year’s NCAA men’s basketball tournament was an absolute slam-dunk, but they were all good, nevertheless. The retirement industry definitely seemed to step up its game for the Big Dance.
In my house, TV viewership spikes during March Madness. My wife graduated from Michigan State and I spent a year at Indiana. My dad went to Temple and my niece just graduated from Syracuse. We always have someone to root for (or against).
I ignore the burger, beer, deodorant and car commercials that flood the coaxial cable during every timeout, but I watch the retirement-related ads with professional interest. There have been lots of them, and there will surely be more this coming weekend.
During the tournament’s first 60 games alone, some 337 commercials from Edward Jones, E*Trade, Fidelity, Northwestern Mutual, Charles Schwab, TD Ameritrade, Transamerica, and USAA were broadcast. Prudential also squeezed at least one of its Blue Sticker ads in there somewhere.
That doesn’t include the 99 “Mayhem” ads from Allstate or the 126 Capital One spots, in many of which Charles Barkley plays straight man to a loopy Alec Baldwin. (Nine of the tournament’s 20 “most engaging” ads, according to iSpot.tv, were from Capital One. The viewers’ favorite? The ad featuring Sir Charles’ freshly laundered briefs.)
 The NCAA tournament, which neatly coincides with tax season each year, obviously delivers the upscale male audience that financial services firms crave. It’s too early to see the demographics of this year’s audience, but Scarborough Research has data from 2012.
Besides skewing male (71%), last year’s audience tended to be slightly older, more affluent and more educated than average. The Boomer share (ages 45 to 64) was 38% (vs. 34.7% for all U.S. adults). About 38% were college grads (vs. 26%), 17.4% had been to graduate school (vs. 11.3%), 28.6% earned $100,000 or more (vs. 20%) and 48.3% owned a home worth $150,000 or more (versus 40%).
Marc Grozalsky of Phoenix Marketing International, which studies financial services advertising, said about “10% to 15%” of the audience is affluent, though retirement companies aren’t interested only in them. “They get the smaller investors too, which helps them in the long run,” he told RIJ this week.
Below you’ll find screenshots from (and links to) the ads I remember best, along with some of my impressions of them. As mentioned above, all of them were good; a few were memorable.
Scorer’s table
Northwestern Mutual (“Earn the Rewards”). My favorite ad, oddly, was sponsored by Northwestern Mutual, which once called itself “The Quiet Company.” This 60-second ad was deceptively simple, and had an undeniable momentum. Driving but dignified wall-of-sound music accompanies the spiraling ascent of a white skyscraper-like Greek column, which rotates as it rises to reveal brief, simple messages in bold block letters. I appreciated the lack of voice-over; it would have been superfluous and perhaps distracting. This ad may not necessarily motivate people to pick up the phone—there’s no “ask” at the end—but it made for effective branding. The robotic welding arms are a cool touch, and the tagline—“Because life feels richer when you feel secure”—rang true. It’s better to feel rich than to be rich, right? There are fewer tax and estate problems.
Prudential (“Age Stickers). This ad appears to be the second installment of Prudential’s ambitious Blue Age Sticker campaign. Its predecessor premiered during the 2013 Super Bowl. Both ads feature a sample of crowd-sourced Americans attaching pie-sized blue dots to a giant white wall in a public park in Austin, Texas. (iSpot.tv says this ad didn’t appear during the basketball tournament, but I saw it somewhere last weekend.)
 The narrator, a real Harvard professor, emphasizes that people are living longer and therefore need more savings. Unfortunately, it perpetuates the myth that our grandparents “didn’t have much of a retirement” because their life expectancy was only 61 and the official retirement age was 65. But, even 70 years or so ago, average life expectancy at age 65 was about 12 years. Average life expectancy at birth was 61 years, due to higher infant mortality.
This ad squeezes almost too much aural and visual information in a brief time-span, but it probably connects with the audience on a level that other ads don’t, thanks to the use of real people. Gotta love the biker-type dude. This ad got a 99% approval rating from people who watched it at iSpot.tv.
TD Ameritrade (“Chef”). This fast-paced ad (below) seemed aimed at a hip, urban, single, young-striver market—not exactly my demographic, but engaging all the same.
 It tells the story of a man who starts as a mere prep cook in a restaurant and then works his way up to chef, eventually opening his own bistro. Art-directed to convey the sense of a modern fable, it features cute fake fish and a crock labeled “Retirement.” I enjoyed it but it made me think more about New York or San Francisco restaurants than about TD Ameritrade. The last frame includes a plug for TD Ameritrade’s $600 get-started bonus for new clients, but it was hard to see and seemed like an afterthought.
Edward Jones (“Long-term Goals”). There’s an edge to this 30-second spot. Like the Saab campaigns in the 1980s and 1990s, Edward Jones seems to be pursuing smart, independent thinkers. It invites people with “audacity” and “nerve” to “join the nearly seven million investors who think like you do.”
“Face time and think time make a difference,” says the narrator, emphasizing an advantage that Edward Jones probably has over an E*Trade or a TD Ameritrade. Edward Jones has a complex challenge here. They’re selling a personal touch, but they don’t show an advisor. That might be too obvious, or perhaps old-fashioned.
 According to Phoenix Marketing International, viewers didn’t warm to the ad’s minimalistic, sophisticated approach. Here’s what a focus group told Phoenix:
I don’t mean to pick on Edward Jones here. These bullet points show just how harsh focus-group participants can be on commercials. The American public may not know much about finance or investing, but it knows what it wants from commercials.
Charles Schwab (“OneSource”). To become absorbed in this commercial, you might have to be interested in ETFs. I personally do not use them and am not even very curious about them, so I mostly paid attention to the swirling bits of grey paper that morphed into a giant ONE or the words ETF OneSource. The 60-second spot emphasized commission-free trading and one-stop shopping. Since this was a product pitch, it ended with a fairly long and rapidly spoken disclaimer, which some people might find annoying.
 Charles Schwab (“Bank Designed for Investors”). See description of Fidelity ad immediately below.
Fidelity (“Cash Management Account”). This ad for Fidelity’s banking services and Schwab’s bank ad went chest-to-shoulder like two opposing seven-foot centers. Both appear to pursue the same type of customer, and they both approach him/her with an upbeat male narrator and a seamless, ever-moving montage of text and color—without people.
Both emphasized the access they provide to no-fee ATMs. Schwab’s team colors were white lines on a blue background; Fidelity’s were green type on a white background. Fidelity effectively used its familiar “Green Line” theme here, both for brand reinforcement and as a thread to tie together the sequence of images. Schwab flashed its familiar “Talk to Chuck” balloon-caption icon. I liked the way Fidelity incorporated U.S. Treasury legal tender typography into its ad. These ads feel almost effortless, as if to say: ‘When you have a really strong brand, you don’t have to strain.’


USAA (“Advice” and “Financial Obstacles”). For USAA’s ads to resonate, you probably have to have a strong connection to the U.S. military. That is USAA’s target market, and its TV advertising is tailored accordingly. The images of soldiers hitting the obstacle course in their camouflage fatigues (in “Financial Obstacles”) can’t help but connect powerfully with veterans.
 I’m not a veteran but I am a father, and one of my emotional bells was rung by the family reunion moment (“Dad!”) in that commercial. Both of these commercials had a clear call to action at the end, which was reinforced by a close-up of the sepia-toned image of the young uniformed soldier and the elderly veteran that illustrates the cover of USAA’s Retirement Guide.
Transamerica (“That Moment It Became Real”). “When did it become real for you?” asks the caption at the end of one of Transamerica’s retirement ads—“It” being retirement. The “When did it become real” concept seemed a bit dated. Lincoln Financial in its FutureSelf commercials and Prudential in its Day One commercials used that type of epiphany.
 The use of two separate stories in this commercial—one with a young mother and her newborn and another with an older executive on the day of his retirement—was probably meant to be all-inclusive, but I found it a bit confusing. I also had to think a moment or two about the meaning of the part of the script that said, “When you leave the only job you ever had for the only one you ever wanted.” It took me awhile to figure out that the second “job” was being a grandparent.
On a positive note, the mention of Transamerica’s 19 million customers at the end of the commercial made a favorable and memorable impact on me. Size does matter.
E*Trade (“Giant Mom Bag”). My inner compliance officer screams “Violation!” every time I see E*Trade’s implicit suggestion that even an 18-month-old can win at day trading, but I can’t resist the E*Trade baby. Neither can other people: The “Giant Mom Bag” spot ranked 12th among the 20 “most engaging” ads of the NCAA tournament.
 In this latest commercial in the infant series, E*Trade takes advantage of investors’ budding awareness of the high fees that they may still be paying on assets in a former employer’s 401(k) plan as a reason for them to roll that money over to an E*Trade IRA.
These ads are undoubtedly effective, and competitors should take heed. (Lest children assume that they too can use E*Trade, the fine-print at the end of the commercial discloses that a person must be 18 years to open a securities trading account.)
© 2013 RIJ Publishing LLC. All rights reserved.
Long-term interest rates are now unsustainably low, implying bubbles in the prices of bonds and other securities. When interest rates rise, as they surely will, the bubbles will burst, the prices of those securities will fall, and anyone holding them will be hurt. To the extent that banks and other highly leveraged financial institutions hold them, the bursting bubbles could cause bankruptcies and financial-market breakdown.
The very low interest rate on long-term United States Treasury bonds is a clear example of the current mispricing of financial assets. A ten-year Treasury has a nominal interest rate of less than 2%. Because the inflation rate is also about 2%, this implies a negative real interest rate, which is confirmed by the interest rate of -0.6% on ten-year Treasury Inflation Protected Securities (TIPS), which adjust interest and principal payments for inflation.
Historically, the real interest rate on ten-year Treasuries has been above 2%; thus, today’s rate is about two percentage points below its historical average. But those historical rates prevailed at times when fiscal deficits and federal government debt were much lower than they are today. With budget deficits that are projected to be 5% of GDP by the end of the coming decade, and a debt/GDP ratio that has roughly doubled in the past five years and is continuing to grow, the real interest rate on Treasuries should be significantly higher than it was in the past.
The reason for today’s unsustainably low long-term rates is not a mystery. The Federal Reserve’s policy of “long-term asset purchases,” also known as “quantitative easing,” has intentionally kept long-term rates low. The Fed is buying Treasury bonds and long-term mortgage-backed securities at a rate of $85 billion a month, equivalent to an annual rate of $1,020 billion. Since that exceeds the size of the government deficit, it implies that private markets do not need to buy any of the newly issued government debt.
The Fed has indicated that it will eventually end its program of long-term asset purchases and allow rates to rise to more normal levels. Although it has not indicated just when rates will rise or how high they will go, the Congressional Budget Office (CBO) projects that the rate on 10-year Treasuries will rise above 5% by 2019 and remain above that level for the next five years.
The interest rates projected by the CBO assume that future inflation will be only 2.2%. If inflation turns out to be higher (a very likely outcome of the Fed’s recent policy), the interest rate on long-term bonds could be correspondingly higher.
Investors are buying long-term bonds at the current low interest rates because the interest rate on short-term investments is now close to zero. In other words, buyers are getting an additional 2% current yield in exchange for assuming the risk of holding long-term bonds.
That is likely to be a money-losing strategy unless an investor is sagacious or lucky enough to sell the bond before interest rates rise. If not, the loss in the price of the bond would more than wipe out the extra interest that he earned, even if rates remain unchanged for five years.
Here is how the arithmetic works for an investor who rolls over ten-year bonds for the next five years, thus earning 2% more each year than he would by investing in Treasury bills or bank deposits. Assume that the interest rate on ten-year bonds remains unchanged for the next five years and then rises from 2% to 5%. During those five years, the investor earns an additional 2% each year, for a cumulative gain of 10%. But when the interest rate on a ten-year bond rises to 5%, the bond’s price falls from $100 to $69. The investor loses $31 on the price of the bond, or three times more than he had gained in higher interest payments.
The low interest rate on long-term Treasury bonds has also boosted demand for other long-term assets that promise higher yields, including equities, farm land, high-yield corporate bonds, gold, and real estate. When interest rates rise, the prices of those assets will fall as well.
The Fed has pursued its strategy of low long-term interest rates in the hope of stimulating economic activity. At this point, the extent of the stimulus seems very small, and the risk of financial bubbles is increasingly worrying.
The US is not the only country with very low or negative real long-term interest rates. Germany, Britain, and Japan all have similarly low long rates. And, in each of these countries, it is likely that interest rates will rise during the next few years, imposing losses on holders of long-term bonds and potentially impairing the stability of financial institutions.
Even if the major advanced economies’ current monetary strategies do not lead to rising inflation, we may look back on these years as a time when official policy led to individual losses and overall financial instability.
© 2013 Project Syndicate.
W&S Financial Group Distributors, Inc., the wholesale distributor of annuities and life insurance from Western & Southern Financial Group companies, has introduced Retirement Picture, an interactive online tool designed to provide a snapshot that supports better understanding of retirement goals and risks.
“By helping depict retirement choices and their associated risks, Retirement Picture provides financial professionals with conversation starters based on a client’s self-identified interests and readiness,” said Mark E. Caner, president of W&S Financial Distributors.
Clients using Retirement Picture develop visuals of retirement lifestyle scenarios through a series of interactive screens. Users choose scenarios of interest and gauge their retirement risk preparedness for each. The resulting report captures a picture of their retirement that may then be pursued with the financial representative. No personal identifying or protected information is required to use the tool. Clients may access it via a computer or mobile device, with a financial representative or on their own.
© 2013 RIJ Publishing LLC. All rights reserved.
Jackson National Life has established two new “thought-leadership” platforms: The Alternative Investment Learning Center, a LinkedIn group for registered advisors, and a public site, the Center for Financial Insight, for consumers, advisors and Jackson employees.
The two new online resources are intended to serve as part of Jackson’s educational strategy by “offering insights on many aspects of financial planning,” the company said in a release. Jackson’s Elite Access variable annuity, a vehicle designed for tax-deferred use of alternative investments, was ranked 12th in sales among all VA contracts in 2012, according to Morningstar, Inc.
Content at the Center currently includes:
The Alternative Investment Learning Center is a forum for registered representatives who hold at least a FINRA Series 6 or 7 registration. Advisors will be able to access educational materials on alternatives and discuss alternative investment strategies.
Advisors from Jackson’s affiliated broker-dealer network, National Planning Holdings, Inc., will be invited to join the group first. Jackson will invite advisors from other broker-dealers to join as the company receives approval from their broker-dealer back offices.
In addition to the LinkedIn group and the Center for Financial Insight, Jackson’s educational efforts include a focus on alternative investment strategies. In January, Jackson announced a plan for alternative education training in 2013, including 30 regional half-day training events, six national full-day training sessions, 120 alternative education training sessions, 130 alternative investment Continuing Education (CE) training sessions and a variety of virtual opportunities, including Quarterly Alternative Market Webcasts and monthly alternative investment conference calls.
© 2013 RIJ Publishing LLC. All rights reserved.
If you’re an advisor searching for new clients, you can probably draw a rough sketch of your target demographic. You know who those folks are: Boomers, professionals, business owners, married homeowners in affluent zip codes, and so forth.
The latest U.S. Census data (for 2011) on Americans net worth can help you refine that picture and enrich your understanding of wealth in America. Some of the data will likely confirm the picture you already have. Other data may surprise you.
As you’d expect, people accumulate more wealth as they age (until age 70 or so). Higher education and wealth go hand in hand. Couples and homeowners tend to have more wealth than single people (especially single women) or renters.
More surprising may be the statistic that half of all Americans have virtually no wealth beyond home equity. In fact, only two demographic groups have median non-home net worth of over $100,000: people with graduate degrees and those ages 55 to 64.
Above all, the census data indicates that wealth is much more highly concentrated among the few than our egalitarian ethos might suggest. The huge difference between median wealth and average wealth in almost every demographic category bears that out.
Here’s some of what the Census figures for 2011 show about wealth in the U.S.:
High averages, low medians
About 48.6 million U.S. households are headed by someone over 55. Of those, about 22.3 million are led by Boomers ages 55 to 64. Boomers may no longer excite consumer product advertisers the way they used to, but they have money.
The 55+ crowd has been saving and paying off their homes for many years, and collectively they have a lot to show for it. Americans ages 70 to 74, for instance, have an average net worth of $861,537 ($719,800 excluding their homes). Those ages 65 to 69 have average net worth of $820,000 ($663,700 excluding their homes) and those ages 55 to 64 have average net worth of $468,000 ($352,000 excluding their homes).
The median figures for those groups are much, much lower, however. Excluding home equity (which ranges from $97,000 to $130,000), half of all Americans ages 70-74 have a net worth of less than $31,800. Half of those 65 to 69 have a net worth less than $44,000. Half of those ages 55 to 64—the Boomers—have a net worth less than $45,400.
The over-$500,000 group
The discrepancy between the average and median figures suggests that wealth is clustered in the wealthiest half of the population. While the dataset I’ve used doesn’t illuminate the distribution of wealth within the upper half, it does indicate that only 16,021,000 households (13.5%) are worth over $500,000.
Those 16 million households have an average non-home net worth of $1.6 million ($1.9 million with home equity), but their median non-home net worth is just $589,000 ($836,000 with home equity). In other words, only about 8 million U.S. households, or about 6.75% of the total, have more than $589,000 in non-home wealth.
Business ownership is high among the wealthy. People in households with more than $500,000 in net worth are about twice as likely as the average household to own a business or have a profession (28.7%). Their business equity averages $548,400 but has a median of only $70,000—an indication that the equity is concentrated in a minority of highly valuable businesses.
High-net-worth households are also more likely than average to own rental property. The most likely landlords are those with net worth over $500,000 (21.3%), people in the highest income quintile (12.4%), people with advanced degrees (10.9%) and married couples ages 55 and over (10%). Overall, only 5.5% of U.S. households own rental property.
The impact of education
Even more so than age, net worth is linked to education. Every step upwards in the educational ladder, from less-than high school degree to more-than a bachelor’s, brings a geometric step-up in average and median wealth.
Consider this differential: For those with less than a high school diploma, the average net worth is just $46,000 (excluding home), and the average 401(k) balance is a mere $41,500. For those with a graduate or professional degree, the average net worth (excluding home), is $776,000 and the average 401(k) account balance is $270,000.
A four-year degree is also a lot more valuable than a two-year degree. The average net worth of those with a bachelor’s degree is $403,000, excluding home, and their average 401(k) balance is $134,000. For those with just an associate degree, the average net worth is $189,000 and the average 401(k) balance is $71,000.
Ownership of money market accounts is highly correlated with education. Only 2.6% of those without high school diplomas own them, while 24.2% of those with bachelor’s degrees and 31.3% of those with advanced degrees do.
Similarly, ownership of stocks and mutual funds ranges from 3.4% for those without a high school degree to 32.3% for those with a bachelor’s degree and 41.6% for those with advanced degrees. People with a bachelor’s or higher were more likely to own stocks and mutual fund shares than people of any age group, including those 55 and older.
People with net worth over $500,000, people in the highest income quintile, and people with advanced degrees—groups that surely overlap to a great degree—are, not surprisingly, by far the most likely to own stocks and mutual funds, money market accounts, and municipal or corporate bonds.
Asset concentration
The highest single data cell in the Census wealth data was in the average ownership of “interest-bearing assets” (other than interest-bearing assets at financial institutions) among the 7,779 households that are in the 65- to 69-year-old age bracket.
On average, they owned $4.77 million in such assets. The median ownership by that group was just $27,000. (Oddly, people ages 70 to 74 owned on average only $166,000 worth of those assets. The $4.77 million number may have been a mistake in the data.)
At the other extreme of wealth, the net worth of blacks and Hispanics trails that of non-Hispanic whites to a degree that belies the conventional wisdom that minorities have benefited from a lavish outlay of affirmative action efforts and government largesse over the past several decades.
The median non-home net worth of white, non-Hispanic households is $89,537. For the 15 million black households, the median is $6,314. For the 14.1 million Hispanic households it is $7,683. Excluding home equity, the numbers are $24,000 for whites, $2,100 for blacks and $4,000 for Hispanics.
Other demographic categories with net worth significantly below the national median are households headed by people under age 35, by women, by the unemployed, by those in the lowest income quintile, and by renters.
Retirement accounts
The groups with the highest average 401(k) or TSP balances are single male householders ages 35 to 54 at $972,000 (a suspiciously high number that could be an error), followed by those with net worth over $500,000 ($399,000) and those with graduate or professional degrees ($270,000). The groups with the highest average IRA or Keogh balances are households ages 65 and older ($458,000) and those with net worth over $500,000 ($422,000).
Census factoids
© 2013 RIJ Publishing LLC. All rights reserved.
Median non-home wealth (total wealth minus home equity) in the U.S. declined by 27% from 2001 to 2004, according to “The Asset Price Meltdown and the Wealth of the Middle Class,” a new paper by Edward Wolff of New York University.
Then came the next boom-and-bust: From 2004 to 2007, median wealth grew by 20% and median non-home wealth by 18%, only to hit the Great Recession, when house prices fell by 24% in real terms, stock prices by 26%, and median wealth by 47%.
Wolff’s paper (NBER Working Paper No. 18559) shows how the debt of the middle class had already increased significantly over the previous two decades, and he investigates trends in wealth inequality from 2007 to 2010.
The top wealth (and income) groups saw the percentage increase in their net worth (and non-home wealth and income) rise rapidly from 1983 to 2010. The upper 20% of households saw the biggest gains in wealth and income. The top one percent received 38% of the total growth in net worth between 1983 and 2010.
The average wealth of the poorest 40% percent declined from $6,200 (in 2010 dollars) in 1983 to negative $10,600 in 2010. The share of households with zero or negative net worth rose to 22.5% from 18.6%, and the share with zero or negative non-home wealth rose from to 30.9% from 27.4%.
Middle class malaise
Among the middle class (the middle three wealth quintiles), the debt-to-income ratio rose to 157% from 100% between 2001 and 2007, while the debt-to-equity ratio rose to 61% from 32%.
From 2007 to 2010, however, while the debt-to-equity ratio continued to advance to 71.5%, the debt-to-income ratio fell to 135% because overall debt among the middle class fell by 25% in real terms. The continued rise in the debt-to-equity ratio over these years reflected the 47% drop in net worth.
Their high degree of leverage and the high concentration of assets in their home helps explain the damage done to middle class finances during the Great Recession, Wolff found.
The steep decline in median net worth between 2007 and 2010 was primarily due to the very high negative rate of return on net worth of the middle three wealth quintiles. This, in turn, was due to the big drop in home prices and the high degree of leverage of the middle wealth quintiles.
High leverage also helps to explain why median wealth fell more than house (and stock) prices over these years and declined much more than median household income.
African-American and Hispanic households suffered more than whites during the Great Recession, Wolfe found. Both groups had a higher share of homes in their portfolio than did whites and much higher leverage than whites.
The mean net worth of Hispanic households was cut in half, as was their mean non-home wealth. Hispanic home ownership rate fell by 1.9 percentage points, and their net home equity fell 48%. A high percentage of Hispanics evidently bought their homes close to the housing cycle peak.
© 2013 RIJ Publishing LLC. All rights reserved.
Less than 20% of Americans fully trust their financial services provider, a five-point drop since 2010, according to Hearts & Wallets, a Boston-area research firm. The study identifies major trust factors and identifies the firms most trusted by their clients.
The study showed that 55% of investors fear being ripped off by their financial advisors. The number of investors who trust their advisors has steadily declined since Hearts & Wallets’ first trust-related study five years ago.
“Trust-building initiatives aren’t necessarily the first thing to come to the mind for firms who want to grow; tactics like a new product launch or rollover initiatives have typically been more common,” Hearts & Wallets said in a release. “But the impact of improving trust should be on the radar screen.”
Trusted providers enjoy average share of wallet that is nearly double less trusted providers, Hearts & Wallets found. Where trust is higher, investors are more likely to make referrals and plan to make future investments.
The basis of trust
Trust often depends on how well the investor “understand[s] how the advisor and firm earn money.” Knowing specific fees is much less important than understanding how the advisor’s system of incentives works.
“It’s usually fine with investors if there is a mix of salary, fees and commissions. It’s reasonable for a financial professional to earn a living, and only a few investors truly want to write checks out of pocket for the cost of expertise. The important thing is to ask, to discuss, and to understand,” said Laura Varas, a Hearts & Wallets principal.
Clients say they tend to trust a provider who “is unbiased and puts my interests first,” “understands me and shares my values” and is “responsive.” On average, a person who is anxious about their financial future trusts their providers 0.5 rating points less than a person who feels secure.
Full-service brokerage and insurance firms slightly outperformed self-service brokerage firms in terms of customer base percentage who highly trust them. Edward Jones and Ameriprise lead in full-service brokerage with 46% to 48% of their customers rating them highly trusted. USAA leads in self-service firms at 58%.
The Hearts & Wallets Insight Module, Trust-Building Practices: An Empirical Analysis of What Drives Trust, is the latest report from Hearts & Wallets’ 2012/2013 Investor Quantitative Panel. This annual survey of more than 5,400 U.S. households tracks specific segments and product trends and is both a proprietary database and series of syndicated reports.
© 2013 RIJ Publishing LLC. All rights reserved.
Search for “bottled water” on Google and you’ll find many brands of thirst-quenching H2O ranging in price from under $5 to over $400 per 750 ml. Yet, you can often find water that’s just as healthy—and much cheaper—running from a tap or bubbling up from a spring.
Planning software programs for advisors are almost as ubiquitous as water and they vary just as much in price. You can find bargains as well as big-ticket software. Fortunately for advisors, market competition is helping drive down prices.
In the past few years, several useful reviews of planning software have been published. These include a 2011 review by David McClure, this publication’s own listing of major software available, and reviews of free online retirement calculators by Steve Vernon (CBS Moneywatch) and Kim Morten, an associate of Dana Anspach (editor of Moneyover55.about.com) [1].
McClure claimed that a successful FPS package meets at least four criteria:
Annual subscription fees for McClure’s favorite packages ranged from $400 to over $6,000, with most between $1000-1300. His review covered eMoney 360 and eMoney 360Pro Version 7.0, MasterPlan, NaviPlan Select, PFP Notebook, PFP Relief, Profiles Forecaster, and Profiles Professional.
Some packages, such as PFP, were developed by accounting experts, not financial planners. Some were standalone packages designed for installation on desktop PCs while others relied on web-based processing. The latter allows the client to log on and lets the advisor know when the client logs on and what pages he looks at.
In May 2012, this publication created a kind of “Michelin Guide” of FPS, which listed 27 programs along with a brief description of each. (References are made in footnotes at the end to reviews of individual programs, including McClure’s review. These can be found here: http://bit.ly/Y2M57O.)
Many of the FPSs cater to brokerage houses and focus more on the accumulation stage rather than the decumulation, RIJ’s review said. It noted however that “other, smaller firms that, although less well known, often have stronger retirement income functionality than the dominant brands, which, like most advisors, still tend to be investment- and accumulation-driven.”
Among those smaller firms were Asset Dedication, Fiducioso Advisors, Wealth2k (whose Income for Life Model uses a time-segmentation or floor-and-upside tool) and LifeYield (a specialty tool that models tax-efficient drawdown). The likely trend is that as more Boomers head towards retirement, software vendors will pay more attention to the retirement income components of FPSs.
Financial Planning Calculators (FPCs)
In early 2012, Kim Morten tested and reviewed seven online FPCs, including ESPlanner Basic, Vanguard, AARP, T. Rowe Price, Schwab, Fidelity, and CNNMoney. She created a review for for each one, using an outline which describing its main function, target audience, best feature, pros, cons, visual appeal, ease of use and shortcomings.
Her work showed that every calculator was constrained by its own underlying assumptions. Some calculators, she found, allow you to change some of the assumptions, while others do not. Monte Carlo simulation was featured on three of them. All handled pre-retirement clients but only a few accommodated retirees as well. Most of them did not handle taxes well, Morten noted, and none gave advice on a tax-efficient order of withdrawal from various accounts.
In her opinion, ESPlanner, used in “conventional” mode, was the best calculator. Ironically, Boston University economist Lawrence Kotlikoff, the creator of Esplanner.com, has gone to great length explaining why conventional planning is not good.
While ESPlanner allows for a conventional planning mode for purposes of comparison, it favors an approach called “consumption smoothing”. Under this approach, a family should use a combination of earned income, investments, debt and insurance to maintain a smooth and steady level of consumption over the entire “lifecycle” of its client.
The full version of ESPlanner (Morten tested only the free online version) takes into account all of the financial variables linked to a household as a unit of consumption, including education, first and second homes, Social Security, and in particular, taxes and tax-advantaged retirement accounts[2].
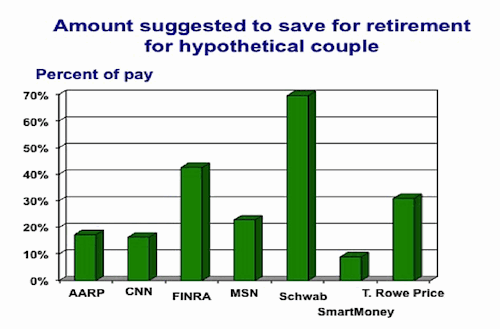
In August 2012, financial planner Steve Vernon wrote a four part series in which he reported his tests of seven online calculators. Like Morten, he tested free calculators offered by AARP, CNNMoney, Schwab, and T. Rowe Price. He also reviewed calculators provided by FINRA, Microsoft Network (MSN) and the now-defunct Smart Money magazine and website. Going a step farther than Morten, Vance challenged each tool to generate a plan for the following hypothetical client:
The couple contributes $9,000 to their retirement account each year. Neither expects an employer-sponsored defined benefit pension. Both want to retire at age 65, and they’re targeting an income replacement rate in retirement of 85% of final pay.
If not prompted to provide specific information, Vance allowed each calculator to use its default assumptions. He found that the calculators recommended a savings rate for the couple that ranged from a low 9% to a high of almost 70%. His results are summarized in Figure 1 below (chart used with permission).

Of the seven calculators Vernon reviewed, he preferred the ones offered by AARP and MSN. He advised anyone who attempts to plan for retirement on their own to use two or three different calculators, to vary their assumptions with each one, to cross-check their results and to repeat their calculations as they get older.
“Every two or three years, revisit your calculations of how much you should be saving and run the numbers again,” Vernon wrote. “It’s definitely worth the effort to try a few different assumptions to see how they affect the results.” He recommended picking answers to the following questions and sticking to them:
It’s interesting to note that Vernon selected his calculators on the basis of what showed up on the first page of search engine. That they were the most popular (or frequently used) doesn’t necessarily indicate that they are the best.
Closing thoughts
I have searched the web extensively over the past couple of years for some additional free or low-cost online calculators. Two programs that were good in terms of the features offered and/or the robustness of underlying methodology were Firecalc.com and I-ORP.com.
In addition, Excel-based calculators available for downloading can be found atwww.Analyzenow.com and www.retirementoptimizer.com/.[3] Tip$ter (www.prospercuity.com/) and Forecaster (http://www.retirementforecaster.com/default.html) are two downloadable self-executing programs that can be installed onto Windows based PCs. The features of these calculators will be presented in the next article in this series.
Ideally, an objective third-party should test all of the major professional FPSs the same way that Steve Vernon tested the online calculators. Criteria need to be defined, and two or three scenarios need to be created and applied to each FPS (and Excel-based calculators) to determine the best accumulation-stage software, the best decumulation-stage software, and the best overall package (if there is one).
The test results should be clearly presented in graphical form, and each product’s features should be tabulated to make comparisons easy. Until someone does that, many FPs will struggle to find the best programs for their clients, and will likely end up sticking with whatever program is most familiar to them.
D. Alan Barnett, a mid-stream Boomer who will shortly launch his second career, by training to become a Retirement Income Counselor.
[1] Found here : http://www.theprogressiveaccountant.com/reviews/review-financial-planning-software-2011.html)
Vernon, search for his name under: http://www.cbsnews.com/moneywatch/
Morten: http://moneyover55.about.com/od/howmuchtoretire/ig/Retirement-Calculator-Reviews/
See also http://moneyover55.about.com/od/preretirementplanning/a/retirementcalculators.htm
[2] All of these features are found in the full version, which costs $150. She tested the free online calculator.
[3] Analyze now has a free version, and a low-fee version. Retirementoptimizer has an annual fee of $99 whether it is for personal use or used by a FP. I hesitate including ESPlanner in this group as well, because its personal version is slightly more expensive at $150-$199 (including Monte Carlo) while its professional version is $950. Each has an annual update fee of $50.
Net cash flows into variable annuities dipped into negative territory for the first time in over a decade in the fourth quarter of 2012, but finished the year in the black, according to Morningstar Inc.’s latest Variable Annuity Sales and Asset Survey.
“The industry net cash flow number for fourth quarter was grim at $(598.5) million, the first quarter of net redemption reported since VARDS began the net flow survey in 2001,” wrote Project Manager Frank O’Connor of Morningstar’s Annuity Research Center in his quarterly report.
“A spike in outflows from group contracts and continued large outflows from companies that have exited the business were the major components of the precipitous drop, while continued strength was observed in the net cash flows of the active retail market providers,” he noted. “Net cash flow for the year remained in positive territory at $14.0 billion.”
Babyboomers in 403(b) plans are reaching retirement age, and older blocks of group annuity business are maturing and calving off, like icebergs from a glacier. At the same time, advisors are moving clients’ money out of variable annuities that were issued by companies that have left the individual VA business, such as The Hartford and ING, and not moving it to another variable annuity.
More money went into VAs than came out, however. The exodus was offset by the demographically-driven demand for lifetime income products—evidenced by the fourth-quarter 2012 gross sales of $34.4 billion (down 5.4% from the third quarter) and $143.4 billion for the year, down 6.5% from $153.7 billion in 2011.
A large chunk of the decline could be attributed to MetLife’s intentional curtailment of VA sales. In 2011, MetLife sold $28.44 billion worth of VAs. In 2012, the company collected $17.7 billion in new VA premium.
The top five issuers alone accounted for more than half of gross VA sales last year; the top ten sellers captured 77.7%. In 2012, Jackson National led all sellers in the fourth quarter with a 13% market share ($4.43 billion), followed by Prudential (11%; $3.78 billion), MetLife (10.5%; $3.56 billion), TIAA-CREF (9.9%; $3.36 billion) and Lincoln Financial (9.3%; $3.16 billion).
Although rising stock prices in 2012 pushed the outstanding asset value of variable annuity subaccounts to a record $1.64 trillion (up slightly from $1.62 trillion in the third quarter of 2012 and up 9.1% from $1.5 trillion in the fourth quarter of 2011), VA sales didn’t seem to climb in tandem with equities, as they have in the past.
“That might be exuberance—people thinking they don’t need protection. They might be saying, ‘I don’t need it because look how well the market is doing,’” O’Connor told RIJ. But he added that last year’s bull market might have been different from previous one.
“It doesn’t look like the individual investors are back in the market,” he said. “You’ve got a lot of institutional money and buybacks—there are other things going on that have helped to drive equity prices higher.”
Protection from cat food
O’Connor, who has analyzed variable annuity sales data for more than a decade, said that the pendulum may have swung back too far in the past five years—from an era of under-pricing and generous benefits to one of high prices and stingy benefits. In the first era, carriers hurt their own balance sheets; they may now be hurting their own value proposition.
Fees may have reached an intolerable point, relative to benefits. Fees shouldn’t matter much to people who are buying VAs for lifetime income, O’Connor believes, because the potential insurance value dwarfs the cost. But if people are buying living benefit riders as investment risk protection rather than as longevity risk protection, then high fees are clearly counter-productive.
“If you sell the product that way”—as a hedge for market risk—“then of course fees will make a big difference,” O’Connor said. “But there has been widespread misunderstanding of what the product is supposed to do.”
Articles in the media about variable annuities tend to stress the investment aspect, he said. “Especially in articles when the product is panned, the author will explain in detail how fees will eat away at the nest egg. I’ve yet to see an article that mentions that when you’re 95, these products can protect you from a diet of cat food. That part gets completely ignored or glossed over.”
VAs were misunderstood in another way, he said. Anecdotally, many people seemed to believe that a VA with an annual benefit base increase of 6% (a “rollup”) offered a 6% guaranteed return. “I’ve heard that from relatives and from friends, and from friends who would relay what their relatives had been told. I’ve heard it more than once,” O’Connor said.
Asked to assess the VA business from a historical perspective, O’Connor said: “I see an industry that innovates, and that tries to capitalize on innovation. At the same time, I wonder if the me-too activity that got the industry into trouble has come home to roost. There was a mad drive for sales, then a throttling back.
“The really solid players—Prudential, MetLife, Jackson—seem to have gotten a better handle on risk than the others. But is it really a handle? Before the financial crisis, the life insurers all said they had the risk challenge knocked. Who knows what will happen in the next downturn. Will it blow up the models they’re using today?”
Other Morningstar data
Sales rankings stayed much the same in 2012 as in 2011, with a few notable position changes. MetLife moved down two notches to third place, Nationwide slipped from 6th to 11th and Allianz Life moved down to 16th place from 11th place. Going in the opposite direction, Protective moved up to 13th place from 16th, Ohio National moved up to 15th place from 18th, and Fidelity Investment Life jumped to 17th place from 22nd.
In terms of product rankings, there were several fast-growing contracts: Lincoln Financial’s Choice Plus Fusion (to 22nd from 134th), Protective’s Dimensions (to 25th from 140th), AXA Equitable’s Structured Capital Strategies B (to 17th from 42nd), Fidelity’s Personal Retirement Annuity I (to 14th from 27th), Ohio National’s OnCore Premier (37th from 62nd) and OnCore Lite II (to 43rd from 75th).
© 2013 RIJ Publishing LLC. All rights reserved.
New York Life has promoted Matthew Grove, a force behind the firm’s billion-selling deferred income annuity, to senior managing director, responsible for the Retail Annuities business, including product development, product management, marketing, in-force business and annuity service operations. He reports to Senior Managing Director Drew Lawton.
Grove joined New York Life in 2009 to lead the company’s effort to establish guaranteed lifetime income as an asset class, and he was also responsible for the distribution of mutual funds and annuity products through Registered Investment Advisors (RIAs).
In 2011, Grove played a central role in developing and marketing the Guaranteed Future Income Annuity (GFIA), a deferred income annuity. Attracting $1 billion in premium in its first 18 months on the market, it is the most successful new annuity product in the company’s history, New York Life said in a release.
Before joining New York Life, Grove was the chief marketing officer of Jefferson National, an insurance company focused on serving the needs of the RIA market. At Jefferson National, he was responsible for developing and marketing the leading annuity product distributed through the RIA channel.
Earlier, Grove ran his own technology consulting firm focused on building enterprise software for financial services firms. He has an MBA from Columbia University and a BS degree in computer science from the University of Pennsylvania.
To enable financial advisors to generate on-the-spot proposals for their clients, Curian Capital LLC has launched the Curian Select Portfolios iPad application, or app. The app lets advisors:
The Curian Select Portfolios iPad app has many of the same features available for the Select Portfolios on Curian’s existing proposal generation system, allowing advisors to seamlessly transition to the new iPad version.
In addition, the app provides investor-facing educational messages and informational videos, including details on Curian’s asset management process used in generating its new Select Portfolios.
The Curian Select iPad app is a free download for financial advisors authorized to do business with Curian, and is available via the Apple iTunes Store, under “Curian Select.”
Genworth Financial, Inc. has agreed to sell its Wealth Management business, including Genworth Financial Wealth Management and alternative solutions provider, the Altegris companies, to a partnership of Aquiline Capital Partners and Genstar Capital.
The sale price is expected to be about $412.5 million. The company will record an after-tax loss of approximately $40 million related to the sale with approximately $35 million recorded in the first quarter of 2013 and the remainder upon closing.
The sale is expected to close in the second half of 2013, subject to customary conditions and regulatory approvals. Net proceeds from the transaction will be used to address the 2014 debt at maturity or before.
Goldman, Sachs & Co. and Sullivan & Cromwell LLP advised Genworth on this transaction.
© 2013 RIJ Publishing LLC. All rights reserved.
Pension funds continue to suffer from the low-rate environment, according to Milliman’s 2013 Pension Funding Study, which cover the 100 largest US corporate pension plans. These plans ended 2012 with a $388.8 billion deficit—a $61.1 billion increase over 2011.
Since the end of 2010, declining discount rates (4.02% at year-end 2012) have widened the pension funding deficit by more than $150 billion, driving record deficits in each of the last two years, Milliman said in a release.
The pension funding ratio stood at 77.2% at year’s end, down from 79.2% at the end of 2011. The deficit increase and reduced funding ratio in 2012 occurred despite plan sponsors’ efforts to halt the decline through de-risking and despite rising stock prices.
“There was no fighting the inevitable gravity of these low interest rates, as the 100 pension plans in our study saw a cumulative deficit increase in excess of $60 billion. All this in spite of strong asset performance that exceeded the expectations of most plan sponsors,” said John Ehrhardt, Milliman consulting actuary and co-author of the study.
“Pension funding status will continue to be tied to interest rates. If rates stay low—and all indications are that they will through 2014—these pension plans will struggle to fill their funding gap.”
Major pension stories for 2012 include:
De-risking results in shakeup at the top of the Milliman 100. IBM’s plan replaced General Motors’ in 2012 as the largest in the Milliman 100, after GM sold much of its obligation to Prudential. Other large plan sponsors, including Ford and Verizon, also pursued de-risking. Across the entire Milliman 100, de-risking by at least 15 plan sponsors resulted in a cumulative $45 billion reduction in plan obligations.
Asset increases and $61.5 billion in contributions were not enough to close the deficit. With an 11.7% investment return in 2012, the Milliman 100 pension plans performed better than they expected but not enough to offset the ballooning deficit. Nor were contributions in excess of $60 billion.
Record contributions in 2012—but not at the level expected. While the $61.5 billion in contributions during 2012 was significantly greater than most prior years, it exceeded the 2011 total by only $6.3 billion and the 2010 total by only $1.8 billion. Many plan sponsors apparently changed their contribution strategy after the MAP-21 interest rate stabilization legislation passed.
Another record year for pension expense. Following a $38.5 billion charge to earnings in 2011, the Milliman 100 pension plans again set a new record for total pension expense, with a $55.8 billion charge to earnings. The $17.3 billion increase in pension expense is consistent with the prediction of $16 billion reported by last year’s study. This year’s study predicts a $7.6 billion increase in pension expense in 2013.
Asset allocations relatively stable. In 2011, plan sponsors decreased their equity allocation by more than 5%. In 2012, the equity allocation dropped just 0.2% (to 38% from 38.2%), as the move toward liability-driven investments (LDI) slowed. In 2012, the bull market favored plans with relatively higher equity allocations.
What to expect in 2013. With the Federal Reserve Board indicating its intention to keep interest rates low through 2014, pension obligations will remain high. The bull market has continued into 2013, and de-risking may continue this year. But the pension funding deficit is likely to last until interest rates rise.
© 2013 RIJ Publishing LLC. All rights reserved.