How did the conspiracy theory about confiscating 401(k) assets get started? Some say that the chronological ground zero was economist Teresa Ghilarducci’s October 2008 testimony before Congress, when she suggested replacing the flawed 401(k) system with mandatory contributions to private retirement accounts. For that comment, Rush Limbaugh labeled her the “most dangerous woman in America.”
A year later, in early November 2009, shortly after BusinessWeek reported that the government was interested in exploring the idea of income options in DC plans, Limbaugh said on his ubiquitous radio show (Thanks to David Shankbone for archiving a much longer excerpt):
“Do you know what’s going to happen to you? We don’t know what’s going to happen, but do you know what the Democrat plan for your 401(k) is?”
“Then we’re going to take it. We’re going to take your 401(k), and we will put it in your Social Security account that the government is monitoring for you, and we will invest every year in 3% government bonds.”
“The bottom line is, they’ll take your 401(k) and put it in Social Security.”
Last February 2, the Departments of Labor and Treasury published their RFI in the Federal Register. It consisted of 39 open questions to the public. The 13th question—the numbering may have been unwise—read as follows:
13. Should some form of lifetime income distribution option be required for defined contribution plans (in addition to money purchase pension plans)? If so, should that option be the default distribution option, and should it apply to the entire account balance? To what extent would such a requirement encourage or discourage plan sponsorship?
On February 17, two weeks after the DoL’s RFI was published, Newt Gingrich and Peter Ferrara published an opinion piece in Investor’s Business Daily that seemed to seize on this question. It said in part:
“In plain English, the idea is for the government to take your retirement savings in return for a promise to pay you some monthly benefit in your retirement years.
“They will tell you that you are ‘investing’ your money in U.S. Treasury bonds. But they will use your money immediately to pay for their unprecedented trillion-dollar budget deficits, leaving nothing to back up their political promises, just as they have raided the Social Security trust funds.”
Four days after Gingrich’s IBD article appeared, the syndicated radio host Bob Brinker was asked about the issue by a caller. Brinker, whose show runs on dozens of U.S. stations, mused on the issue, and then added his own opinion:
“This basically started with hearings that were held by committees involving the politicians you mentioned… And what they did, they had a witness come into the hearing from the New School in Manhattan, and her name was Teresa Ghilarducci.
“Teresa’s idea is to develop a program that would allow 401(k) members… to convert those accounts to government retirement programs. Now what that would involve, if you elected to convert your account, you would give all the money in your 401K to the United States government… and in return for that, you would receive a guaranteed retirement payout for the rest of your life once you became eligible…
[The caller pointed out that even though they are saying it’s not going to be mandatory, if it doesn’t get much participation, they will turn around and make it mandatory.]
“I think that if it’s not voluntary that you are absolutely right… Not only would I oppose it vehemently, but I would expect that large numbers of 401K holders people across America would rise up in protest of a mandatory confiscation-that’s what it would be…
“If they made it mandatory that would mean that the United States Government… would confiscate all assets in 401K and replace those assets with a guaranteed retirement payout. Now I think if they proposed that to be mandatory that would be a dramatic step toward basically a Socialist system in Washington.”
[Ken said that would be just like they did in Argentina.]
“I don’t know where Ms. Ghilarducci got her idea, but I noticed that her testimony occurred not that far away from El Presidente Christina in Argentina announcing that the government of Argentina—and this just happened within the last several weeks—has announced that they are confiscating all pension fund assets in the country of Argentina. It is a government confiscation of funds.”
By early March, the conversation had moved down the media food chain to the blogging community. A blogger named Sylvia Bokor, who describes herself as an artist and author, began riffing on the RFI:
“From the perspective of the employee, the EBSA Proposal is equally unjust, violating their rights as well. It wants to force Defined Contribution employees to use “a lifetime stream of income-i.e., government issued annuities—thereby forbidding lump sum payouts. In other words, the employee’s money will no longer be his to use as and when he wants it. Government officials will decide when employees can have the money they’ve earned and how they can receive it.
“When government takes over retirement accounts, the money will not be invested in reputable securities earning a return and watched over by expert investment analysts. The money will be siphoned off for other schemes, as is the money one pays into Social Security and Medicare. Employees’ savings will be wiped out. The Proposal is undisguised looting of employer and employee alike.”
On April 3, on a blog called “Krazy Economy,” the blogger “C.W.” elaborated on the government’s supposed scheme, stating as a fact that Uncle Sam planned a massive sell-off of confiscated 401(k) assets. He wrote:
“The following is clear. At some point the government will begin seizing accounts. It may seize only the accounts of retirees and those it deems close to retirement. It is unknown if they’ll seize more. But it will at least seize those and issue annuities for at least those who are retired. This may not be for just the newly retired, but anyone who is retired and has an account large enough to be attractive to seize.
Since the reason for seizing retirement accounts is to use the money for government purposes, it will convert the assets to cash to buy government bonds, probably a newly created special class. The government will sell the securities in the seized retirement accounts.
“This point is absolutely necessary to understand: The government will be selling the seized securities.”
Three days later, the media megaphone was back in Newt Gingrich’s hands, but this time on television. On the April 6 edition of Fox News’ Fox & Friends, this exchange was recorded between Gingrich and co-host Steve Doocy:
Doocy: “There was a BusinessWeek report that said the Treasury and Labor department are asking for public comment on a scheme, it sounds like, to convert 401(k)s and IRAs, into some sort of retirement thing where you give the money to the government, all the money you’ve saved your whole life, and then they will dole it out over a period of time. What’s up with that?”
Gingrich: “I think it’s a very dangerous idea. This is really a secular socialist machine that wants to take over your life. They want to take it over in terms of a proposal that they would, in effect, over time, abolish 401(k)s, migrate Americans to a government-run program so that the politicians would then have your money.”
[An on-screen graphic during the segment stated: “Protecting your savings: Your 401K and IRA confiscated for govt. debt?”]
© 2010 RIJ Publishing. All rights reserved.


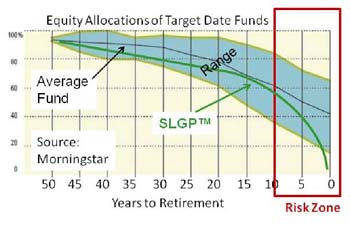
 We need to be especially diligent and protective during the risk zone, but how do we measure and evaluate safety in this critical period? As shown in the graph on the right, TDFs have a wide range of equity exposures in the risk zone; they disagree about the appropriate level of risk. The range of equity allocations widens as retirement approaches.
 Enlightened advisors should focus on the risk zone in their TDF selection. Most TDFs provide similar asset allocations prior to the risk zone, and then diverge widely in their equity exposures as the target date nears. Most TDFs view the target date as a speed bump on the highway of life, ignoring the risk zone altogether. During this critical period TDFs demonstrate their mettle, by protecting or not.