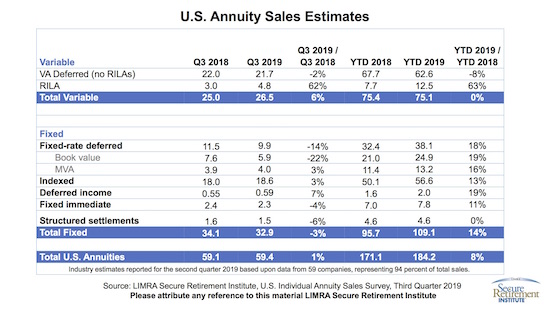
Variable annuity (VA) sales were $26.5 billion in third quarter 2019, six percent higher than third quarter 2018, according to the Secure Retirement Institute (formerly LIMRA SRI) Third Quarter U.S. Annuity Sales Survey. This represents the highest quarterly VA sales results since third quarter 2016.
Year-to-date VA sales were $75.1 billion, level with results from the same period in 2018.
“For the second consecutive quarter, VA sales registered strong growth, driven primarily by the remarkable growth in registered index-linked annuity (RILA) products, which represent nearly 20% of the VA market,” said Todd Giesing, research director, SRI Annuity Research.
“One of the things that is driving the growth in the RILA market is the adoption of Guaranteed Lifetime Benefit (GLB) riders. In the third quarter, RILA sales with GLB riders increased more than $500 million. In the third quarter just under 15% of RILAs were sold with a GLB a sharp increase from just three percent in the prior quarter.”
RILA sales were $4.8 billion in the third quarter, 62% higher than third quarter 2018. In the first nine months of 2019, RILA sales were $12.5 billion, up 63%, compared with prior year sales.
Fee-based VA sales were $785 million in the third quarter—slightly down from the prior year but up almost eight percent from the second quarter. Fee-based VAs represent just three percent of the total VA market.
Total annuity sales increased 1% in the third quarter to $59.4 billion. Year-to-date, total annuity sales were $184.2 billion, an increase of eight percent, compared with the prior year.
Despite an unfavorable interest rate environment, fixed annuities continued to represent the majority of the annuity market with 55% market share in the third quarter, which is down four percentage points from the prior quarter. Fixed annuity sales have outperformed VA sales in 13 of the last 14 calendar quarters.
Interest rates continued to fall in third quarter 2019, negatively affecting fixed annuity product sales. The 10-year Treasury rate fell 35 basis points during the quarter, ending the period at 1.68%. This is down 98 basis points from the beginning of the year.
After two consecutive record-breaking quarters, third-quarter fixed annuity sales were $32.9 billion, down three percent from third quarter 2018. Yet, because of the strong sales in the first half of 2019, total fixed sales were $109.1 billion in the first three quarters, up 14% from the prior year.
Fixed indexed annuity (FIA) sales were $18.6 billion, three percent higher than third quarter 2018. Year-to-date, FIA sales were $56.6 billion, 13% higher than the same period in 2018.
“Following a record-breaking quarter for FIA sales, market conditions dampened demand for FIAs,” noted Giesing. “Given the low-interest-rate environment and the impact it had on cap rates to accumulation-focused products, we expect to see a greater portion of FIA sales to shift to guaranteed income products in the next several quarters.”
Fee-based FIA sales were $159 million in the third quarter, more than double sales in the third quarter of 2018. However, this is a 30% drop in sales from the first quarter 2019 results. Fee-based FIA products still represent less than 1% of the total FIA market.
Fixed-rate deferred annuity sales dropped 14% in the third quarter to $9.9 billion. Again, strong sales in the first half of the year balanced the declines of the third quarter. Year-to-date, fixed-rate deferred annuity sales totaled $38.1 billion, up 18% from last year.
Single-premium immediate annuity (SPIA) sales fell to $2.3 billion in the third quarter, down four percent from the prior year. In the first nine months of 2019, SPIA sales were $7.8 billion, an 11% increase from the prior year.
Deferred income annuity (DIA) sales were $590 million in third quarter 2019, seven percent higher than prior year results. However, this was 19% lower than DIA sales in second quarter 2019. In the first nine months of the year, DIA sales totaled $2 billion, 19% higher than the prior year.
The third quarter 2019 Annuity Industry Estimates can be found in LIMRA’s Fact Tank.
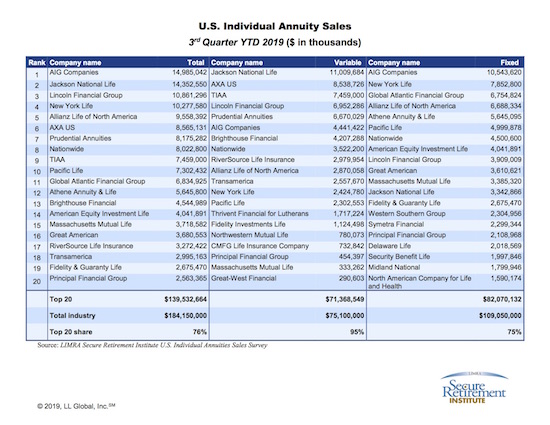
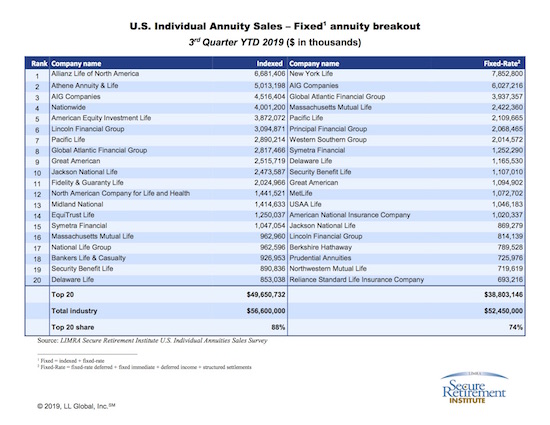
To view the top 20 rankings of total, variable and fixed annuity writers for third quarter 2019, please visit Third Quarter 2019 Annuity Rankings. To view the top 20 rankings of only fixed annuity writers for third quarter 2019, please visit Third Quarter 2019 Fixed Annuity Rankings.
The Secure Retirement Institute’s Third Quarter U.S. Individual Annuities Sales Survey represents data from 94% of the market.
© 2019 RIJ Publishing LLC. All rights reserved.


