Archives: Articles
IssueM Articles
Spain wants to link pension benefits to longevity, not inflation
The Spanish government has proposed reforms to the country’s national pension system that would “decouple” pension payments from inflation and would instead link them to life expectancy and economic conditions. It has sent the proposal to trade unions for comment.
In a speech earlier this week, however, Spain’s employment minister, Fatima Bañez, stressed that there would be no hike in the legal retirement age in Spain – which currently stands at 67 and is among the highest in Europe.
But with the country’s budget deficit now at 10.6% of GDP and growing, she said that the new measure would have to be introduced as early as the beginning of 2014. Her announcement echoed recommendations made by a pension steering committee last July.
The proposed measures include a limit on inflation indexation from 2014 onward. Instead, the government would introduce a minimal increase of 0.25% per annum on pensions, as well as a cap to prevent pension valuation from exceeding this percentage.
The government also plans to strengthen the “pension sustainability factor” in 2019, which would aim to replace the traditional inflation-linked revaluation of pensions.
Instead, the revaluation would be based on the life-expectancy ratio, as well as the balance of revenues and expenses of the social security system in the years prior to a given year.
In its report, the pension steering committee said new criteria should be taken into account in the calculation method used to determine the “sustainability factor,” which was introduced during a previous reform in 2006.
The group also recommended taking into account probable life expectancy at the time of retirement, so that people retiring sooner will receive a lower pension for a longer period.
In parallel to the state pension reform, the government is also looking at ways to strengthen its “second-pillar” personal accounts system.
In July, Angel Martinez-Aldama, director of INVERCO, Spain’s investment and pension fund association, said the government was expected to present a report to Parliament that would describe new measures intended to boost participation in and strengthen the second pillar.
© 2013 RIJ Publishing LLC. All rights reserved.
New York Life releases selected mid-year sales figures
America’s largest mutual life insurer, New York Life, announced strong sales of life insurance, income annuities and mutual funds through the second quarter of 2013.
Sales of individual recurring premium life insurance policies (whole life, universal life and variable universal life) through agents were up 18% over the first half of 2012. In addition, the number of life insurance policies sold through agents continued to rise, up 4% through the second quarter of 2013.
The company also reported growth in various ethnic markets, with 46% of the company’s new life insurance policies produced by agents serving the African-American, Chinese, Hispanic, Korean, South Asian, and Vietnamese markets in the United States.
New York Life remains the leading seller of fixed immediate annuities, with 32% of the market for first quarter 2013, and is the leader in sales of deferred income annuities, with 46% of the market for first quarter 2013, according to industry sources.
The company’s combined sales of these guaranteed income annuity products, including single premium immediate annuities and the company’s deferred income annuity, Guaranteed Future Income Annuity, increased 13% in the first half over the same time period in 2012.
Sales through New York Life Direct increased by 8% over the same period last year. New York Life Direct includes the AARP Operation, which has provided life insurance and lifetime income annuities to AARP members since 2006. AARP has agreed to retain New York Life as the exclusive provider of life insurance products to AARP’s 37 million members through 2022.
Sales of New York Life’s MainStay family of mutual funds increased by 41% to $13.69 billion through the second quarter compared to the first half a year ago. New York Life’s operations in Mexico, Seguros Monterrey New York Life, had a strong first half with 13% sales growth compared to the same period last year.
© 2013 RIJ Publishing LLC. All rights reserved.
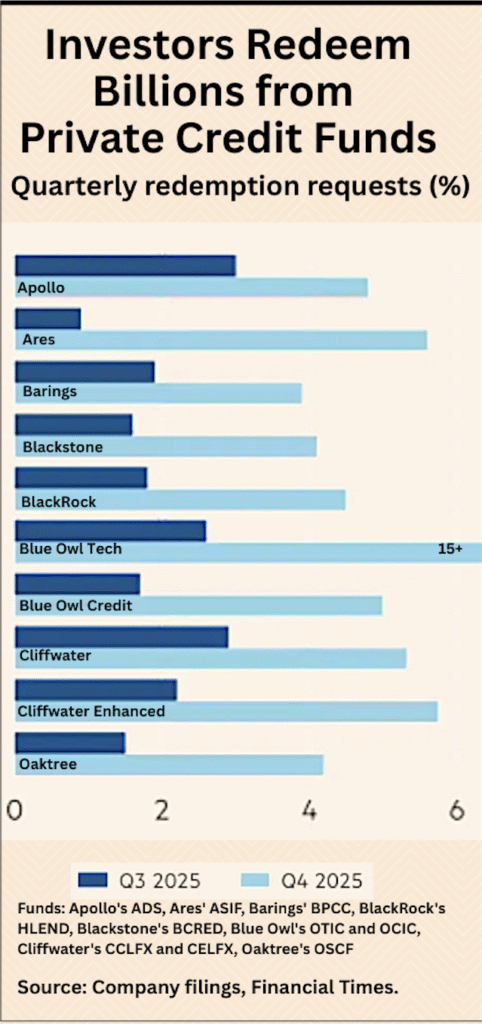
Sales of all fixed annuity products rise in 2Q 2013: Beacon
Rising bond yields helped breathed life into the fixed annuity market in the second quarter of 2013.
For the first time in two years, all fixed annuity product types posted sales gains in second quarter 2013 over the first quarter of the year, while sales of deferred income annuities and indexed annuities posted new records, according to the latest Beacon Research Fixed Annuity Premium Study.
“In addition to the quarter’s rising interest rates, the steepest yield curve in nearly two years enabled carriers to increase the rates they offered on fixed rate and indexed annuities,” said Jeremy Alexander, CEO of Beacon Research, in a release.
“Credited rates on 5-year CD-type fixed annuities rose by an average of 35 basis points. DIA sales were up almost 40% from first quarter due to continued demand for retirement income, larger payouts and new product introductions.”
Total fixed annuity results were $17.1 billion in second quarter, up 14.6% sequentially and 0.2% from a year ago. Sales of indexed annuities increased 17.1% from first quarter to $9.1 billion.
Income annuity results, which include DIAs, grew 16.9% sequentially to $2.6 billion. Sales of market-value-adjusted (MVA) annuities rose 34.9% from the prior quarter to $1.3 billion, largely due to big gains by two products.
![]()
Source: Beacon Research.
New York Life was the top-selling fixed annuity company in second quarter 2013, followed by Security Benefit Life, Allianz, American Equity and Great American Life. New York Life switched positions with Allianz. Security Benefit Life and American Equity remained in second place and fourth place, respectively. Great American entered the top five in fifth place.
Second quarter results for the top five study participants were as follows:
Total Fixed Annuity Sales (in $ thousands)
New York Life 1,470,446
Security Benefit 1,434,104
Allianz Life 1,264,400
American Equity 1,135,553
Great American 837,615
Security Benefit was the new top seller of fixed-rate non-MVA annuities, jumping from sixth place in the previous quarter. Symetra moved from third place to become the new leader in bank channel sales. Pacific Life took the lead among independent broker/dealers, up from second place. The other top companies in sales by product type and distribution channel were unchanged from the prior quarter.
Top products
New York Life and Security Benefit Life each had two of the five top-selling fixed annuity products in second quarter. New York Life’s Lifetime Income Annuity regained the top position from Security Benefit Life’s Total Value Annuity, which moved to second place.
Security Benefit Life’s Secure Income Annuity and American Equity’s Bonus Gold remained in third and fourth places, respectively. New York Life’s Secure Term MVA Fixed Annuity joined the top five in fifth place, up from 12th place last quarter, and was the first MVA annuity in the top five since third quarter 2009.
Rank Company Name Product Name Product Type
1 New York Life NYL Lifetime Income Annuity Income
2 Security Benefit Life Total Value Annuity Indexed
3 Security Benefit Life Secure Income Annuity Indexed
4 American Equity Bonus Gold Indexed
5 New York Life NYL Secure Term MVA Fixed-Rate MVA
“We expect a modest increase in total fixed annuity sales in the coming months should interest rates continue to rise,” Alexander concluded. “DIAs probably will continue the strong growth pattern we’ve seen in the past 18 months.”
The quarterly Study is the first and only source to track and analyze product-level fixed annuity sales on an ongoing basis, and the first to put a decade’s worth of historical industry, company and product sales information in an easily-searchable online database at www.annuitymarketstudy.com.
© 2013 RIJ Publishing LLC. All rights reserved.
At Lincoln Financial, the dawn of a brand new DIA
With the addition this week of Lincoln Deferred Income Solutions to its broad product palette, Lincoln Financial Group became the latest big insurer to offer a deferred income annuity, or DIA. DIAs, which allow Americans to pay today for income that starts sometime in the future, are the newest and fastest-growing segment of the annuity business.
In the first half of 2013, DIA sales increased 151% from the same period in 2012, with estimated sales of $940 million, up from $370 million in 2012. The leader of the category is New York Life, which recently reported that it had a 46% market share in the first quarter of 2013.
So far, mutual insurers with captive agent forces have dominated the DIA space, so it may be significant that Lincoln, a publicly-held company with a big third-party distribution network has jumped on the DIA bandwagon. Lincoln was second only to Jackson National in total annuity sales in the first half of 2013, with combined fixed and variable sales of $8.3 billion.
DIA sales are currently rare in the independent channel. Less than one percent of DIA sales have come through independent sales channels, according to Jeremy Alexander, CEO of Beacon Research, and only 2.5% of all independent channel sales of income annuities are represented by DIAs. “There’s huge potential,” he said.
DIA sales may be helped by rising yields, Alexander added, but he doesn’t think yield is driving the DIA market. Rather, it’s demand coming from retiring baby boomers who want to buy a personal pension.
“Our other fixed deferred annuities are interest rate sensitive, especially in the bank channel. But this isn’t about price sensitivity. It’s really about need. We just keep seeing more sales. With such a new market, it’s hard to tell.”
The Lincoln product can be purchased with a single premium of either qualified or non-qualified money. Income from qualified contracts must be taken by age 70 ½. Aside from those restrictions, the contract is designed for flexibility, according to Brian Wilson, assistant vice president, fixed annuity solutions, at Lincoln, which is headquartered in Radnor, Pa.
During the deferral period, policyholders have a one-time option to move their income start date forward or backward by as much as five years. During the income period, they can take out as much as six months’ income in a lump sum on up to three separate occasions. An inflation-adjustment of up to 4% per year can be added. Payouts can be single or joint, life and/or period certain, with cash refund or installment refund.
The DIA is intended to round out Lincoln’s offering, which includes fixed, indexed, immediate and variable annuities, without cannibalizing other sales. “This is one element in our overall product portfolio,” Wilson told RIJ. “It’s not positioned against other products.”
No two DIA customers are alike, he said. “We heard feedback from one consumer who said, I don’t need a legacy, I’m not looking for return of premium, I just want as much income as possible. Others have said, ‘I’ve got to access to my money.’”
As for Lincoln’s decision to get into the DIA space, that wasn’t hard—at least, not after DIA sales started to take off in 2012. “The market speaks for itself,” Wilson said. “Quarterly sales were $160 million, then $395 million, then $535 million. A lot of it has to do with recent economic events. Americans lack confidence about retirement.”
Lincoln DIA prices will be listed on the Cannex website for advisors who want quotes, he said. Advisors can also access illustrations directly from Lincoln through the company’s advisor web portal. Lincoln provided RIJ with the following sample rates, based on a $100,000 premium:

Source: Lincoln Financial Group, September 5, 2013.
© 2013 RIJ Publishing LLC. All rights reserved.
Introducing: The Journal of Retirement
A New DC Concept from Denmark
In the area of innovative defined contribution (DC) pension products, I believe that Americans can learn a lot from recent developments in Denmark.
Decades ago, Denmark took the DC route in providing for occupational pensions. Last year, the first year in which Denmark’s pension system was rated by the Australian Centre for Financial Studies and Mercer, it ousted the Netherlands from the top position in the rankings. It also became the first system ever to be classified with an ‘A’ grade—an award that was widely publicized.
Less well known is the fact that a new product class, called “(formula-based) smoothed income annuities,” has been invented and launched in Denmark. It is a hybridized approach that overcomes the limitations of variable income annuities (i.e., fluctuations in payments) and of so-called “with-profits” or “participating” policies (i.e., lack of transparency in calculating the bonuses).
Nobody knew this could be done. The unique design of this new product class gives participants greater potential for upside, while also providing participants with partial downside protection over their lifetimes (with the option to add more). [See today’s RIJ cover story, “Have Your Danish and Eat It Too”]
Specifically, the design makes it possible for the fund manager to maintain a higher proportion of equities and other real assets throughout the payout period, thus generating higher expected returns and higher expected pension benefits. It allows greater stability in income payments by using an individual buffer fund for each policy (one that may be negative as well as positive) to absorb market volatility.
These products also offer an innovative enhanced income payment profile with “more money when you need it” based on realistic assumptions of future mortality and longevity avoiding conservative margins. The retirement income level may be gradually adjusted up or down in accordance with continuously updated assumptions of the future mortality rates. The smoothing of the retirement income payments is made possible by the mechanism for smoothing of investment returns and risk sharing.
This design relieves participants of the need to lock in unfavorable interest rates when they convert savings to income. Their income level is set at retirement, and it won’t fluctuate with market conditions. This holistic approach to pension plan design make possible a seamless financial transition from working life to retirement, providing an effective bridge between the accumulation and decumulation phases.
Smoothed income annuities represent an entirely new retirement and wealth accumulation strategy for the private and occupational pension markets in the U.S. It has the potential to set a new standard for retirement income solutions and to become the backbone of one’s retirement income portfolio. It also provides for attractive default investment alternatives and solutions. It is possible to design default investment alternatives and solutions that are tailored to different market segments –also giving providers an opportunity to differentiate themselves from competitors.
The next generation of DC and collective defined contribution (CDC) retirement income products in the United States could be designed as smoothed income annuities. My work and the work of others have demonstrated that these products have particularly attractive return/risk properties in relation to life-cycle products, such as target date funds.
I believe that this new product class can yield exciting—even game changing—opportunities for early adopters who want to seize a competitive advantage and capture a larger share of the growing DC market. It could lead to a revival of the pension fund industry, and help to ease the transition from defined benefit to defined contribution pension products. More importantly, it also represents an opportunity to improve the lives of millions of people throughout the world.
Per Linnemann, a Danish actuary, was one of the designers of smoothed income annuities, which are currently marketed by SEB Pension under the short name Tidspension (TimePension). His bio is available at LinkedIn or on request. He can be reached at [email protected].
Have Your Danish, and Eat It Too

Denmark is Earth’s happiest country, at least according to a 60 Minutes broadcast from a few years ago. And the Danish pension system was not merely ranked first in the world in 2012, it was also the first and only system ever to achieve an A rating on the Melbourne Mercer Global Pension Index.
So when an actuary from that harmonious peninsula in the North Sea—a former chief actuary of that country, no less—claims to know a better way to optimize risk and reward during both accumulation and decumulation, well, attention must be paid.
For the past several weeks, Per Linnemann (right), who has also been an academic and long-time product developer at SEB Pension in Copenhagen, has been helping me understand how that company’s retirement savings mousetrap—called TimePension—resolves the conflicting needs for safety and upside in retirement. This mousetrap, by the way, won Insurance Risk magazine’s Innovation of the Year Award in 2009.
 TimePension’s beauty part, he explained, is that it cures the target-fund glidepath dilemma by allowing investors—either individuals or plan participants—to maintain a 60% equity allocation both before and after they retire. It manages downside risk with a “formula-based smoothing account,” ultimately backed by an insurance company. It delivers retirement income via a period certain smoothed income annuity coupled (optionally) with longevity insurance.
Whether TimePension could work in the U.S. is debatable; in Denmark, even defined contribution money is centrally managed by professionals. Lump-sum cash-outs are the exception rather than the rule. But TimePension is not so fundamentally different from what AllianceBernstein, BlackRock, Prudential or Financial Engines are doing in the U.S. DC market. Asset managers who want to retain retirement plan assets during the transition from employment to retirement might find it especially appealing.
Linnemann, who has spent a lifetime working on pensions in industry, academia and government, is now, at age 60, a consultant. The number one item on his personal pre-retirement “bucket list” is to find an insurance company, asset manager or university in the U.S. that will provide a platform for adapting and developing smoothed income and lump sum products to the U.S. retirement market. [See Linnemann’s guest column in today’s RIJ]
“In 1952, TIAA-CREF created the variable income annuity. This innovation is intended to complete that product by offering greater stability in the pension payments,” he said. “That’s how I think of it.”
How TimePension works
For an explanation of how TimePension works at SEB Pension, Linnemann referred me to Frank Pedersen, a fellow actuary and childhood friend (a not unusual coincidence in Denmark) who is the company’s resident expert on the topic. He provided an example, based on a hypothetical plan participant making a 15%-of-pay contribution to a TimePension account. Here’s how it operates during the accumulation period.
Every month, 15% of each participant’s compensation goes into the pension account, which for convenience Pederson called Account #1, and all of the earnings from that account go into the smoothing or buffer account, which he called Account #2. Every month a small percentage of Account #2 accrues to Account #1. Most of the earnings stay in the buffer account as a reserve against potential losses.
“For example, if you put 100 kroner into Account #1 and the rate of return is 10%, so you have 10 kroner in Account#2, for a total of 110 kroner. This year, you would move one percent of Account#1, or one krone, from Account #2 to Account #1. That leaves 9 kroner in Account#2. Then you would take 20% of Account #2, or 1.8 kroner, and put it in Account #1. You still have 110 kroner in total, but you have 102.8 in your pension account and 7.2 in your smoothing account,” Pederson told RIJ.
“You would do the same thing if the rate of return had been minus 10%. You would move one krone to Account #1 from Account #2, which would now be minus 11. Then you would take 20% of that, or 2.2 kroner, and move that from Account #1 to Account #2. You would have 98.8 kroner in Account #1 and minus 8.8 kroner in Account #2. This is how the interest is divided.
“It becomes very stable over time. Every month, an amount equal to one-twelfth of one percent of Account #1 and one-twelfth of 20% of Account #2 moving to Account #1 from Account #2. This year the guaranteed accrual rate is only one percent, but in a normal year it’s about 3%,” he said.
TimePension has been running at SEB Pension for 10 years, and all but a few of the participants have seen positive returns in their primary accounts every year, including 2008, Pedersen said. In 2008, the overall fund lost 24.9%, but because Account #2 had an existing positive balance, and because Account #1 earned a guaranteed rate of 4.0% that year, and because the loss incurred by the overall fund was so diluted by the smoothing formula, there was no overall loss to the participants’ Account #1, even in the worst year of the financial crisis. “The following year we had a positive return of 17.5%, so all of the problem in Account #2 was gone,” he said.
The decumulation phase
When a TimePension participant retires, he or she decides whether to receive the balance as a smoothed income annuity over a period certain of between 10 and 25 years. The amount of the initial payment, like the initial payment of a variable income annuity in the U.S., is based on the principal accumulated in Account #1, the length of the term and an “assumed interest rate,” currently 3.5%. The monthly payments are smoothed up or down, depending on whether actual returns are higher or lower than 3.5%. The money remains invested in about 60% equities and 40% bonds, and the two accounts and the smoothing formula remain operative.
Here’s where SEB Pension’s insurance unit comes into play. During decumulation, the insurer provides some downside protection and participates in risk sharing in return. According to Pedersen, if he receives an amount equal to x% of his pension account (Account #1) in a given year, then SEB Pension will receive an amount equal to x% of his buffer account (Account #2) in that year, so long as the buffer account is positive. If Account #2 drops into negative territory, however, the insurance company must make a contribution of x% of Account #2. “We share the risk when it goes up and when it goes down,” he said.
There’s also a ratchet function available in TimePension that protects the participant and that may require a hedging program by the insurer. But the hedging is “plain vanilla,” Linnemann told Insurance Risk magazine in 2009, because the smoothing account itself absorbs most of the volatility.
What’s the point of all this backing and filling? According to one of Linnemann’s academic papers on the subject, the TimePension system produces higher returns on average than either of the other two retirement plan designs in Denmark, “unit-link” (like our 401(k) plans) and “traditional with-profits” (similar to TIAA-CREF’s retirement annuity fund). TimePension entails less volatility and less sequence of returns risk at retirement than unit-link plans, and its accrual method is more transparent than that of with-profits plans, while offering higher returns.
SEB Pension tried to patent TimePension back in 2002, but “because it was ‘formula-based’ we were told it wasn’t patentable,” Pedersen said. Given the novelty of TimePension, prospective enrollees and clients sometimes have difficulty grasping it. “Our biggest problem is to explain how it functions,” he conceded. “But if we have the opportunity to tell people how it functions, they’re receptive. Everyone knows that unit-linked is too risky. And they don’t like the traditional plan. Only a few people know about this new alternative.”
Business is growing, however. In the first six months of 2013, TimePension account for about 25% of SEB Pension’s sales. (SEB Pension has about 10% of Denmark’s pension market.) It is available as an individual as well as a group product. TimePension has caught the eye of the Britain’s Department for Work and Pensions, which has become interested in finding a DC/DB hybrid that involves greater risk-sharing between plan sponsors and plan providers. In Britain, this hypothetical hybrid has been dubbed “Defined Ambition.”
Taking it on the road
Could TimePension work in the U.S., as a retail product or as an institutional product? Given the differences between the U.S. and Danish tax systems and labor laws, the answer would appear to be no. For better or worse, Americans demand a lot more liquidity and flexibility with their retirement savings than Danes do. Danes can cash out of their TimePension plans, but they apparently have to absorb a prohibitive market value-adjustment and tax payment if they do.
None of the U.S. pension experts I spoke to were familiar with TimePension. The reactions of some retirement experts, after they were sent copies of one of Linnemann’s research papers, ranged from recognition to skepticism about the illiquidity of TimePension, to dismissal of any program that purports to cheat the laws of risk and reward.
Jeff Dellinger, a consultant who helped create Lincoln Financial’s i4Life variable income annuity and the author of The Handbook of Variable Income Annuities (Wiley, 2006), saw something familiar in TimePension. “It made me think of an arrangement I talked about in my VIA book for coping with volatility,” he said in an email.
“[The book explains that] there will be some natural ups and downs in monthly income from market movement. A region is defined where if the naturally calculated VIA payment would fall in that region, then nothing else happens. If the naturally calculated VIA payment would fall below or above that region, then only the floor or ceiling payment is made and the shortfall or excess adjusts the underlying reserve. This allows for volatility control in a less expensive way than simply having the insurance company trade the appropriate derivatives and pass their cost along to annuitants in the way of lower income.”
Mark Warshawsky, author of Retirement Income: Risks and Strategies (MIT, 2011) told RIJ, “It would appear that the [product] is not entirely liquid, and while in the Europe that may not be a big deal, in the US it probably is, in a negative way. For example, TIAA-CREF offers a smoothed interest rate and dividends on its TIAA accumulation and annuity products, with perhaps a higher expected return, but the lack of liquidity is always subject to complaint.”
The program director at the Center for Retirement Research at Boston College, Steve Sass, said, “The objective is important: to reduce the risk in 401(k)-type plans without resorting to expensive guarantees. And it does so by sharing risk, not by guaranteeing returns or pensions. While risk capacity is clearly different at different stages of life, and is lowest in retirement, and this could be a complicating factor, I’m willing to accept the simplification until it could be analyzed more carefully.”
Moshe Milevsky, the annuity expert at York University, was skeptical. “Repeat after me: No arbitrage, no free lunches, and risk can’t go away by ‘smoothing,’” he commented in an email.
But Linnemann points out that the centrally managed funds in a TimePension plan aren’t very different from the life-cycle or target-date funds that have become nearly ubiquitous in the U.S. defined contribution landscape.
Target-date funds have also been paired with guaranteed income solutions in DC plans by AllianceBernstein (Lifetime Income Strategy), which was adopted in 2012 by United Technologies, by Prudential Retirement (IncomeFlex), which adds a living benefit rider to TDFs and by Financial Engines, whose Income+ program manages both the accumulation and payout stages for participants, and offers an option for longevity insurance.
If these programs become more widely adopted—they’ve been stalled by fiduciary and liability concerns on the part of DC plan sponsors—it’s not impossible to see TimePension, with its unusual buffer account, added to the mix.
“In the U.S., defined contribution has moved into lifecycle products. But that is not enough. You need a product design like TimePension to get the best of both worlds. It’s not a money machine. You could still end up in a Japanese scenario with no returns for decades. But it would make the transition easier and you would gradually end up with a new level of return.”
Linnemann hopes to cap a 35-year actuarial career by spreading awareness of the TimePension concept, if not the exact product, around the world. “It’s been used by corporations and households in Denmark since 2002, and it’s not known internationally. Why should we wait a decade or more for it to spread by itself? Before I retire I would like to finish off my working period by developing this product class further.”
Linnemann would like to consult for an adventurous plan sponsor, like a Microsoft or Apple, who could eventually adopt a program like TimePension, or find an insurance company, asset manager or university who could provide a platform for further work.
“You could design different versions of this design for different companies, and a large company could have a say in what type of investment products are used. I’m hoping that many millions of people could have the benefit of more stable retirement income. As far as I have been able to see, there’s nothing that is as good as this.”
© 2013 RIJ Publishing LLC. All rights reserved.
The Bucket
Chad Parks joins Beacon Research as sales director
Beacon Research, an independent source of annuity information, announced today that Chad Parks has joined the company as Director of Sales. He will report to President and CEO Jeremy Alexander.
Parks previously served as regional vice president at Allianz USA, AXA Equitable and Sun Life. He also headed Davis & Parks Technologies, a software technology company serving the investment community.
He holds a bachelor’s degree from the University of North Carolina at Chapel Hill.
Athene Annuity’s SPIA to use enhanced Infosys McCamish platform
Athene Annuity’s MaxRetire SPIA (single premium immediate annuity) will be the first product to use the Repetitive Payment Management (RPM) functionality on the Infosys McCamish Systems VPAS platform, the companies announced.
The VPAS platform provides end-to-end servicing and administration for life insurance and annuity contracts, according to a release. The VPAS “RPM web-enabled payout component” enhances the VPAS platform for servicing payout annuities and settlements for life insurance claims. The carrier and policy owner can view accumulations and payouts on one platform.
Athene’s distribution began selling the MaxRetire SPIA product on May 30, 2013. McCamish Systems has provided end-to-end platform-based BPO services to Athene’s fixed and fixed indexed annuities since 2006.
According to the release:
- The new service allows products to be configured and deployed without the need for development, leading to improved speed to market for carriers. It allows them to provide innovative new payout products and riders quickly to the growing annuity market based on the ease of the product configuration.
- Tax regulations and product features for the qualified and non-qualified annuity markets are built into the platform. The VPAS RPM solution supports qualified and non-qualified contracts with single and joint life options, with guarantee periods, if desired, as well as period certain options.
- RPM offers robust fee deductions, optional payee elections, automated exclusion ratio calculations and easily supports multiple calculation methods.
- The component lowers the risks and costs to carriers by providing one platform for accumulation and repetitive payout/ disbursement processing, since a single platform eliminates the need to issue a new policy on a separate platform when the contract annuitizes.
- It enables seamless and automated processing using online product calculation engine for payout processing.
ADP TotalSource Retirement Savings Program hires ING U.S.
ING U.S. announced today that its Retirement Solutions business became the service provider for the ADP TotalSource Retirement Savings Program, effective August 7, 2013. The program, serviced by ING U.S.’s large corporate markets recordkeeping division, comprises approximately 2,800 plan sponsors as part of multiple-employer arrangement that represents over 57,000 participants and nearly $2 billion in assets.
ING U.S. will provide participants access to financial planning tools, as well as custom communication and financial education programs. Participants will also have access to ING U.S.’s investment lineup, investment advice and retirement planning advice.
ING U.S. serves as a plan provider for 48,000 institutions and more than five million participants, according to Pensions & Investments ranking of Top DC Recordkeepers, April 2013.
FIA policyholder behavior study published by Ruark Consulting
Ruark Consulting LLC, a Connecticut-based actuarial consulting firm, has released the results of its 2012 Fixed Indexed Annuity Partial Withdrawal Study, which details the impact of various product features on policy persistency.
Eleven companies, including most of the major FIA writers, submitted data for the partial withdrawal study. The study the period January 2006 through September 2012 and included over 8 million contract years of exposure covering partial withdrawal experience under all FIA contracts, regardless of the presence of a living benefit.
Ruark examined various factors—age, duration and contract size—to determine those that have a material impact on partial withdrawal behavior for fixed indexed annuity contracts.
On contracts with a living benefit rider, Ruark looked at the effect of the “money-ness” of the guarantee and went into more depth on lifetime withdrawal behavior by examining results for the commencement of withdrawals under the benefit and, once withdrawals start, whether they continue.
Key findings of the study included:
- The presence of a free withdrawal amount has a significant effect of withdrawal behavior on all contracts – even those with a lifetime withdrawal feature.
- Withdrawals by younger owners are more of a lower frequency, high severity event, with a material portion of their annual withdrawal amounts in excess of the free amount.
- Tax status is an important factor due to the telling effect of required minimum distributions on qualified contracts at older ages.
- Contracts with a GLWB rider take withdrawals less frequently than those without the rider and less by amount prior to starting lifetime income. However, withdrawals are still at levels that are detrimental to the guarantee. Ruark Consulting and our FIA clients were surprised at the limits of the rider’s effect on overall withdrawal behavior.
- GLWB contract owners have been very reluctant to turn on the rider’s lifetime income feature, having done so at single digits rates so far. These rates are even lower than Ruark Consulting has observed in its variable annuity studies on similar withdrawal benefits.
- Those that start lifetime income also do not “perfectly” exercise their option, as annual amounts withdrawn include significant portions both less than and greater than the contractual maximum amounts.
- The few GLWB contracts that commence lifetime income do, though, tend to leave it on: continuation rates are in excess of 90%.
Despite the above findings, company risk managers should not take false comfort in results thus far, as the GLWB rider is early in its history. Ruark Consulting plans to continue to track this and other key assumptions in the FIA market in order to provide its clients with important and necessary information for pricing, risk management, and, ultimately, valuation.
© 2013 RIJ Publishing LLC. All rights reserved.
Vanguard suggests SWiP option for DoL income illustration
Vanguard, one of the country’s largest 401(k) providers, has taken a maverick position in its official comments to the Department of Labor about the DoL’s proposal to require plan sponsors to present illustrations on participant account statements showing how their account balances might translate into lifetime income streams in retirement.
Signed by Steve Utkus, principal and head of Vanguard Center for Retirement Research, Vanguard’s letter said that defined contribution (DC) plan participants are best served by allowing a choice of “income modeling tools and approaches that reflect each plan’s specific population and provisions.” Vanguard’s choice would be to use the systematic withdrawal method as an illustration, rather than annuities.
Vanguard, whose philosophy has traditionally been that diversification is adequate protection against market risk for long-term investors, doesn’t support the assumption that participants will annuitize their accounts at retirement, even for the purposes of illustration, because participants so rarely annuitize.
Vanguard, a specialist in the direct marketing of low-cost index funds, sells no-load deferred and variable annuities, but its contracts are manufactured for it by outside life insurance companies.
According to a Vanguard release, the company “notes concern about the proposed requirement to project retirement income based on an assumption that participants will annuitize their entire account balances at retirement.” Its letter to the DoL said that this ‘does not comport with plan provisions or participant behavior,’ and cited the facts that relatively few DC plans offer annuities and most participants prefer lump-sum distributions even in plans that offer annuitized payments.
“If the DOL requires lifetime income illustrations to be provided on participant statements, sponsors and service providers should have the flexibility to project retirement income using a systematic withdrawal approach,” Vanguard’s letter said.
© 2013 RIJ Publishing LLC. All rights reserved.
IRI publishes brief guide to deferred income annuities
Any advisor or layperson who has general questions about deferred income annuities (DIAs) can find most of the answers in a new Insured Retirement Institute whitepaper entitled “Deferred Income Annuities: Insuring Against Longevity Risk.”
The whitepaper describes in sufficient but not excessive detail how DIAs work and how they compare with other types of annuities, such as single premium immediate annuities, variable annuities with income riders and fixed indexed annuities with income riders.
The IRI also explains why people would purchase a DIA (to protect against running out of money, to provide income for medical expenses later in life) and how they can use DIAs (by creating sequential or overlapping layers of DIA income in retirement) to maintain inflation-protected income throughout retirement.
An insurance agent or financial advisor might hand out this brochure to prospective clients. It doesn’t refer to specific products by name. Some of the information about DIAs came as a surprise, such as the assertion that DIAs (unlike SPIAs) typically can’t be liquidated for a commuted value after purchase.
Aside from providing information about DIAs, the brochure also includes information that professionals may find familiar, about longevity risk, the risk of disability in old age, market risk, and other risks that a source of guaranteed lifetime income can mitigate.
© 2013 RIJ Publishing LLC. All rights reserved.
French government tweaks its public pension—and European bureaucrats
Only seven years away from a potential €20.7b ($27.6 billion) shortfall in the financing of its pay-as-you-go social security program, the French government announced that it would lengthen the contribution period (to 43 years from 41.5 years by 2035) and incrementally raise contributions for both employers and employees a total of 0.3 percentage points by 2017.
But Francois Hollande’s government conspicuously ignored some of the recommendations that the European Commission had made to it regarding pension reform—such as the recommendation to increase the statutory retirement age, increase the full-pension contribution period, and not require higher contributions from employers.
Both employers and employees would see their social contributions increase over the next four years – by 0.15 percentage points in 2014 and 0.05 percentage points in 2015, 2016 and 2017 – to reach an overall increase of 0.3 percentage points by 2017.
The government will also ask companies to finance special accounts for “hardship conditions at work.” These special accounts, to be introduced in 2015, will help employees performing heavy physical labor to learn new skills, switch to part-time work or retire earlier than the legal retirement age.
Another measure recommended by both the Commission and a French pensions advisory panel in June – which sought to limit indexation – was watered down.
Instead of revising the indexation rules, which could have led retirees to see their pensions fall by one percentage point compared with inflation, Hollande’s government moved the date of adjustment of pensions from April to October. The move could help France save as much as €600m ($800 million) by 2014, according to the government.
© 2013 RIJ Publishing LLC. All rights reserved.
The Global QE Exit Crisis
The global economy could be in the early stages of another crisis. Once again, the US Federal Reserve is in the eye of the storm.
As the Fed attempts to exit from so-called quantitative easing (QE) – its unprecedented policy of massive purchases of long-term assets – many high-flying emerging economies suddenly find themselves in a vise. Currency and stock markets in India and Indonesia are plunging, with collateral damage evident in Brazil, South Africa, and Turkey.
The Fed insists that it is blameless – the same absurd position that it took in the aftermath of the Great Crisis of 2008-2009, when it maintained that its excessive monetary accommodation had nothing to do with the property and credit bubbles that nearly pushed the world into the abyss. It remains steeped in denial: Were it not for the interest-rate suppression that QE has imposed on developed countries since 2009, the search for yield would not have flooded emerging economies with short-term “hot” money.
As in the mid-2000’s, there is plenty of blame to go around this time as well. The Fed is hardly alone in embracing unconventional monetary easing. Moreover, the aforementioned developing economies all have one thing in common: large current-account deficits.
According to the International Monetary Fund, India’s external deficit, for example, is likely to average 5% of GDP in 2012-2013, compared to 2.8% in 2008-2011. Similarly, Indonesia’s current-account deficit, at 3% of GDP in 2012-2013, represents an even sharper deterioration from surpluses that averaged 0.7% of GDP in 2008-2011. Comparable patterns are evident in Brazil, South Africa, and Turkey.
A large current-account deficit is a classic symptom of a pre-crisis economy living beyond its means – in effect, investing more than it is saving. The only way to sustain economic growth in the face of such an imbalance is to borrow surplus savings from abroad.
That is where QE came into play. It provided a surplus of yield-seeking capital from investors in developed countries, thereby allowing emerging economies to remain on high-growth trajectories. IMF research puts emerging markets’ cumulative capital inflows at close to $4 trillion since the onset of QE in 2009. Enticed by the siren song of a shortcut to rapid economic growth, these inflows lulled emerging-market countries into believing that their imbalances were sustainable, enabling them to avoid the discipline needed to put their economies on more stable and viable paths.
This is an endemic feature of the modern global economy. Rather than owning up to the economic slowdown that current-account deficits signal – accepting a little less growth today for more sustainable growth in the future – politicians and policymakers opt for risky growth gambits that ultimately backfire.
That has been the case in developing Asia, not just in India and Indonesia today, but also in the 1990’s, when sharply widening current-account deficits were a harbinger of the wrenching financial crisis of 1997-1998. But it has been equally true of the developed world.
America’s gaping current-account deficit of the mid-2000’s was, in fact, a glaring warning of the distortions created by a shift to asset-dependent saving at a time when dangerous bubbles were forming in asset and credit markets. Europe’s sovereign-debt crisis is an outgrowth of sharp disparities between the peripheral economies with outsize current-account deficits – especially Greece, Portugal, and Spain – and core countries like Germany, with large surpluses.
Central bankers have done everything in their power to finesse these problems. Under the leadership of Ben Bernanke and his predecessor, Alan Greenspan, the Fed condoned asset and credit bubbles, treating them as new sources of economic growth. Bernanke has gone even further, arguing that the growth windfall from QE would be more than sufficient to compensate for any destabilizing hot-money flows in and out of emerging economies. Yet the absence of any such growth windfall in a still-sluggish US economy has unmasked QE as little more than a yield-seeking liquidity foil.
The QE exit strategy, if the Fed ever summons the courage to pull it off, would do little more than redirect surplus liquidity from higher-yielding developing markets back to home markets. At present, with the Fed hinting at the first phase of the exit – the so-called QE taper – financial markets are already responding to expectations of reduced money creation and eventual increases in interest rates in the developed world.
Never mind the Fed’s promises that any such moves will be glacial – that it is unlikely to trigger any meaningful increases in policy rates until 2014 or 2015. As the more than 1.1 percentage-point increase in 10-year Treasury yields over the past year indicates, markets have an uncanny knack for discounting glacial events in a short period of time.
Courtesy of that discounting mechanism, the risk-adjusted yield arbitrage has now started to move against emerging-market securities. Not surprisingly, those economies with current-account deficits are feeling the heat first. Suddenly, their saving-investment imbalances are harder to fund in a post-QE regime, an outcome that has taken a wrenching toll on currencies in India, Indonesia, Brazil, and Turkey.
As a result, these countries have been left ensnared in policy traps: Orthodox defense strategies for plunging currencies usually entail higher interest rates – an unpalatable option for emerging economies that are also experiencing downward pressure on economic growth.
Where this stops, nobody knows. That was the case in Asia in the late 1990’s, as well as in the US in 2009. But, with more than a dozen major crises hitting the world economy since the early 1980’s, there is no mistaking the message: imbalances are not sustainable, regardless of how hard central banks try to duck the consequences.
Developing economies are now feeling the full force of the Fed’s moment of reckoning. They are guilty of failing to face up to their own rebalancing during the heady days of the QE sugar high. And the Fed is just as guilty, if not more so, for orchestrating this failed policy experiment in the first place.
Stephen S. Roach, former Chairman of Morgan Stanley Asia and the firm’s chief economist, is a senior fellow at Yale University’s Jackson Institute of Global Affairs and a senior lecturer at Yale’s School of Management. His most recent book is The Next Asia.
© 2013 Project Syndicate.
Summer Is Almost Over. So Is QE
As the summer of 2013 coasts toward its unofficial end, the thoughts of many financial observers are focused on the beginning of the end of the Fed’s “quantitative easing” program, and the potential impact on the markets.
In anticipation of rising yields and falling prices as the Fed buys fewer bonds in 2014, investors have been herding money from bonds to stocks. Pundits call the re-allocation process part of a “great rotation” (an expression not heard much until recently).
* * *
Will we miss QE, and the floor that it helped establish under the prices of risky assets during the last few years? Ken Volpert, the head of Vanguard’s taxable bond group, clearly will not. He recently wrote a blog post entitled, “Goodbye (and good riddance!) to financial repression.”
Rather than dread falling bond prices, Volpert welcomes an end to the period of negative real yield that the Fed’s bond-buying activity has visited on the overall bond market, as measured by the Barclays Aggregate Bond Index. He hopes for a return to an era when investing in a bond index fund offers an inflation-beating return.
He doesn’t expect bond yields to return to their 10-year averages ($1.9% for Treasuries and 3% for corporate bonds) very soon, however, thanks to a combination of above-normal unemployment, conservative spending by government and consumers, and the effect of “reverse QE” as the Fed gradually sells assets and absorbs some of the excess cash it put into the banking system.
“My expectation is that the continued slow growth will lead to a gradual increase of this real yield back to about 1% for the Aggregate Index over the next two years—a move that is likely to keep total returns in very modest positive territory for the total U.S. bond market over this period,” Volpert wrote.
* * *
While a firm like Vanguard, which manages huge bond index funds, wants to calm its shareholders about rising yields and prevent flight from existing bond funds, more opportunistic firms have capitalized on investor anxiety by creating new types of actively managed bond funds.
In the lead story in the August U.S. Monthly Product Trends edition of the Cerulli Edge, for instance, Cerulli Associates notes that QE has had a significant impact on product development in bond mutual funds.
At the beginning of the financial crisis, when yields were higher, money flowed heavily into intermediate bond funds, Cerulli said, with a peak of $119 billion in 2009. By the second quarter of 2013, however, flows into those funds had turned negative.
Some of that money went into stocks, but a chunk has gone into “non-traditional,” actively managed retail bond funds that follow “benchmark agnostic” strategies. Going forward, the two most likely categories for new product development in bonds are “unconstrained” and multistrategy funds—basically, actively managed bond or income funds—and bank-loan funds, according to a Cerulli survey.
Bank-loan funds buy the speculative-grade and/or variable-rate loans that are used in leveraged buyouts. They offer higher yields than conventional bonds and reportedly have little or no exposure to duration risk. But they come with more risk than the typical bond investor might have an appetite for.
* * *
Phil Chiricotti, the president of the Center for Due Diligence (CFDD), a Chicago-based organization for retirement plan advisors, has also been pondering the potential effects of the end of quantitative easing.
“The unwinding of QE is a place we have never been before and while the modest recovery has continued, it is still fragile. In other words, the ability to absorb higher interest rates remains an unknown,” he writes in his August 28 report.
In particular, he’s interested in the risk exposures of the target date funds (TDFs) that are the default investments in so many 401(k) plans. His report reminds us that different TDFs will respond to changing conditions in very different ways. He’s been tracking the performance of the major TDFs and found big discrepancies in their returns over the past year.
Even among TDFs with the same maturity, returns have varied widely. Within the 2015 “class” of TDFs, performance differed by as much as nine percentage points, depending on their exposure to the booming stock market. Performance has also varied by maturity, with bond-heavy 2015 TDFs underperforming 2045 TDFs by eight percentage points in the year ending June 30, 2013.
“The easy money has been made and TDF holdings beyond cash, stable value and short term fixed income have elevated risk on both the equity and fixed income side,” Chiricotti wrote. He welcomes a return to a period when the invisible hand of the market—as opposed to the hand of Ben Bernanke—sets asset prices.
“Assuming no new shocks—something investors can never be sure of—and no more than a moderate increase in rates, economic fundamentals should eventually replace monetary policy as the key driver of asset class valuations,” the CFDD president wrote.
* * *
I hear relatively little about the vulnerability of equity prices to the end of QE. Many people acknowledge that low interest rates have helped drive the stock market indexes to new (nominal) highs. But there doesn’t seem to be a whole lot of concern that higher yields might trigger a reversal in stock prices. The assumption may be that if the U.S. economy is healthy enough to tolerate higher rates, it will be healthy enough to sustain the bull market.
© 2013 RIJ Publishing LLC. All rights reserved.
RetiremEntrepreneur: Mike Alfred


What I do: BrightScope is a financial information company, similar to Morningstar, Thomson Reuters, and Bloomberg. We want to bring transparency to markets that historically haven’t had it. Before Morningstar, there wasn’t a lot of information in the public domain about the quality of mutual funds. We’re doing the same thing in the retirement plans space and in the area of financial advice and wealth management. We maintain a database of information on the retirement plan market and add value by quantitatively rating 401(k) and 403(b) plans across critical metrics. The BrightScope Rating reviews more than 200 unique data-inputs per plan and calculates a single numerical score on a 0-100 scale.
Who my clients are: We work with six of the top 10 global asset managers, eight of the top 10 defined contribution recordkeepers, as well as broker-dealers, custodians, and financial advisors. The last major segment of our client base is large plan sponsors, including McDonald’s, Google, Thomson Reuters, and several hundred others.
Why people hire me: We talk to a lot of senior executives in the financial services industry. The one thing we consistently hear is that we have a sterling reputation as a firm that always delivers on the promises we make to clients. I think when people hear the name BrightScope they have a positive impression, even if they don’t entirely understand what we do.
How I get paid: It’s a subscription business model; people pay to access our data and software. At the high end, the Beacon platform costs $325,000 a year off-the-shelf, but some firms pay more for the integration of proprietary data and other custom software. Many top asset managers, custodians, and broker-dealers use our Beacon platform to transmit data among themselves in a data clearinghouse or data exchange format. The platform standardizes the transfer protocols, data formatting, and reporting. Some companies employ a team of in-house IT people whose biggest challenge is taking in reporting from multiple platforms. Our Beacon platform streamlines it for them.
Where I came from: I grew up in San Diego, went to Stanford for my undergraduate degree and majored in history. During that time, I traded highly volatile small cap stocks and much of my early experience came directly from my E*Trade account. When I graduated, I wanted to work in the financial advisory business, but I became disillusioned with Wall Street. The goal in that environment was to sell product. My brother Ryan and I decided to build up an independent firm, and in that process we came up with this idea. Morningstar standardized a fund rating, but no one had come up with a way to standardize and rate a 401(k) plan. That was the big breakthrough for us because no one was doing it and it turned out to be a very big and important market.
My personal retirement philosophy: I don’t think you should ever try to retire. I save the maximum in my personal 401(k) plan every year, but I spend a lot of time running and staying healthy. If you can work until the day you die, that’s optimal. My personal philosophy is that you should save like you will retire, but live like you won’t.
© 2013 RIJ Publishing LLC. All rights reserved.
Financial service firms neglect ‘accumulators’: Hearts & Wallets
At their peril, traditional financial services firms continue to neglect the 77 million U.S. households that are still in the accumulation stage, a group that has $15.4 trillion and includes the 29 million mid-career households ages 40 to 53 with $7.2 trillion, according to Hearts & Wallets, LLC, the retirement and investment trends research firm.
“New entrants will force incumbents to respond in the coming months to the under-served ‘Accumulator’ market. LearnVest, NestWise and other new competitors [will] enable younger investors to break free from asset-based pricing, which hampers access to desired services,” said Chris J. Brown, Hearts & Wallets LLC principal.
His firm defines Accumulators as those younger than age 64 and not within five years of retirement. Retirees, a separate group, account for 34 million households with $13.8 trillion invested.
The findings come from the Hearts & Wallets annual competitive study, Inside Retirement Advice 2013: Accumulator Focus. Acquiring and Growing Relationships in the Workplace, Online and with Advice & Guidance. It highlights findings from the firm’s annual confidential management survey, Inside Advice Competitive Landscape Survey Q2 2013.
The survey of nearly two dozen leading distributors, employer-sponsored plans, insurers, asset managers and intermediary platform solution providers reveals future strategic priorities for retirement, segment focus, offering scope, social media and technology and sizes the Accumulator market. Participating firms had more than $12 trillion in AUA and more than $10 trillion in AUM, serve more than 50 million retail customers and support more than 60,000 registered reps.
Large firms are uncertain whether to focus on retirement income (55%) or young investors, the survey showed. Encouragingly, 55% of firms think considering the lifetime value of a customer could be useful, up from 43% in 2010.
Participating firms are under pressure to maintain older investor focus. Only 16% of resources (budgets, headcount and management) are devoted to young investors, and only eight percent of firms offer a dedicated young investor focus similar to retirement income. Signs of change are emerging, however, as firms emphasize tools and social media resources that appeal to younger investors and shift strategies.
Social media’s role
Firms primarily use social media for branding and to grow and acquire customers. Only one-quarter cite social media as a service delivery advantage. Online ads, email, Twitter and similar messaging capabilities and communities outrank formerly popular communication vehicles except for seminars and TV ads. Ninety percent agree younger investors demand more immediate and varied ways to communicate, access and validate, and the industry will have to adapt.
“Few Accumulators are explicitly planning for, or intensely interested in, retirement, so speak the language of younger investors,” Brown said. “Three-quarters of firms agree they need to do something different for younger investors. The growing wallets of these future mainstream customers will go to firms that adapt or new entrants.”
© 2013 RIJ Publishing LLC. All rights reserved.
We’re Still Accepting Nominees
We’re extending the deadline to this Wednesday for nominations for the Innovation in Retirement Income Products award. The winner of the award, which Retirement Income Journal is sponsoring on behalf of the Retirement Income Industry Association, will be announced at RIIA’s annual meeting in Austin, Texas, on October 7.
As a member of the broadly-defined retirement income industry, you probably know of a product, introduced in the last 12 to 18 months, that has distinguished itself from the others—either in its actuarial wizardry, or its value proposition, or perhaps even its sheer simplicity.
We’re looking, ideally, for products that help people turn savings into income or that mitigate an important retirement risk. Potential nominees can be insurance products, investment products or hybrid products. But they shouldn’t be information technology or software products.
Wednesday, September 11, is the new deadline for submitting specific products as nominations. E-mail your suggestions to [email protected]. To add weight to your nomination, tell us why you believe the product deserves to win this prestigious award.
In addition to the winner of the award, there will be two runner-ups. So the product you nominate has three chances to win.
Equities should continue to rise in third quarter: Prudential
Global stock markets should remain in a modest uptrend with the Federal Reserve unlikely to begin slowing its bond purchases before the fourth quarter of 2013 or early 2014, and with continued support from other developed central banks, according to the September Global Investment Outlook from Prudential global chief investment strategist John Praveen.
A surprising level of upside growth occurred in both the U.S. and the Eurozone during Q2 and growth remains solid in Japan. Improvement in the corporate earnings outlook and supportive valuations were positive indicators for stocks, the report said.
Global stocks
Equity markets rallied in July for several reasons:
- Reassurance from the Federal Reserve that it would continue buying bonds;
- Optimism about Japan Prime Minister Shinzo Abe’s “third arrow”—proposed financial deregulation—with the solidification of an effective majority following the LDP upper house election victory;
- Continued Eurozone stabilization;
- Chinese policy makers reaffirming their objective of over 7% growth.
Looking ahead, global equity markets are likely to post further modest gains with:
Developed central banks remaining committed to keeping interest rates low for an extended period and continuing to provide liquidity;
- The Fed unlikely to begin QE taper until late Q4 or early Q1 with inflation below the Fed’s 2% target;
- Improving global growth with upside growth surprises in the U.S. & Eurozone;
- Earnings outlook remains solid with improving GDP growth in the U.S. and Europe and continued solid growth in Japan;
- Valuations remain supportive;
- Improving risk appetite with easing of Eurozone risks.
However, in the near-term, market volatility is likely to remain high with:
- Escalating tensions in Egypt threatening to destabilize the Middle East region and cause a spike in oil prices;
- Renewed chatter that strong U.S. macro data could prompt the Fed to start QE taper as early as September;
- Continued growth disappointment in China and other emerging economies and policy tightening to defend weak currencies and tackle inflation.
Fixed income
Bond yields are likely to remain under upward pressure from:
- Improving GDP growth;
- Strong U.S. GDP and ISM readings prompting the Fed to start QE taper as early as September; and
- Bond valuations remain expensive relative to stocks.
However, bonds remain supported by:
- Ongoing bond purchases by other developed central banks and their commitment to keeping interest rates low for an extended period;
- Low inflation in the developed economies;
- Renewed increase in safe haven demand as escalating tensions in Egypt threaten to destabilize the Middle East region; and
- Sluggish emerging market GDP growth.
© 2013 RIJ Publishing LLC. All rights reserved.
Quote of the Week
When Inflation Doves Cry
The Wall Street Journal recently ran a front-page article reporting that the monetary-policy “doves,” who had forecast low inflation in the United States, have gotten the better of the “hawks,” who argued that the Fed’s monthly purchases of long-term securities, or so-called quantitative easing (QE), would unleash faster price growth.
The report was correct but misleading, for it failed to mention why there is so little inflation in the US today. Were the doves right, or just lucky?
The US Federal Reserve Board has pumped out trillions of dollars of reserves, but never have so many reserves produced so little monetary growth. Neither the hawks nor the doves (nor anyone else) expected that.
Monetarists insist that economies experience inflation when money-supply growth persistently exceeds output growth. That has not happened yet, so inflation has been postponed.
Instead of rejecting monetary theory and history, the army of Wall Street soothsayers should look beyond the Fed’s press releases and ask themselves: Does it make sense to throw out centuries of experience? Are we really so confident that the Fed has found a new way?
The Fed has printed new bank reserves with reckless abandon. But almost all of the reserves sit idle on commercial banks’ balance sheets. For the 12 months ending in July, the St. Louis Fed reports that bank reserves rose 31%. During the same period, a commonly used measure of monetary growth, M2, increased by only 6.8%. No sound monetarist thinks those numbers predict current inflation.
Indeed, almost all the reserves added in the second and third rounds of QE, more than 95%, are sitting in excess reserves, neither lent nor borrowed and never used to increase money in circulation. The Fed pays the banks 0.25% to keep them idle.
With $2 trillion in excess reserves, and the prospect of as much as $85 billion added each month, banks receive $5 billion a year, and rising, without taking any risk. For the bankers, that’s a bonanza, paid from monies that the Fed would normally pay to the US Treasury. And, adding insult to injury, about half the payment goes to branches of foreign banks.
In normal times, there are valid reasons for paying interest on excess reserves. Currently, however, it is downright counter-productive. Bank loans have started to increase, but small borrowers, new borrowers, and start-up companies are regularly refused.
Current low interest rates do not cover the risk that banks would take. To be sure, they could raise the rate for new and small borrowers; but, in the current political climate, they would stand accused of stifling economic recovery if they did.
The new Consumer Financial Protection Board is also a deterrent, as banks consider it safer to lend to the government, large corporations, and giant real-estate speculators. The banks can report record profits without much risk, rebuild capital, and pay dividends and bonuses. And the Fed can congratulate itself on the mostly unobserved way that the large banks have used taxpayers’ money.
Instead of continuing along this futile path, the Fed should end its open-ended QE3 now. It should stop paying interest on excess reserves until the US economy returns to a more normal footing. Most important, it should announce a strategy for eliminating the massive volume of such reserves.
I am puzzled, and frankly appalled, by the Fed’s failure to explain how it will restore its balance sheet to a non-inflationary level. The announcements to date simply increase uncertainty without telling the public anything useful. Selling $2 trillion of reserves will take years. It must do more than repeat that the Fed can raise interest rates paid on reserves to encourage banks to hold them. It will take a clearly stated, widely understood strategy – the kind that Paul Volcker introduced in 1979-1982 – to complete the job.
Should the end of QE come in September, December, or later? Does it matter? Historically, the Fed has typically been slow to respond to inflation. Waiting until inflation is here, as some propose, is the usual way. But that merely fuels inflation expectations and makes the task more painful.
And how high will the Fed push up interest rates? Once rates get to 5% or 6%, assuming inflation remains dormant, the Fed can expect a backlash from Congress, the administration, unions, homebuilders, and others.
When contemplating the consequences of this, remember that 40% of US government debt comes due within two years. Rolling it over at higher rates of 4% or 5% would add more than $100 billion to the budget deficit. And that is just the first two years. The budget cost increases every year, as more of the debt rolls over – and that does not include agency debt and the large increase in the current-account deficit to pay China, Japan, and other foreign holders of US debt.
Those who believe that inflation will remain low should look more thoroughly and think more clearly. There are plenty of good textbooks that explain what too many policymakers and financial-market participants would rather forget.
Allan H. Meltzer, University Professor of Public Policy at Carnegie Mellon University and Distinguished Visiting Fellow at the Hoover Institution, is the author of Why Capitalism? and A History of the Federal Reserve.