Archives: Articles

IssueM Articles

Updates from Allianz Life, Athene and Investors Heritage

New caps on AllianzIM Buffered Outcome ETFs

Allianz Investment Management LLC announced new upside caps for the April series of its Buffered Outcome ETFs suite: the AllianzIM US Large Cap Buffer10 Apr ETF and the AllianzIM US Large Cap Buffer20 Apr ETF.

Introduced in June 2020, the AllianzIM Buffered Outcome ETFs offer exposure to the S&P 500 Price Return Index up to a stated cap, while aiming to buffer investors from losses on the downside. AllianzIM currently offers two strategies on the S&P 500 Index: a 10% buffer and 20% buffer, each with quarterly offerings and 12-month outcome periods.

“The funds are the lowest cost defined outcome ETFs on the market today and consistently trade with some of the tightest spreads among peers in the category,” an Allianz Life release said.. AllianzIM manages its ETF line-up on a proprietary in-house hedging platform with over $150 billion in hedged assets.

Investors Heritage Life offers climate-friendly index on new FIA

Investors Heritage Life Insurance Company has launched Heritage Income Advantage, a single-premium fixed indexed annuity. The product offers a Guaranteed Lifetime Withdrawal Benefit (GLWB) Rider, which guarantees income for life, and an Enhanced Income Benefit Rider, which can double income for up to 60 months when certain unexpected health situations occur.

“The Enhanced Income Benefit can be used for five years non-consecutively. A client and spouse can use it for hospital or home-healthcare costs,” said John F. Frye, president of Investors Heritage. HIA allows policyholders to realize upside potential based on three index options: the S&P 500, the S&P MARC 5% (Multi-Asset Risk Control) Index, and SG Entelligent Agile 6% VT Index

Société Générale partnered with Entelligent to launch the SG Entelligent Agile 6% VT Index. The index uses Entelligent’s Smart Climate model to score companies in the S&P 500 based on the potential impact from new environmental-focused regulation and technology as well as forecasted energy costs. The index provides exposure to the 250 companies in the S&P 500 with the highest scores. 

AccuMax is launched by Athene

Athene Annuity and Life Company, a unit of Athene USA, has launched AccuMax, a fixed indexed annuity (FIA) that the company describes as designed for “patient money set aside for retirement or other long-term savings goals.” 

AccuMax makes available multi-year indexed interest crediting strategies, multi-asset indexes, and crediting rates that are guaranteed for the annuity’s withdrawal (surrender) charge period. All fixed and indexed strategy crediting rates are guaranteed for the duration of the Withdrawal Charge period. Additional product features include:

  • Multi-year and annual crediting terms provide growth potential and liquidity.
  • Features new AI Powered Multi-Asset Index (AiMAX1) and Shiller Barclays CAPE Allocator 6 Index (BXIISC6E1).
  • Innovative Annual Interval Sum crediting strategy tied to the S&P 500® combines the benefit of higher rates through a multi-year strategy with the ability to measure index performance in annual steps.
Prudential adds Invesco and BlackRock ETFs to its FlexGuard RILA

Prudential Financial, Inc., has added the Invesco QQQ ETF, which tracks the Nasdaq-100 Index, and the BlackRock iShares Russell 2000 ETF as options within the crediting strategies of Prudential’s FlexGuard indexed variable annuity.

FlexGuard has achieved close to $2 billion in sales within less than a year of launching, according to annuity sales data from the Secure Retirement Institute. Indexed variable annuities are also RILAs (registered index-linked annuities). Sales of RILAs, introduced in 2011 by AXA Equitable, grew more than 30% in calendar 2020.

“FlexGuard’s index strategies allow customers to select strategies providing the potential to accelerate gains above and beyond the index return when certain targets are met. Importantly, FlexGuard is designed to adapt with consumers’ needs, allowing periodic changes to investment length, protection level and growth strategies, as the markets shift, and individual financial goals evolve,” a Prudential release said.

  • © 2021 RIJ Publishing LLC. All rights reserved.

Honorable Mention

Edward Jones to pay $34 million, agrees to improve treatment of minority advisors

Edward Jones, the broker-dealer and 16,000-adviser financial products distribution network, has agreed to pay $34 million to settle a racial discrimination lawsuit filed in 2018 on behalf of current and former African American financial advisers, according to news reports this week. Edward Jones also agreed to change its hiring, training, promotional practices and policies to better support financial advisers of color.

“The settlement includes measures Edward Jones is taking to report diversity progress to its leadership team, create a financial advisor council with diverse representation and reduce training cost obligations,” the brokerage said in a release.

Wayne Bland, a Black financial adviser who worked at Edward Jones from 2014 to 2016 filed the class action suit in 2018. The Chicago law firm of Stowell & Friedman, which negotiated class-action settlements on similar claims against Merrill Lynch and Wells Fargo, represented the class.

Bland’s suit alleged that management at Edward Jones repeated passed over Bland and other Black advisers in favor of equally or less-qualified white advisers when granting or assigning the most desirable assignments, clients, training programs, mentorships, and promotions, all of which reduced the ability of the Black advisors to get ahead at the firm. to young advisers.

The class includes Black financial advisers employed by Edward Jones at any time between May 24, 2014, and Dec. 31, 2020, according to settlement documents filed with the federal court in Chicago.

According to the 2018 complaint, African American hires at Edward Jones were “disproportionately” from the “Legacy” and “Goodknight” training programs, where new advisers received office space, administrative support, and mentoring from an established FA. The suit claims that these programs disproportionately went to white advisers. The best territory assignments and the opportunity to inherit clients from retiring advisers also went mainly to white advisers, the suit said.

“The Firm disproportionately relegates African American FAs to territories and offices in less lucrative locations with less investable income and that are less productive for the FA. The Firm also reserves territories with greater investment opportunities for non-African American FAs in order to race-match its FAs to the neighborhood demographics,” according to the complaint.

Bland and co-plaintiffs said that, in 2015, only 6% of Edward Jones advisers were Asian, African American or Latino, compared with 21% of financial advisers nationally.

J.P. Morgan to diversify advisor hiring by 2025

J.P. Morgan Wealth Management unveiled plans this week to serve more Black and Latinx clients and increase diverse advisor hiring by 2025. The firm said it had made a “$30 billion commitment to advance racial equality.”

The plans will include partnerships with Historically Black Colleges and Universities (HBCUs), initiatives to promote internal mobility, resources to allow diverse employees to grow their career over time and a goal of hiring 300 additional Black and Latinx advisors by 2025.

Over the next five years, J.P. Morgan Wealth Management will partner with various HBCUs to offer students resources and information about careers in wealth management, and to provide scholarships, training and licenses. The initiative will create 185 full time positions specifically for this program by 2025.

The Advisor Development Program is a 24-36 month training that is providing about 270 candidates with the investments knowledge, mentorship and coaching needed to become a successful financial advisor. Nearly 80% of the participants are women or minorities.

HUB launches bundled retirement plan for small to mid-sized employers

The introduction of HUB Retirement Select, a bundled retirement plan solution for small to mid-sized businesses “looking for amenities traditionally afforded to large organizations,” was announced this week by HUB Retirement and Private Wealth, a unit of Hub international Ltd.

HUB Retirement Select is designed for owner-only organizations to those with hundreds of employees, providing “advanced technology and analytics, leading retirement benefits specialists and compliance support at an affordable cost,” according to a news release.  HUB Retirement Select’s managed account service offer investment guidance to participants.

HUB Retirement Select is being positioned as “a highly competitive alternative option to state-mandated and voluntary retirement plans for employers.” California, Illinois, Oregon,  Washington, New York, Vermont, Connecticut, New Jersey, Massachusetts, Maryland, and Seattle have enacted mandated and voluntary retirement programs.

HUB RPW provides investment advisory services on more than $93 billion in assets through its SEC-registered RIAs. It offers institutional and retirement services to for-profit and not-for-profit organizations and customized private wealth management services to individuals and families. Joe DeNoyior is National President of HUB RPW.

Insurance services are offered through HUB International, an affiliate. Global Retirement Partners, LLC, Silverstone Asset Management, LLC, Hub International Investment Advisory Services, Inc., and Sheridan Road Advisors, LLC are SEC-registered investment advisors and wholly owned subsidiaries of HUB International. 
Headquartered in Chicago, Illinois, HUB International Ltd is a full-service global insurance broker with more than 13,000 employees. It provides risk management, insurance, employee benefits, retirement and wealth management products and services.

Allstate Corp. concludes exit from life/annuity business

Wilton Re will pay $220 million to acquire Allstate Life Insurance Company of New York (ALNY) from the Allstate Corporation, according to a release this week. The transaction is expected to close in the second half of 2021, subject to regulatory approval and other closing conditions.

With this transaction, and its announced agreement to sell Allstate Life Insurance Company (ALIC) and certain affiliates to entities managed by Blackstone, Allstate has exited the life and annuity businesses. Allstate agents and advisers will offer life insurance and retirement products of third-party providers. The agreement includes termination of an ALIC stop-loss reinsurance treaty.

Allstate has agreed to contribute $660 million of capital into ALNY, then receive a payment of $220 million from Wilton Re. The transaction will reduce GAAP reserves and invested assets by $5 billion and $6 billion respectively.  The combined divestitures will result in an estimated GAAP net loss of approximately $4 billion, which will be recorded in the first quarter of 2021, and generate approximately $1.7 billion of deployable capital.

J.P. Morgan Securities LLC and Ardea Partners LP acted as financial advisers, and Willkie Farr & Gallagher LLP was the legal adviser to Allstate.

Prudential adds Invesco and BlackRock ETFs as options on its FlexGuard RILA

Prudential Financial, Inc., has added the Invesco QQQ ETF, which tracks the Nasdaq-100 Index, and the BlackRock iShares Russell 2000 ETF as options within the crediting strategies of Prudential’s FlexGuard indexed variable annuity.

FlexGuard has achieved close to $2 billion in sales within less than a year of launching, according to annuity sales data from the Secure Retirement Institute. Indexed variable annuities are also RILAs (registered index-linked annuities). Sales of RILAs, introduced in 2011 by AXA Equitable, grew more than 30% in calendar 2020.

“FlexGuard’s index strategies allow customers to select strategies providing the potential to accelerate gains above and beyond the index return when certain targets are met. Importantly, FlexGuard is designed to adapt with consumers’ needs, allowing periodic changes to investment length, protection level and growth strategies, as the markets shift, and individual financial goals evolve,” a Prudential release said.

© 2021 RIJ Publishing LLC. All rights reserved.
VAs suffer record outflows, but enjoy record assets

The registered index-linked annuity, or RILA, has perhaps the least self-descriptive name in the entire annuity industry, and that’s saying something. A few distributors flat-out hate the acronym for this hybrid product—which combines features of a variable annuity, a fixed indexed annuity, and a structured note.  

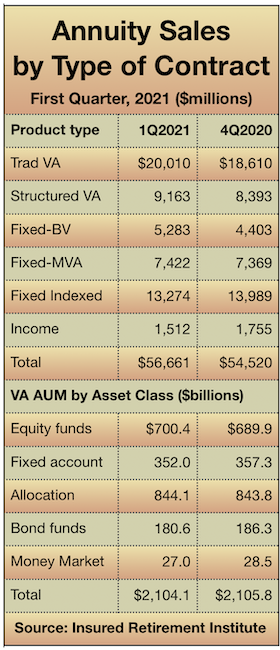
But no one can argues with the sales numbers that RILAs are putting up. As Morningstar’s VA quarterly sales analysis for 4Q2020 shows, sales of these cap-and-buffer contracts were up 70% in the fourth quarter of 2020, versus 4Q2019, and LIMRA had them growing almost 40% in 2020, to $24 billion.

The RILA market is still much smaller than either the traditional VA market ($74.9 billion sales in 2020), where Jackson National dominates ($16.6 billion), or fixed indexed annuities ($55.7 billion) in 2020, where the private equity firms have muscled in. But both of those categories saw overall falling sales in 2020.

That makes sense. RILAs don’t seem to carry the annuity stigma, and they give nervous investors a Goldilocks alternative to high-priced stocks or bonds. Not that the average investor would understand how RILAs work. To structure them, insurers buy upside calls and sell downside puts on domestic or international equity indexes. The call options buy gains up to a cap, and the puts buy buffers against the first five to 35 percentage points of loss over a given term. The S&P 500, Russell 2000 and MSCI are among the indexes commonly used.

With their fixed income assets yielding so little in today’s low interest rate environment, life insurers have for a decade had to tap into the robust equity market, either by wrapping guarantees around mutual funds (in a traditional VA) or buying options on an equity index. Equitable (then owned by AXA) brought the first RILA to market in 2011; others have followed.

Five of the 10 best-selling VA contracts in 4Q2020 were RILAs: Prudential Flexguard B (2), Equitable’s Structured Capital Strategies (3), Lincoln’s Level Advantage (4), Allianz Life Index Advantage Income (6) and Allianz Life Index Advantage (10). The top seller, with a whopping 14.3% market share, was Jackson’s Perspective II.

Flexguard was the top-selling rider in the fourth quarter of last year, but, as a newcomer to the market, was only fifth in sales for the year. Lincoln’s Level Advantage B-share was the top seller for 2020, with $4.18 billion in sales. Allianz’s Index Advantage Income moved into the list of top 10 best-selling VAs jumping 14 places compared to Q4 2019. RILAs accounted for almost 24% of all VA sales in the fourth quarter, up from 14% a year ago.

VA assets top $2 trillion

Sales of traditional variable annuities, with and without lifetime income guarantees, have taken a huge hit from the low interest rate environment of the past decade. While a rising stock market would be expected to favor VAs—which consist of tax-deferred mutual funds—low interest rates makes it expensive to hedge them. Costs have gone up and benefits have gotten less generous.

Sales of VAs have stabilized at between $87 billion to $91 billion a year for the last three or four years, after peaking at $125 billion in 2011. But the real damage shows up in the net flow statistics. The category has suffered increasingly large negative net flows. In 2020, for the first time, net outflows of money from VAs (-$94.9 billion) surpassed new sales ($87.1 billion). 

Don’t cry for VA issuers, however. They are still huge fee generators for the companies that issue them. The market value of assets held in VAs surpassed $2 trillion for the first time in 2020. Since VAs generate both insurance and investment fees (as high as 4%, in contracts with income benefits), those assets could easily produce more than $50 billion in fees for annuity issuers and asset managers. Of that $2 trillion, more than 25% is at TIAA, where it is held mainly in group annuities at the firm’s network of 403(b) plans. The top 10 VA issuers account for about 80% of VA assets.

VAs with GLWBs

The sale of non-RILA VAs offering guaranteed lifetime withdrawal benefits (GLWBs) fell 12% y/y but grew 12% over the previous quarter—signaling a slow recovery for the segment. Jackson’s Perspective II, AIG’s Polaris Platinum III B, and Ameriprise’s RVS RAVA5 Advantage all showed significant sales movement, according to Morningstar.

The Perspective II retained its top position and saw sales jump by 7% to $3.4 billion in the fourth quarter. Its living benefit offers an average fixed percentage increase (FPI) of 6% and its withdrawal rates lie near the 75th percentile of the industry. AIG’s Polaris Platinum grew 8% y/y in sales; its GLWBs offer better-than-average benefit fees and withdrawal rates.

Sales of Ameriprise’s RVS RAVA5 Advantage dropped 34% y/y and the contract fell out of the top 10 sellers. While its living benefits offer a relatively high FPI of 6%, the withdrawal rates of its GLWBs dropped by 20 to 50 basis points year-on-year. Benefit fees increased by 15 to 55 basis points in the same period.

Though Perspective II and RVS RAVA5 have comparable FPIs, withdrawal rates and benefit fees, The discrepancy in quarterly sales between Perspective II and RVS RAVA5 may reflect the role of distribution channels and surrender schedules. The Perspective II is distributed primarily through independent agents; that channel rebounded after restrictions on businesses were lifted in the third quarter.

RVS RAVA5 is distributed through captive agencies, which continue to record negative quarter-on-quarter sales growth. Moreover, interest rates increased in the fourth quarter, which may have led investors to favor more liquid products. RVS RAVA5 has a 10-year surrender schedule, whereas Perspective II has a relatively short 7-year schedule. 

Four new VA contracts were introduced and five closed down in 4Q2020, as new product activity remained sluggish. Seven new living benefits appeared while twelve closed, perhaps because high market volatility drove up the cost of hedging.

© 2021 RIJ Publishing LLC. All rights reserved.

Hardwired COLA vs. Performance-Based COLA: What’s Best?

Retirees understandably would like their income during retirement to increase each year. They can accomplish that in either of two ways: by hardwiring the cost of living adjustment (COLA) into the annual withdrawal schedule or by letting the annual growth of the portfolio (if any) determine the COLA.

A hardwired increase in the annual withdrawal from a retirement portfolio (for example, a 3% annual COLA) sets in motion a schedule of withdrawals that

  • Is known in advance
  • Increases each year 
  • Is blind to the annual performance of the portfolio (thus adding to the portfolio loss after a down year)

Alternately, an annual withdrawal based on a percentage of the portfolio’s year-end value (the Required Minimum Distribution method) will fluctuate from year to year and can decrease in some years. 

The withdrawal will decrease because it is based on the portfolio’s ending account value; if the account value declines, the withdrawal will decline proportionately. This built-in protection mechanism minimizes the damage to a retirement portfolio, especially after a year like 2008. Retirees won’t be guaranteed a larger withdrawal every year, but this approach will be kinder to their portfolios.

Let’s back-test these two methods of withdrawal over the past 95 years (from 1926-2020). We’ll look at 71 rolling periods of 25 years each, where each period represents a retiree who might withdraw money from ages 70 to 94, for example. This multi-period analysis allows us to account for a wide array of possible sequences-of-returns—a vitally important issue to retirees.

We allocated our hypothetical retirement portfolio to 40% large-cap US equity, 20% small-cap US equity, 30% US aggregate bond market, and 10% cash (using common index returns throughout.) We rebalanced annually and for simplicity, excluded taxes and inflation. The portfolio’s starting balance was $1 million and the initial first-year withdrawal was 4%, or $40,000. 

When we used a hard-wired 3% COLA in years 2-25, the withdrawal each year was known in advance and escalated each year by 3% (See Table 1). In year two, the withdrawal was $41,200 (or 3% more than in year one). In year three, the withdrawal was $42,436, and so on. Per the Rule of 72, the withdrawal was $81,312 in year 25, or roughly double the withdrawal in year one. 

Performance-based COLA

We now turn to the performance-based COLA. As Table 1 below shows, a 4% withdrawal rate produced a larger average annual withdrawal in years 2-25 than a fixed 3% COLA. But the different sequences of returns over the 71 rolling periods produced considerable variation in the size of the annual withdrawals.

Table I. Annual Withdrawals. Results drawn from 71 rolling periods of 25-year retirement withdrawal periods from 1926-2020. Assumes $1m starting balance and allocation of 40% large US stock, 20% small US stock, 30% bonds, and 10% cash.


For example, in year 14 (highlighted in yellow), the hardwired COLA of 3% produced a withdrawal of $58,741 in year 14, while the 4% method produced an average withdrawal of $88,813. The highest withdrawal in year 14 (recall that there were 71 year 14’s) ranged from a high of $155,046 (based upon a lucky sequence of returns) to a low of $27,029. The variation in the annual withdrawal in year 14 (and in each year after year 1) was wide—and grew wider over time.

The tradeoff between a hardwired COLA and a performance-based COLA is shown in Table 2. Assuming a 4% initial withdrawal, a performance-based COLA produced an average annual withdrawal of over $90,000 whereas the average annual withdrawal for a hardwired 3% COLA was $58,335. However, your withdrawal using the performance-based COLA would be smaller than in the previous year about 35% of the time.

Is the dollar decline in the annual withdrawal significant? As shown below in Table 2, withdrawing 4% of the portfolio balance each year resulted in year-over-year declines in the annual withdrawal 35% of the time, but the average decline was only $5,807 (with an average annual withdrawal of $90,701 over the 71 rolling periods). Thus, a performance-based COLA exposed the retiree to a 6.4% decline in annual income roughly 35% of the time. The upside of the performance-based COLA was an average annual withdrawal over a 25-year withdrawal period that was 55% higher than a hardwired COLA of 3%.

Table II. Fixed % COLA vs. Performance-based COLA. Results drawn from 71 rolling periods of 25-year retirement withdrawal periods from 1926-2020. Assumes $1m starting balance and allocation of 40% large US stock, 20% small US stock, 30% bonds, and 10% cash.

Portfolio failure rate

Notice in Table 2 that we also analyze withdrawal rates of 5% and 6%. Assuming a 4% initial withdrawal rate, both the hardwired 3% COLA and the performance-based COLA produced no portfolio failures over any of the 71 rolling 25-year periods. When we raised the initial withdrawal rate to 5%, the hardwired COLA of 3% led to a failure rate of 4.2%. That is, 4.2% of the portfolios ran out of money before 25 years. When we raised the initial withdrawal rate to 6% a hardwired COLA led to portfolio failure 8.5% of the time.

Conversely, withdrawing 5% of the portfolio balance at the end of each year led to no failures. Neither did a 6% withdrawal rate. In fact, a 10% withdrawal rate does not lead to any portfolio failures because of the self-protecting nature of a “%-of-portfolio-withdrawal” approach. Of course, at higher and higher withdrawal rates the retirement portfolio will have a lower ending balance after 25 years.

For retirees who don’t mind slight to moderate reductions in their annual retirement income roughly one-third of the time, we believe that withdrawing a fixed percentage of their portfolio’s ending account value each year will be a superior approach.

© 2021 RIJ Publishing LLC. All rights reserved.

Research Roundup

As the Biden administration begins its hunt for revenue to offset the trillions of dollars it hopes to spend on infrastructure renewal and green energy projects, we bring you recent research about taxes. One article describes how the very wealthiest Americans minimize or evade their taxes. The other article, by the Congressional Budget Office (CBO), describes how a big spending program might affect taxpayers and the economy.

You’ll also find an article by MIT’s Adam Solomon and James Poterba (the current president of the National Bureau of Economic Research) on estimating the “money’s worth” of an income annuity. This article is must-reading for retirement plan sponsors who are now required by the Labor Department to tell plan participants how much income their current savings might buy. The answer: It depends.

Finally, financial advisors should benefit from a paper about the ways that millionaires decide how much of their portfolios to allocate to equities. The findings are based on a survey by UBS, GuideWell (a health insurance holding company) and two economists. Millionaires apparently disregard academic dogma. Links to the four articles can be found below.

The Rich Cheat on Their Taxes

Americans with the biggest incomes naturally have the biggest tax bills, and new research finds that they go to great lengths to hide part of their income from the IRS, either in offshore accounts or by underreporting income from private businesses they own, according to new research.

“We estimate that 36% of federal income taxes unpaid are owed by the top 1% and that collecting all unpaid federal income tax from this group would increase federal revenues by about $175 billion annually,” write economic researchers from the Research, Applied Analytics and Statistics office of the Internal Revenue Service and from three universities.

Their paper, “Tax Evasion at the Top of the Income Distribution: Theory and Evidence,” reports on efforts by what they describe as an underfunded IRS to go beyond conventional random audits, which they say fail to detect the sophisticated tax evasion techniques of Americans at the apex of the income spectrum.

“Random audits do not capture most tax evasion through offshore accounts and pass-through businesses, both of which are quantitatively important at the top,” the paper said. “We provide a theoretical explanation for this phenomenon, and we construct new estimates of the size and distribution of tax noncompliance in the United States.”

According to the paper, forms of evasion include “the abuse of syndicated conservation easements, micro-captive insurance schemes, private inurement in tax-exempt organizations, and the use of offshore trusts to evade tax. Many of these strategies involve pass-through businesses or other entities controlled by the taxpayer.” 

Wealthy Americans have more than $1 trillion outside the US, leading the researchers to estimate that “$15 billion in taxes was evaded from offshore accounts, with $10.5 billion of this total attributed to the top 0.1%, and $6.4 billion attributed to the top 0.01%.”

How Millionaires Set their Equity Allocations

A survey of 2,484 US individuals with at least $1 million of investable assets shows that the most important factors determining the share of equities in their portfolios are “professional advice, time until retirement, personal experiences, rare disaster risk, and health risk.”

How well do their financial beliefs and decisions follow “leading academic theories”? Not a whole lot, according to a new paper, “Millionaires Speak: What Drives Their Personal Investment Decisions?” by a team from the Yale School of Management, GuideWell, the health insurance holding company, UBS and the University of Toronto law school.

Only 15% of the survey respondents said that the fundamental consideration affecting equity allocation in most modern asset pricing theories—return covariance with the marginal utility of money—was very or extremely important to them. Only 9% of respondents said that “return covariance with the marginal utility of consumption” was very or extremely important. 

“On average, respondents hold 53% of their portfolio in equities,” the paper said. Only 6% hold no stocks (vs. 48% of the total 2016 Survey of Consumer Finance US study population). Of the stocks they own, 83% are domestic US. Only 10%  of the millionaires invest in hedge funds, venture capital, or private equity. Those who do allocate 13% of their portfolio to these vehicles.

“Rich investors collectively believe that high-profitability stocks offer high risk-adjusted returns. Indeed, it is not that such stocks have risk that is elevated, but not sufficiently elevated to offset their higher expected returns: our respondents tend to believe that these stocks have lower risk while offering higher expected returns,” the paper said.

“Conversely, they believe that high-momentum and high-investment-expenditure stocks offer low risk-adjusted returns, featuring lower expected returns and higher risk. Value stocks are thought to have both low expected returns and lower risk.

“Nearly half of our respondents have invested in an active investment strategy through a fund or professional manager, and the most common reasons for doing so are professional advice and the expectation that they will earn higher average returns from active investing. Past fund manager performance is seen as a strong evidence of stock-picking skill.”

The Present Value of an Annuity is a Moving Target

Because the Department of Labor (DOL) now requires defined contribution plan sponsors to provide participants with annual estimates of the annuity income stream that their plan balance could purchase, two MIT economists have looked into the “money’s worth” of US individual retail annuities during 2020.

The money’s worth of an annuity is its expected present discounted value of future payments (EDPV) divided by the annuity’s purchase price. The economists used discount rates drawn from the corporate BBB yield curve. They used future mortality rates that combine a Society of Actuaries individual annuitant mortality table with projections of future mortality improvements from the Social Security Administration.

Their paper,  “Discount Rates, Mortality Projections, and Money’s Worth Calculations for US Individual Annuities,” James Poterba and Adam Solomon demonstrates that the costs and potential benefits of the kind of retail annuities available to retiring plan participants are (and will always be) moving targets, affected by factors such as interest rates, the health of the annuity purchaser, and the design of the individual annuity contract (i.e., period certain, joint-and-survivor).   

The papers shows that coming up with those estimates may be difficult for plan sponsors, considering the numerous variables involved. The low interest rate environment has also been driving down the payout rates of income annuities for years. “Our central estimates… suggest money’s worth values for annuities offered to 65-year-old men and women of about 92 cents per premium dollars.” the authors write. 

The government’s push to promote annuities unfortunately happens to coincide with a trough in the payouts of retail annuities, which results from an ongoing decline in bond yields. As the paper shows:

The average annual payout on a $100,000 SPIA [single premium immediate annuity] for a 65-year-old man was $5,748 in June 2020, [and between June 2020 and January 2021 dropped 3.3%, from $5,748 to $5,556. There was a similar drop, from $5,424 to $5,244, for 65-year-old women].

Payouts were $6,456 in June 2015, $7,344 in June 2010, and $7,740 in June 2005. The yield on a 10-year Treasury bond, which averaged 0.73% in June 2020, was 2.36% in June 2015, 3.20% in June 2010, and 4.00% in June 2005.

Deferred annuities (and their tax-deferred equivalents, called Qualified Longevity Annuity Contracts), which characteristically produce income starting at age 80 or 85, offer less value than immediate annuities, the paper showed, partly because of adverse selection.

“The lower EPDV for the deferred annuities may reflect insurers’ reluctance to offer long- duration policies with substantial risk of medical progress or other unexpected developments before payouts begin. It is also consistent with more pronounced selection in the market for deferred annuities, with only the healthiest individuals at age 65 choosing to purchase deferred annuities,” the authors explained. That’s unfortunate, because deferred annuities have long been envisioned by academics as the thriftiest way for retirees to mitigate the financial consequences of living to extreme old age.

The authors also note that employers who follow DOL instructions and use the 10-year Treasury rate to calculate annuity payouts would understate the payouts.

“The regulations outline a procedure for calculating the potential annuity payout assuming that future benefits are discounted at the 10-year Treasury yield,” they wrote. “Our findings suggest that the use of the Treasury yield in this calculation may understate the income stream that will be available to future retirees.”

The Effects of Biden’s Spending Plan on Future Taxes: CBO

In their timely article, “The Economic Effects of Financing a Large and Permanent Increase in Government Spending,” analysts at the CBO examine the fiscal challenge the US government will face if it tries to finance—without raising the federal deficit—an increase in annual federal spending by 5% or 10% of Gross Domestic Product (GDP) for 10 years. 

The analysts, Jaeger Nelson and Kerk Phillips, rule out the possibilities of financing the increase with budget cuts or deficit spending. Instead, they focus on the tax implications and consider the impact of three types of taxes:

  • A uniform tax on labor income only. That tax is like the Medicare hospital insurance payroll tax, which has no maximum taxable income. 
  • A flat (single rate) tax on all sources of income, including both labor and capital income.
  • A progressive tax on labor income, similar to the current income tax, and a flat tax on capital income. 

They conclude that:

To maintain deficit neutrality, tax rates for all three tax policies must rise over time to offset behavioral responses that result in smaller tax bases. After 10 years, the level of GDP by 2030 is between 3% and 10% lower than it would be without the increase in expenditures and revenues.

Younger households would experience greater loss in lifetime consumption and hours worked than older households, they write. A progressive income tax causes the largest fall in lifetime consumption and hours worked for higher-income households and smallest for lower-income ones. It also generates the largest decline in total output and the smallest decline in consumption among the bottom two-thirds of the income distribution.

But this isn’t the whole story, the authors concede. “The analysis does not consider any effects of the expanded government spending…  Well-targeted government spending on physical capital, education and training, and research and development increase the productivity of private businesses. Productivity increases brought on by well-targeted government spending boosts GDP, private investment, and, ultimately, the amount households can consume,” they write.

The paper makes assumptions that are not universally held, such as:

“Taxes on labor income reduce after-tax wages, so they reduce the return on each additional hour worked. That reduced incentive to work is then partially offset because people have lower expected future income, which creates an incentive to work more to make up for their lost after-tax income. On average, the former effect is greater than the latter in CBO’s assessment; therefore, higher labor taxes tend to reduce hours worked in the economy. Higher taxes on capital income, such as dividends and capital gains, lower the average after-tax rate of return on private wealth holdings (or the return on investment), which reduces the incentive to save and invest and leads to reductions in saving, investment, and the capital stock.”

Those assumptions are based on the following belief, which behavioral economists, among others have questioned as dated and unfaithful to the real world:

“Households in the model used in this paper have perfect information about the path of future policy and the distribution of their potential earnings over their lifetime; moreover, households’ behavior is perfectly rational and consistent with their preferences about private consumption and hours worked.”

© 2021 RIJ Publishing LLC. All rights reserved.


Honorable Mention

Canadian firm buys Ohio National for $1 billion

Constellation Insurance Holdings Inc., an insurance holding company financed by Canadian public pension plans, is buying the mutual holding company that owns Ohio National Financial Services for $1 billion, the companies announced today.

Ohio National Mutual Holdings Inc. is the parent of Ohio National Financial Services. The firm’s flagship subsidiary, The Ohio National Life Insurance Company, has operated in Cincinnati since 1909.

Constellation plans to help Ohio National shift away from the mutual holding company structure, through a process called a “sponsored demutualization,” the companies said. Constellation will provide $500 million that Ohio National could use to pay the policyholder owners to extinguish their mutual holding company ownership interests, the companies said.

Also, Constellation will add $500 million in capital to the company over four years, to strengthen its capital position and its ability to meet its obligations, the companies said in a release.

Barbara Turner, Ohio National’s CEO, said in a statement that the company agreed to the deal “in the midst of a challenging economic environment, historically low interest rates, increased regulatory costs and pressure for the entire industry.” The Constellation deal will fortify Ohio National with more capital and create a more flexible capital structure, she said.

Anurag Chandra, the founder, chairman and CEO of Constellation, said his firm wants to give Ohio National and other insurers more access to capital, “while preserving the independence, brand, existing operations and culture for which they are recognized.”

Net income of life/annuity industry fell almost 50% in 2020

The US life/annuity (L/A) insurance industry saw its net income cut nearly in half in 2020, to $24 billion from $45 billion. These preliminary results are detailed in a new Best’s Special Report, titled, “First Look: 12 Month 2020 Life/Annuity Financial Results.”

The data is derived from companies’ annual statutory statements received as of March 17, 2020, representing an estimated 98% of total industry premiums and annuity considerations.

According to the report, premiums and annuity considerations for the L/A industry declined 8.3%, as Jackson National Life entered into a coinsurance agreement with Athene Life Re and ceded $24 billion of individual annuities to Bermuda. Increases in the amortization of interest maintenance reserve and other income offset the decline, and resulted in a 4.7% drop in total income, compared with prior year.

Due to the drop in income exceeding a 2.6% reduction in expenses, pretax net operating gain fell by 35.0% to $39.9 billion from the prior year. Income tax expense was also down in 2020, by $4.1 billion, but net realized capital losses increased by $3.9 billion, resulting in the drop of total industry net income to $24 billion.

New index annuity income rider from AIG

AIG added a new “protected lifetime income benefit,” to the contracts in its Power Series of index annuities, according to a release this week from AIG Life & Retirement, a division of American International Group, Inc. The contracts are available only through agents of independent marketing organizations (IMOs).

The Lifetime Income Choice benefit rider is automatically included at contract issue in the Power 7 Protector Plus Income and Power 10 Protector Plus Income Index Annuities for an annual fee of 1.10% of the so-called Income Base.

The Income Base is initially equal to the first eligible purchase premium. It increases when new premiums are paid, and it is adjusted for withdrawals. On each contract anniversary, the owner’s Income Base is marked up to which ever is greater: the contract value on the anniversary value or the Income Base plus any available income credits. 

The rider includes two options, Max Income and Level Income. The Max Income option weights income toward the early, so-called go-go years of retirement. Level Income provides a consistent income for life. Both options guarantee income growth every year prior to activating the lifetime income benefit.

Lifetime Income Choice locks in the greater of cumulative interest earned or an annual income credit of 5.50% as a deferral bonus for every year that lifetime withdrawals are delayed, “ensuring that future income will increase, even if index performance is flat or down,” the release said.

When contract owners start taking income, Max Income offers initial annual withdrawal rates ranging from 3.65% at ages 50 to 59 to 7.25% at age 72 and older for a single person. Rates are lower for couples. If the annuity’s account balance is depleted before the contract owner(s) die, the contract owner(s) will receive annual income of up to 4.00% for life.

The Level Income option offers a level payout for life, even if the annuity’s account balance is depleted. The annual withdrawal rate for one person ranges from 3.4% at ages 50 to 59 to 5.85% at age 72 and older. The Max Income option may not provide more cumulative income than the Level Income option.

SIMON adds First Trust Target Outcome ETFs

First Trust’s Target Outcome ETFs are now available at SIMON, a structured products sales, education and management platform serving some 85,000 asset managers with more than $3 trillion under management. SIMON offers “on-demand education, an intuitive marketplace, real-time analytics, and lifecycle management,” a release said.

First Trust Advisors L.P., the second largest provider of actively managed funds in the US, said in the release that its recently issued Target Outcome ETFs have grown to over $1.6 billion, as of the end of last year.

First Trust is initially offering buffered ETFs tied to the SPY, QQQ, and EFA indexes in SIMON’s ETF Marketplace, with additional offerings in the pipeline. The ETFs offer index gains up to a cap and down to a “buffer,” which protects investors up to but not beyond a downside buffer limit.

SIMON’s digital platform enables financial professionals to learn about, analyze, and invest in defined outcome ETFs.

KKR, owner of Global Atlantic, reports earnings

Between January 1 and March 22 of this year, KKR, the investment company that recently acquired Global Atlantic Holdings, earned gross realized carried interest and total realized investment income of approximately $600 million, according to a “monetization activity update” by the firm.

The earnings were driven primarily by strategic and secondary sale transactions that have closed quarter to-date, as well as dividend and interest income from KKR’s balance sheet portfolio, according to the update.

“The estimate disclosed above is not intended to predict or represent the total revenues for the full quarter ending March 31, 2021, because it does not include the results or impact of any other sources of income, including fee income, losses or expenses. This estimate is also not necessarily indicative of the results that may be expected for any other period, including the entire year ending December 31, 2021,” the release said.

KKR offers alternative asset management and capital markets and insurance solutions. The company sponsors investment funds that invest in private equity, credit and real assets and has strategic partners that manage hedge funds. Its insurance subsidiaries offer retirement, life and reinsurance products under the management of The Global Atlantic Financial Group. 

Voya, Morningstar in managed accounts partnership

Voya Financial, Inc., and Morningstar Investment Management LLC are collaborating on a new adviser managed accounts advisory program for Voya’s suite of financial wellness offerings, to be used by Registered Investment Advisors (RIAs) who advise retirement plan participants.

A new Voya survey shows that 76%)of working Americans currently enrolled in a workplace retirement plan want access to a financial adviser. New research from Morningstar Investment Management suggests that remote-working arrangements are likely to increase demand for managed accounts.

Remote workers are less likely to use default investments (such as target-date funds) than  personalized advice options (such as managed accounts), Morningstar’s research showed.. 

The same study also notes that participants who use managed accounts tend to save more for retirement — both when the service is offered as an opt-in and opt-out method.3

When Voya serves as plan recordkeeper, Morningstar Investment Management provides the technology support for adviser managed accounts and serves as the fiduciary for portfolio assignment and recommendations on savings rates and retirement age. Participants use a “single sign-on” to enroll in the plan and the managed account. 

Voya has already launched the adviser managed accounts program with advisory firms CBIZ Investment Advisory Services LLC, and Resources Investment Advisors – A OneDigital Company. As the program advances, Voya expects to work with additional RIAs. 

A ‘longevity’ biotech SPAC  

Shareholders of Longevity Acquisition Corporation (LOAC) have approved its merger with 4d pharma plc, a British biotech firm focused on Live Biotherapeutics (LBPs). In October 2020, 4d pharma announced its intention to merge with LOAC and seek a NASDAQ listing.

The merger and the NASDAQ listing of 4d pharma American Depositary Shares (ADSs) under the ticker symbol ‘LBPS’ are expected to become effective in early 2021, subject to approval of 4d shareholders and Longevity shareholders, and the SEC review process.

LOAC, a “blank check” or Special Purpose Acquisition Company (SPAC), is sponsored by Whale Management Corporation, a Bermuda-based LLC. 4d pharma develops LBPs, a class of drugs that contain a live organism, such as a bacterium, that is applicable to the prevention, treatment or cure of a disease. 

4D has developed a proprietary platform, MicroRx, that “rationally identifies LBPs based on a deep understanding of function and mechanism,” according to a release. 4d pharma’s LBPs are orally delivered single strains of bacteria that are naturally found in the healthy human gut. 

The company has six clinical treatment programs underway, for cancer, Irritable Bowel Syndrome, COVID-19, Parkinson’s disease and other maladies. It has a research collaboration with MSD, a trade name of Merck & Co., Inc., Kenilworth, NJ, to discover and develop LBPs for vaccines.

© 2021 RIJ Publishing LLC. All rights reserved.
 

At the Supreme Court, a stress test of ‘best interest’ promises

If a company promises shareholders that it will always act in their best interest and then compromises its reputation and hurts its stock price by behaving badly, is the company guilty of fraud and are those investors entitled to compensation for their investment losses?

Or can an investment company call itself a “best interest” actor and then not be liable for the conflicted actions of one of its many departments? And are we talking about “best interest” as established by the Trump SEC or the Obama DOL?

Those hefty questions will be taken up by the US Supreme Court next Monday when it hears oral arguments in the case of Arkansas Teacher Retirement System versus Goldman Sachs Group.

The case took a decade to reach the high court. A complaint was first filed in 2010, after Goldman shareholders learned that the firm created and sold complex but flawed collateralized debt obligations (CDOs) and then knowingly betting against them with its own money. In a case related to that incident, Goldman paid the Securities and Exchange Commission a record $550 million fine.

Investors who bought Goldman stock in the early days of the financial crisis said they paid an inflated price for the stock based on Goldman’s “false statements about its high standard of conduct and strong protections against conflicts of interest,” according to a release this week by the Consumer Federation of America, a Washington watchdog group.

“To protect its sterling image, and its share price, Goldman made false statements that it always acted in its clients’ best interest and carefully managed its conflicts, even as it was selling mortgage-backed securities to its clients without warning them that the investments were destined to fail,” said Barbara Roper, director of investor protection, Consumer Federation of America.

“Goldman is asking the Supreme Court to conclude that its disclosures, which led directly to investor losses, were too generic to permit those investors to recover their losses in court,” Roper said. “But such a maneuver, if allowed to go unchallenged by the Court, would let companies off the leash, ushering in a wide range of misleading behavior that could materially harm U.S. investors.”

Goldman had made public assurances that it had “extensive procedures and controls that are designed to identify and address conflicts of interest” and that “[o]ur clients’ interests always come first,” the CFA release said. The release did not include a response from Goldman Sachs group.

On March 3rd, former SEC Chairs William H. Donaldson and Arthur Levitt, Jr., were among six former SEC officials cautioning the Supreme Court about the peril of allowing Goldman Sachs to avoid facing an investor lawsuit related to false and misleading claims that the investment firm admits that it made. Amicus briefs in opposition to Goldman Sachs also were filed by state securities regulators, investor advocates, pension funds, and others.

Andrew Park, senior policy analyst, Americans for Financial Reform Education Fund, said in the release: “There remains overwhelming evidence, courtesy of the 2011 Senate Permanent Subcommittee on Investigations report, showing how Goldman’s employees were not only aware of the poor quality of mortgage-backed securities and collateralized debt obligations they were selling, but also that they knowingly failed to disclose to their clients key details on how the bank or hedge funds were on the other side betting against them.

“If shareholders faced with losses have no recourse against companies who concealed their behavior and knowingly skirted a number of laws, a terrible precedent will be set for investor protection going forward.”

© 2021 RIJ Publishing LLC. All rights reserved.

China’s Bond Market: Too Big To Ignore

Over the last two decades, China has grown into the world’s second largest economy, generating around 20% of the world’s GDP. It is now the world’s most populous country, its leading manufacturer and purchaser of automobiles, and its largest exporter.

China also hosts the world’s second largest bond market. In the past, restrictions and complications have kept that market off American investors’ radar screens. But with low yields in the US, Europe, and Japan, China’s bonds—government or corporate, denominated either in dollars or yuan—warrant more attention. 

Dollar-denominated bonds

China’s US dollar bonds should be seen as credit investments, not unlike US corporate bonds. The key risk is in repayment: Will coupons and principal be paid back on time. China sovereign debt carries credit ratings of A+ from Standard & Poor’s, similar to Moody’s equivalent rating, and better than many countries in Europe. But not all issuers in China carry such a high rating. China is one of the rare emerging markets (EM) with both an active investment grade market for US bonds and a high-yield market with more than 160 hard currency issuers. Backed by an economy nearly as large as all other EM countries combined, China’s US dollar-denominated corporate issues now comprise 27% of the J.P. Morgan EM corporate debt benchmark.

Large state-linked players dominate China’s high-grade market. That includes global banks, energy companies, and tech players. The 106 Chinese investment grade issuers in the J.P. Morgan Corporate EM Broad Investment Grade Index yield 2.60%, with an average spread of 1.42% over comparable US Treasuries.

The risks of these bonds tend be similar to those of US bonds, and are largely interest rate driven. If rates go up, longer-dated bonds tend to get marked down more than shorter term bonds. Default risk in high-grade bonds is low. Bonds with deteriorating credit typically are downgraded to junk levels but rarely if ever default as an investment grade rated instrument. In the US dollar high-yield sector, China has more than 60 issuers with an average yield of 7.30%. This segment has had the highest year-to-date net issuance of any country in the EM corporate high yield index.

Yuan-denominated bonds

The Chinese have slowly opened their local bond markets to foreigners. Access to these bonds are still highly regulated and not 100% fully accessible, but large mutual fund and exchange traded funds (ETF) companies have been paving the way for retail and institutional investors to gain exposure in recent years. And for good reason: at approximately $16 trillion in value, the Chinese market has become too big to ignore as it grows in bond indices and offers higher yields than in the other large economies.

China’s yuan has slowly grown into a reserve currency, as the country has become the world’s largest trading partner. Local bond investments prices are affected by local interest rate and foreign exchange rates. The Chinese currency has ranged between 6.27 and 7.18 against the U.S. dollar for the last five years according to Bloomberg, and now hovers around 6.50.

Almost 200 foreign funds held Chinese bonds in late 2020 via the expanding China Interbank Bond Market (CIBM). That was 42% above year-ago levels, according to Reuters. As of mid-March 2021, two-year local government bonds yielded 2.83% vs. only 15 bps in US Treasuries, and comparable 10-year debt paid 3.26% vs. 1.62%. By comparison, Japanese and Germany 10-year yields were at .10bps and -33bps, respectively, as of the same date. Two-year yields both were negative yielding: -14bps. and -68 bps, respectively. Credit issued by Chinese government entities, banks, and corporations pay additional credit spreads above these yields.

The chart below shows how five-year local rates have fluctuated since February 2015.

China is also one of the world’s largest issuers of “green bonds,” floating $37.6 billion worth in 2020, according to S&P. That’s considerably less than the record $55.58 billion in 2019 but still significant given the global pandemic slowdown. President Xi Jinping’s announced in September that China plans to reduce greenhouse gas emissions and become carbon neutral by 2060; that may drive more issuance of green bonds.    

Caveat emptor

Investors should exercise more-than-usual care when venturing into Chinese bonds. Local defaults have risen, especially since 2018, according to J.P. Morgan. That said, the default rate was only about 1.10% overall in 2020, but investors need to pay close attention to specific segments. During the 2020 pandemic, the consumer-sector default rate jumped to 4.8%.

China’s disclosure rules differ from those in the US. Some information is lacking by American standards. US sanctions against several Chinese companies in recent years add an element of political risk that American investors seldom encounter. Individual – and even institutional – investors might prefer an exchange traded fund (ETF) or mutual fund, with professionals managing the credit and political risks. Funds also help diversify and minimize issuer-concentration risk.

US investors took decades to globalize their equity portfolios, and they’ve taken even longer with bonds. It’s time to look at China. The country contained COVID-19 quickly, and its economy actually expanded by 2% in 2020. The growth rate may top 6% in 2021, and the economy is on track to surpass America’s in a decade or two. Once small and protected, the country’s local bonds markets—like its stock market and overall economy—can’t be ignored. 

Peter Marber, PhD, is a 30-year Wall Street veteran, heads emerging markets at Aperture Investors, LLC and lectures at Harvard and Johns Hopkins. He would like to thank Yardley Peresman of Aperture Investors, LLC for her contributions to the article.

The views expressed are those of Peter Marber but may not be the views of Aperture Investors, LLC.

DISCLOSURES

This whitepaper was prepared by Peter Marber. The examples cited herein are based on public information and we make no representations regarding their accuracy or usefulness as precedent. The author’s views are subject to change at any time based on market and other conditions. The information in this report represents the opinions of the author as of the date hereof and is not intended to be a forecast of future events, a guarantee of future results, or investments advice. The views expressed may differ from other investment professionals or from the firm as a whole.

This whitepaper is not an offer to sell any security nor is it a solicitation of an offer to buy any security. For more information, visit our website:  www.apertureinvestors.com

Of Politics and the Pension-Saving ‘Butch Lewis Act’

An $86 billion provision in the new $1.9 trillion American Rescue Act should soon bring some relief to the walking-wounded of the retirement income world: retirees from or participants in financially distressed multiemployer pension plans (MEPs), who have faced or could face deep cuts in their promised pension benefits.

The provision, known as the Butch Lewis Emergency Pension Relief Act of 2021, would give enough money to the Pension Benefit Guaranty Corporation, which backstops MEPs, to help fund the pensions of more than a million members of hundreds of troubled MEPs. Some MEPs, like the United Mine Workers pension and the Central States Teamsters pension, are huge.

“As of 2017, more than 300 plans were classified as critical and more than 100 of those were classified as critical and declining,” the Congressional Budget Office reported last month, noting that 18 “critical and declining plans” have suspended benefits to avert insolvency under the Multiemployer Pension Reform Act of 2014.

Divisive issue

As political wedge-issues go, union pensions with public backing (from the underfunded PBGC, in this case) are among the most toxic. They are also emotional, with retirees and widows testifying to the hardships caused by the loss of benefits. Republicans and Democrats have failed for years to resolve the MEP shortfall in bipartisan fashion.

Butch Lewis

The Biden administration decided to put MEP funding into the American Rescue Act, which the president signed March 11. The bill had passed the Senate with no Republicans voting in favor. Democrats, unions, the Pension Rights Center, and pension experts like Alicia Munnell of Boston College and Joshua Gotbaum (director of the of the PBGC from 2010 to 2014) have praised the Butch Lewis Act in recent web posts.

Conservatives have called it as a taxpayer bailout of poorly managed pension funds, a counter-productive invitation to further employer withdrawals from MEP sponsorship, and a prelude to federal bailouts of underfunded public-sector pensions in the US (which the federal government, however, doesn’t insure). Some objected to the inclusion of the provision in the American Rescue Act because it was unrelated to COVID-19.

Changes in the Senate

To complicate matters, the Butch Lewis Act (named for the late Ohio trucker, Teamster union official, Vietnam veteran, and one-time Pittsburgh Pirate baseball prospect) ran into an eleventh-hour political snag. According to Littler, a Philadelphia labor law firm,

“The original version of the bill the House first passed provided that for 15 years after the fund received the grant, the calculation of an employer’s withdrawal liability would not take into account that subsidy. Thus, for 15 years, if an employer withdrew, it would still owe the same amount as it would have owed had the fund never received the financial assistance.

“The bill changed in the Senate, however. The Senate Parliamentarian determined that the change to the withdrawal liability calculation was not about revenue, and thus could not be included in the bill under the Byrd rule. The law President Biden signed is therefore silent as to what this funding does to an employer’s calculation of withdrawal liability.”

This led to a guest blogpost at the website of Wharton School’s Pension Research Council, in which Aharon Friedman, a former senior tax counsel to the House Ways and Means Committee, characterized the bill as an invitation to moral hazard. The bill would use “byzantine mechanics to preserve plans that may backfire unpredictably, leaving plans to resemble Weekend at Bernie’s, astronomically higher costs, and years of litigation,” he wrote.

If the bailout makes plans healthier, he argued, it would reduce the penalties that employers would face if they withdrew from a plan. Ergo, more employers would abandon plans.

“Under the Senate changes, plans receiving bailouts will be dramatically better funded for purposes of calculating withdrawal liability, allowing employers to wash their hands of the union pension mess for good at low or no cost and terminate the plans,” Friedman wrote, adding that the full cost of the bailout could run to trillions not billions of dollars.

Good but not perfect

For Gotbaum. this puts too cynical a spin on the Butch Lewis Act, which he believes will make retirement more secure for millions of workers.

“The real factor that keeps most employers in plans was and is that the union must agree to withdrawal,” Gotbaum told RIJ. “Prior to passage of the law, participating employers faced the prospect of steadily increasing underfunding and could make a case for being allowed to withdraw.

“A major employer could demand and get agreement from a union to withdraw, generally by making commitments outside the plan or improving the labor agreement in other respects. Butch Lewis completely changes this calculus. While it is true that financial assistance will reduce the calculated withdrawal penalty, it also eliminates the near-term risk of plan insolvency, so both the employer’s need for withdrawal and the union’s willingness to allow withdrawal will be dramatically reduced.”

While Gotbaum praised the new law, he conceded that it was less than he and others had hoped for. “The bill did none of the reforms that most of us would like,” Gotbaum told RIJ. Munnell wrote recently that the legislation didn’t define the appropriate interest rate for calculating liabilities or replace the traditional defined benefit structure with some shared-risk arrangement. Perhaps its flaws will be addressed when the PBGC and the Treasury Department begin writing regulations around it. 

Editor’s note: MEPs covered by the Butch Lewis Act should not be confused with the multiple employer 401(k) plans (also known as MEPs), where employees in unrelated companies can participate in a single Pooled Employer Plan.

© 2021 RIJ Publishing LLC. All rights reserved.

Millennials lead in ETF adoption: Schwab

ETF investors expect the share of ETFs in their portfolios to grow to 38% over the next five years, up from 29% today. Nearly all ETF investors (94%) say they are likely to purchase ETFs in the next two years. Notably, almost half of the non-ETF investors surveyed (45%) say they are likely to purchase ETFs in the next two years. These findings come from the 10th edition of the ETF Investor Study by Charles Schwab & Co., Inc.

“Over the decade we have conducted this study, ETF investors’ appetite and affinity for ETFs has grown dramatically. They feel much more knowledgeable and confident in their abilities to use these products to help achieve their financial goals,” said David Botset, SVP of Product Strategy for Charles Schwab Investment Management, Inc., in a release this week.

Chart furnished by Schwab.

As in years past, Millennials continue to outpace Gen X and Baby Boomers in ETF adoption, though Gen X is not far behind. Over the next year, 29% of Millennial ETF investors plan to significantly increase investments in ETFs, compared to 23% of Gen X investors and 9% of Boomer investors. Millennials estimate that in five years, 43% of their portfolios will be in ETFs, compared to 39% for Gen X and 29% for Boomers.

ETF investors point to actively managed ETFs, market cap index ETFs and fixed income ETFs as the top categories that they feel will add value in helping them reach their investment goals. Active semi-transparent ETFs are beginning to attract investors’ interest, with 16% saying they plan to invest in these specialty ETFs over the next year.

ETF Investor Evolution

The proportion of ETFs in investors’ portfolios increased by about 50% over the last decade, growing from average allocations of 19% to 29%. In 2015, ETF investors predicted that 25% of their portfolios would be in ETFs in five years – a prediction that turned out to be short. They ended up with 29% of their portfolios in ETFs in 2020, and they now expect that to grow to 38% by 2025.

Investors feel much more confident when it comes to making decisions about ETFs. In the latest study, 41% of investors say they are extremely confident in their ability to choose ETFs that can help achieve their investment objectives compared to just 18% in 2015. Similarly, 77% of ETF investors consider themselves experienced or intermediate when it comes to their understanding of ETFs, compared to 57% in 2015.

“Education is a key ingredient to success in all aspects of investing, so it is very exciting to see the evolution that has taken place with ETF investors’ familiarity and comfort with ETFs,” said Botset. “Certainly the myriad strengths of ETFs – from tax efficiency, to low fees, to transparency—have paved the way for investors to adopt them as foundational building block components of an investment portfolio.”

Charles Schwab & Co., Inc. (Schwab) commissioned Logica Research to conduct an online survey of 2,000 individual investors between the ages of 25 and 75 with at least $25,000 in investable assets who are aware of ETFs. Conducted from November 9 – November 29, 2020, the study has a 3% margin of error at the 95% confidence level. Survey respondents were not asked to indicate whether they had accounts with Schwab. All data is self-reported by study participants and is not verified or validated.

© 2021 RIJ Publishing LLC. All rights reserved.

Where investors put their money in February: Morningstar

Rising interest rates and a swing in equity market leadership during February seemed to invigorate investors rather than scare them off. Long-term mutual funds and exchange-traded funds took in a record $144 billion in February, surpassing the previous mark of $132 billion set in January 2018, according to Morningstar’s latest monthly fund flow report.

ETFs collected roughly $92 billion, driven by a move into passive equity funds, while open-end funds took in $53 billion, led by flows into actively managed fixed-income strategies.

Money flowed into Morningstar Categories that might weather an inflationary environment better than most, such as commodities broad basket and inflation-protected bonds. Prospects of a new federal stimulus package along with lower coronavirus case counts likely spurred optimism about future economic activity while sparking concerns about higher inflation.

Equities

US equity funds gathered a record $38 billion after investors redeemed nearly that same amount in January. Despite the wave of interest, all the inflows accrued to passive strategies; in contrast, actively managed US equity funds shed nearly $3 billion. February’s inflows for the category group are still a blip relative to the $228 billion of outflows over the trailing 12 months, but they may be a sign that investors aren’t shying away from equities despite markets nearing all-time highs.

Sector equity funds raked in a record $25 billion, powered by strong inflows into technology funds. For instance, ARK ETF Trust’s tech offerings (ETFs specializing in fintech, internet, robotics and 3D printing) collectively pulled in $4.5 billion, by far the most of any other fund family in the technology category. (See more details on ARK below.)

International-equity funds took in about $13 billion in February, their fourth consecutive month of inflows. The group’s second-largest category by total assets, diversified emerging markets, gathered the largest inflows at about $6.5 billion.

Fixed income

Taxable bond funds continued their run of inflows, gathering $57 billion for the month, bringing their total over the trailing 12 months to $493 billion, the most by far for any group. While rising interest rates led to negative performance for major bond-market benchmarks such as the Bloomberg Barclays US Aggregate Bond Index through the first two months of the year, investors didn’t shy away from the asset class and may still be using it to rebalance away from a red-hot equity market.

They appear to be tailoring their allocations, however. Lower-duration categories (that is, funds with fixed-income investments that are less sensitive to rising interest rates) attracted the most assets. Intermediate core bond funds took in the largest total within the category group, collecting $18 billion, followed by short-term bond funds’ $11.6 billion intake.

Value equity

Following a rough stretch in terms of performance and outflows, value-oriented equity funds may finally be seeing some reversion. US value stocks have outperformed growth stocks through the first two months of the year, and investors seem to be embracing the shift. Large-cap value funds took in $5 billion in February, the most since 2013. While mid-cap value funds took in just $200 million, that broke a streak of 43 straight months of outflows dating back to June 2017.

Leaders

With strong flows into passively managed equity strategies, it comes as no surprise that index-fund titans Vanguard and iShares took in the most and third-most among the largest asset managers. Vanguard pulled in roughly $37 billion, of which $34 billion went to passive strategies, while iShares’ funds raked in $16 billion.

While it’s not one of the largest fund families in terms of AUM, ARK ETF Trust is reaping flows at a remarkable pace. The advisor of a suite of mostly actively managed ETFs has seen its asset base grow from a humble $3.2 billion on Dec. 31, 2019 to $51 billion at the end of February 2021.

While strong gains across its aggressive, high-growth equity offerings account for a meaningful portion of this growth, it also took in more than $36 billion of new assets over the prior 12 months, for an astounding 1,024% organic growth rate. It pulled in $8 billion in February alone, the fifth highest total of any fund family. 

Note: The figures in this report were compiled on March 10, 2021, and reflect only the funds that had reported net assets by that date. Artisan had not reported. Morningstar Direct clients can download the full report here.

© 2021 Morningstar, Inc.

Honorable Mention

Retirement assets total $34.9 trillion in 4Q2020: ICI

Total US retirement assets were $34.9 trillion as of December 31, 2020, up 7.5 percent from September and up 9.3 percent for the year. Retirement assets accounted for 33 percent of all household financial assets in the United States at the end of December 2020, according to the Investment Company Institute’s latest quarterly report.

Assets in individual retirement accounts (IRAs) totaled $12.2 trillion at the end of the fourth quarter of 2020, an increase of 9.1 percent from the end of the third quarter of 2020. Defined contribution (DC) plan assets were $9.6 trillion at the end of the fourth quarter, up 6.8 percent from September 30, 2020. Government defined benefit (DB) plans— including federal, state, and local government plans—held $7.1 trillion in assets as of the end of December 2020, a 7.6 percent increase from the end of September 2020. Private-sector DB plans held $3.4 trillion in assets at the end of the fourth quarter of 2020, and annuity reserves outside of retirement accounts accounted for another $2.5 trillion.

Americans held $9.6 trillion in all employer-based DC retirement plans on December 31, 2020, of which $6.7 trillion was held in 401(k) plans. In addition to 401(k) plans, at the end of the fourth quarter, $600 billion was held in other private-sector DC plans, $1.2 trillion in 403(b) plans, $384 billion in 457 plans, and $739 billion in the Federal Employees Retirement System’s Thrift Savings Plan (TSP).

Mutual funds managed $4.4 trillion, or 66 percent, of assets held in 401(k) plans at the end of December 2020. With $2.6 trillion, equity funds were the most common type of funds held in 401(k) plans, followed by $1.2 trillion in hybrid funds, which include target date funds.

IRAs held $12.2 trillion in assets at the end of the fourth quarter of 2020. Forty-five percent of IRA assets, or $5.5 trillion, was invested in mutual funds. With $3.1 trillion, equity funds were the most common type of funds held in IRAs, followed by $1.1 trillion in hybrid funds.

Retirement entitlements include both retirement assets and the unfunded liabilities of DB plans. Under a DB plan, employees accrue benefits to which they are legally entitled and which represent assets to US households and liabilities to plans. To the extent that pension plan assets are insufficient to cover accrued benefit entitlements, a DB pension plan has a claim on the plan sponsor.

As of December 31, 2020, total US retirement entitlements were $40.6 trillion, including $34.9 trillion of retirement assets and another $5.8 trillion of unfunded liabilities. Including both retirement assets and unfunded liabilities, retirement entitlements accounted for 39 percent of the financial assets of all US households at the end of December.

Unfunded liabilities are a larger issue for government DB plans than for private-sector DB plans. As of the end of the fourth quarter of 2020, unfunded liabilities were 44 percent of benefit entitlements for both state and local government and federal government DB plans, compared with only 4 percent of benefit entitlements for private-sector DB plans.

Jasmine Jirele succeeds Walter White as CEO of Allianz Life

Jasmine Jirele has been named president and CEO of Allianz Life, effective September 1, 2021, subject to independent auditor and regulatory filings, the company announced this week. She will succeed Walter White, who will step down on that date and retire December 31, 2021.

Jirele has been Allianz Life’s chief growth officer since 2018, with responsibilities for expanding into new markets, where she has been responsible for product innovation, marketing, communications, and Allianz Ventures.

Prior to re-joining Allianz Life in 2018, Jirele was an executive vice president within Wells Fargo’s Consumer Bank division, and was previously a senior vice president in Wells Fargo’s Wealth and Investment Management division.

She also held various leadership roles in marketing, product innovation and operations at Allianz Life. Jirele holds a B.A. in business and journalism from the University of St. Thomas and an MBA from Hamline University. 

White will be nominated to serve as an independent director on the Allianz Life Insurance Company of North America Board of Directors. 

NY Life 2020 numbers include more than $13.7bn in annuity sales

New York Life, the largest US mutual life insurance company, released 2020 results this week, reporting a record $27 billion in surplus, $702 billion in assets under management, $1.1 trillion in individual life insurance in force in the US and $12.5 billion in total dividends and benefits paid to policy owners and their beneficiaries.

In 2020, New York Life declared $1.8 billion in dividends to eligible participating policy owners in 2021, its second largest payout in company history, according to a release. It also reported life insurance sales of $1.2 billion, annuity sales of over $13.7 billion, and $2.3 billion in operating earnings.

New York Life also completed its largest acquisition ever, acquiring Cigna’s group life and disability insurance business. It is now rebranded New York Life Group Benefit Solutions. The $6.3 billion acquisition added about 3,000 employees and over nine million customers to New York Life, placing it among the top five insurers in the group life and disability insurance businesses.

The four major financial rating agencies renewed New York Life financial strength ratings, giving it the highest ratings currently awarded to any US life insurer and making the company one of only two in the industry to achieve this standard out of the 800 life insurers operating in the US today, the release said.

C-level management changes at Voya

Voya Financial is updating its operating model, which focuses on retirement plans, employee benefits, and investment management, and its leadership team, according to an announcement this week by chairman and CEO Rodney O. Martin, Jr.   

New vice chair roles

Michael Smith will serve as vice chairman in addition to his role as chief financial officer and leader of Voya’s Finance and Risk areas. Smith has expanded responsibilities for technology, data science, transformation, continuous improvement, procurement, sourcing and supplier management, and real estate.

Michael Katz, Voya’s chief strategy, planning and investor relations officer, and Santhosh Keshavan, Voya’s chief information officer, will join Voya’s executive committee.

Charles Nelson will serve as vice chairman and chief growth officer, with responsibility for growing Voya’s current base of more than 13 million individual and institutional customers and approximately 55,000 employers. He will oversee sales and distribution, relationship management, health and wealth marketing and customer solutions.

William Harmon will assume a new role as Voya’s chief client officer, leading the health and wealth sales, distribution and relationship management teams.

New CEOs of Health and Wealth Solutions

Heather Lavallee, currently president of Retirement Tax-Exempt Markets, will become CEO of Wealth Solutions.

Robert Grubka, who currently serves as president of Employee Benefits, will become CEO, Health Solutions.

Grubka and Lavallee will join Voya’s executive committee. They will collaborate with Christine Hurtsellers, CEO of Investment Management, on enterprise business growth.

Voya Financial, Inc. (NYSE: VOYA), a Fortune 500 company, serves about 14.8 million individual customers, workplace participants and institutions in the United States. In 2020, it had $7.6 billion in revenue. The company had $700 billion in total assets under management and administration as of Dec. 31, 2020. 

© 2021 RIJ Publishing LLC. All rights reserved.
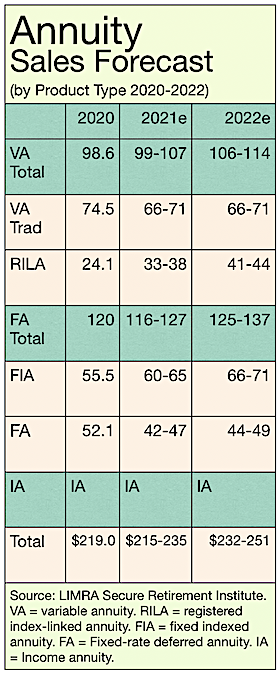
Social Security Repair Bills, Compared by Actuaries

At the American Academy of Actuaries’ (AAA) website, you can tackle the Social Security funding problem by playing a video game. I solved the problem by reducing the cost-of-living-adjustment by 0.7%, raising the level of income subject to the payroll tax, and hiking the combined employer/employee contribution to 14.8%.

Crisis averted.

As we all know, fixing Social Security is a task that either the Biden administration or its successors must face if the OASI (Old Age and Survivors Insurance) program is to avoid a big problem in the early 2030s. That’s when the program’s reserves or “trust fund” is expected to zero out and expected payroll tax revenue will fall short of earned benefits by about 25%.

In a webinar this week, a panel of Academy actuaries presented their analysis of three legislative proposals now floating inside the Beltway: The Bipartisan Policy Center proposal of 2016, the 2016 Johnson Proposal (after Rep. Sam Johnson, then-head of the House Social Security Subcommittee), and the 2019 Larson-Blumenthal-Van Hollen proposal. They also reviewed the 2020 Biden campaign proposal for Social Security.

The panelists, Amy Kemp, Janet Barr and Ron Gebhardtsbauer (led by moderator Linda K. Stone) tested the proposals, in effect, for their impact on two opposing principles that Social Security since its founding has tried to balance: the “individual equity” of the program and its “social adequacy.”

From ‘The Social Security Game’

Those two expressions are social science terms for, respectively, the degree to which the program is financially fair (giving all taxpayers a reasonable benefit bang for their payroll tax buck) and to which it pays enough even at the low end to keep elderly Americans out of poverty—assuming at the same time that it pays for itself with the employer/employee FICA tax, currently 12.4%.

The AAA chose to consider only reform proposals that closed Social Security’s projected long-term funding shortfall and that kept the program in the form of a PAYGO (pay-as-you-go) defined benefit pension. They didn’t entertain proposals that would convert Social Security to a defined contribution plan with individual accounts, as was suggested by a presidential commission during the early 2000s. 

The Bipartisan Policy Center (BPC) proposal: Mild tax hike, higher retirement age 
  • The minimum benefit would be $726 for an unmarried beneficiary, reduced by 70 cents for each dollar of earned benefit.
  • The normal retirement age would increase by one month every two years starting in 2022 until reaching 69 for those reaching age 62 in 2070.
  • Annual benefit increases would be pegged to the “chained CPI,” rather than the Consumer Price Index.
  • The spousal benefit, now at least one-half the primary worker’s benefit, would change to one-half the benefit of a worker with career earnings at the 75th percentile.
  • A worker’s widow or widower would no longer receive at least 100% of the deceased worker’s benefit but instead receive 75% of that benefit plus his or her own earned benefit.
  • The taxable wage base would gradually increase to $203,700 in 2021, with annual increases according to the national average wage index plus half a percentage point thereafter.
  • The BPC proposal would increase the 12.4% payroll tax gradually until it reaches 13.4% in 2026.
  • Eliminate the 15% exclusion starting in 2022 for single taxpayers with incomes over $250,000 and married taxpayers with incomes over $500,000, so that 100% of benefits would be taxable.
The Johnson proposal: No payroll tax increase
  • Provide a significant benefit increase for the lowest-paid workers, but a significant benefit reduction for those at the high end of the earnings spectrum.
  • Increase the NRA (normal retirement age) by three months every year starting in 2023, until it reaches age 69 in 2030
  • Eliminate the cost-of-living adjustment (COLA) for high-income beneficiaries and adopt the chained CPI for other beneficiaries.
  • Limit the spousal benefit to the amount based on one-half the PIA (“primary insurance amount” or benefit) of a hypothetical worker of the same age, whose earnings equaled the national average wage in all years. The benefits of widows and widowers wouldn’t change.
  • The minimum benefit would be a percentage of the national average wage two years before the person became eligible for benefits. The percentage would be based on a worker’s years of work.
  • Between 2045 and 2053, the thresholds [of earned income] for taxation of benefits would be increased by $7,500 per year for singles and $15,000 per year for couples. In 2054 the tax would be eliminated.
  • Provide a benefit increase to low-income beneficiaries after 20 years of retirement.   
The Larson proposal: Higher tax rates on the wealthy
  • Raise all benefits by making the calculation formula slightly richer.
  • Use the Consumer Price Index for the Elderly (CPI-E) for annual inflation adjustments.
  • Set the minimum monthly benefit for workers with at least 30 years (120 quarters) of covered employment at one-twelfth of 125% of the annual poverty guideline for single persons.
  • Raise these income thresholds for paying taxes on Social Security benefits to $50,000 for singles and $100,000 for couples, so that fewer beneficiaries would pay income tax on their Social Security benefits.
  • Apply the payroll tax rate to earnings in excess of $400,000.
  • Increase the combined employer/employee payroll tax rate by 0.1 percentage point each year until it reaches 14.8% in 2043.
The Biden campaign proposal 

During his 2020 presidential campaign, Joe Biden floated a plan for reforming Social Security. The plan maintained the PAYGO structure but did not raise enough revenue to close the program’s funding gap. Like the Larson proposal, it applied the payroll tax to incomes in over $400,000, but not to taxable incomes between the FICA limit and $400,000—creating a “doughnut hole.”

Biden proposed a minimum benefit at the low end and a five percent increase in benefits after 20 years of retirement. It did not raise benefits for those making more than $400,000 a year, even though it would make them liable for increased taxes. As the panelists pointed out, the Biden campaign plan hasn’t resurfaced as an actual legislative proposal, and probably won’t.

The report leaves the strong impression that Social Security isn’t in crisis, and isn’t in danger of “failing.” (If taxpayers really believed that, they would probably rebel against the withholding of payroll taxes.) All it needs is a few tweaks. Politically, it’s still a high-voltage “third rail” of American politics. For Republicans, the third rail is raising taxes. For Democrats, the third rail is cutting benefits. Finding a third way through the middle may prove difficult.

© 2021 RIJ Publishing LLC. All rights reserved.

Stimulus Money and Mobius Strips

On the evening news programs, the talking heads always stress the first syllable of the word trillion when reporting on the Biden stimulus.

“One point nine TRI-llion dollars,” they say, in exactly the same way that they used to say, “One BIL-lion dollars,” and the way that Doctor Evil of the Austin Powers films said, “One MIL-lion dollars,” as he raised his pinkie.

As if a trillion dollars were a lot of money.

Where does all this digital greenery come from, and where does it go? Will it cause hyper-inflation”? Will it require tax increases? Will it crush our grandchildren? Why doesn’t the financial system crash under its own weight, like a substandard apartment building in an earthquake zone?

Everyone wants to know. Here are the answers:

The money comes from the country’s infinite well of credit. Yes, the easy money will inflate the prices of houses and stocks. Yes, the profits it creates will be partly taxed away, as a check on inflation. Yes, our grandchildren will pay the debt back—but only as it comes due, as we always have.

There’s a reason why the system doesn’t crash. The banks (by design) will always accommodate the US Treasury’s need for cash by buying its bonds, and the Fed (by design) will always accommodate the banks’ need for cash by buying back the bonds they bought from the Treasury.

As an analogy, consider the Möbius strip, a topological oddity. Imagine a belt with a half-twist in it, which creates one continuous surface out of what had been an inside surface and an outside surface (See below). When an object moves along the continuous surface, as in this video, it reaches a point where it flips into a mirror-image of itself. On the next circuit, it flips back again. It can travel that roller-coaster indefinitely.

Treasury debt and US dollars (Federal Reserve notes) are mirror images of each other. And their circuit runs through the banking system, where their identity flips back and forth in an infinite and scalable process. (You can see the flip below. Note how the vectors reverse direction.)

In theory, there’s no end to a Möbius strip, or to the ability of the Fed, the Treasury, and the banks to turn money into risk-free debt and risk-free debt into money. When those $1,400 Treasury checks hit household bank accounts they will add to the reserves in the banking system, which the banks can use to cover their outlays or to buy Treasuries.

What about those commercial banks? They have their own knitting to stick to. They loan money to borrowers with varying creditworthiness at varying levels of interest. The money they advance (out of thin air) is credit-money; they earn interest on the advance until the borrower pays it back. When the borrower returns the money, the credit-money and the loan disappear.

It’s true that, whenever a borrower writes a check to someone at another bank, the first bank has to fund the transfer with reserves; it gets those reserves back when a loan is repaid. But the banks as a rule can create much more credit-money than they have reserves in the vault or at the Fed. (That’s the “alchemy” of banking.)

There’s a lot of credit money floating out there in the economy. According to FRED (Federal Reserve Economic Research) at the St. Louis Fed, the banks have $15.25 TRI-llion in outstanding credit. Those are loans they’ve created, and earn interest on, but that the borrowers haven’t paid back yet. 

Let’s say a Black Swan event occurred—a pandemic and a recession, or an alien invasion—and thousands of businesses and millions of Americans were unable to make payments on their loans. If the aggregate shortfall to the banks were, say, $400 billion, the banks and other creditors would face a big liquidity shortage.  

Enter the Fed or the Treasury. Suppose that Congress instructed the Treasury to borrow $400 billion and put it into Americans’ bank accounts so they can make their loan payments and pay their bills. Solvency is restored. But what about the $400 billion in reserves that the banks paid to finance the Treasury’s deficit spending?

The banks can get the money back, either by selling the Treasuries they purchased to the Fed or borrowing against them at the Fed. Had there been no stimulus, the banks could still borrow the liquidity they need from the Fed—assuming they can post high-quality assets as collateral.

People balk at suggestions that the government drives the economy, and they should. It doesn’t. What drives the economy is the fact that 160 million Americans get out of bed, shower, put on decent clothes, and go to “work” every day so they can extinguish the loans that banks and credit card companies have advanced to them.

If a Black Swan interrupts the repayment of credit-money, as one did in September 2008 and again in March 2020, a giant money crevasse can open up beneath the financial system’s feet. Given the vastness of the banks’ credit advances ($15.25 TRI-llion), you can see how easily that crevasse might swallow a trillion dollars or two.

Part of the Biden stimulus will help fill or patch that crevasse. Much of it will probably pay off debt and disappear, which may explain why Americans won’t be pushing wheelbarrows full of banknotes through the streets. If the crevasse yawns too wide and too deep—and vital companies like GM or Boeing start sliding into it—no amount of Treasury debt or Fed money-printing could patch it over or fill it back up. Fortunately, we’re not there yet.   

© 2021 RIJ Publishing LLC. All rights reserved.

How Biden Might Pay for Expenditures

We all win when the rich pay higher taxes, don’t we? Jeff Bezos or Mark Zuckerberg surely wouldn’t miss a billion or two. With another trillion in revenue, Uncle Sam wouldn’t have to sell as many bonds. Everyone’s money would be worth more, since federal taxes reduce inflation. It’s a win-win-win.

Are those statements true? Neo-classical macroeconomists would probably say they aren’t. But the Biden administration seems to be thinking along those lines. Liberal policymakers are talking about several new taxes. (There are no conservative policymakers; conservatives don’t believe government should “make policy.”)

Kerry Pechter

We know about the Biden plan to apply the payroll tax to incomes over $400,000. There’s also the Elizabeth Warren’s ultra-millionaire tax, the 10-basis-point financial transactions tax, and the Biden idea for converting tax deferral on retirement plan contributions to tax credits. Let’s consider them.

The Ultra-Millionaire Tax Act of 2021 (The “Wealth Tax”) would take two percent (2%) of a person’s assets worth in excess of $50 million each year and three percent (3%) of assets worth over $1 billion. The US would levy a six percent (6%) tax on assets over $1 billion if Congress creates a universal health care program. This tax would reach beyond income and reach most assets, with some exceptions.

The value of yachts, aircraft, mobile homes, trailers, cars, antiques or other illiquid collectibles worth less than $50,000 would not count toward the $50 million. The IRS would audit no less than 30% of the affected taxpayers every year. The bill would also give the IRS $70,000,000,000 a year for 10 years (2022 to 2032) for enforcement and another $30,000,000,000 a year for taxpayer services and business modernization. (I’m checking to see if those numbers were misprints in the bill. That would give the IRS $1 trillion over 10 years.)

According to an analysis by University of California-Berkeley economists Emmanuel Saez and Gabriel Zucman, “about 100,000 American families (less than one out of 1000 families) would be liable for the wealth tax in 2023 and that the tax would raise around $3.0 trillion over the ten-year budget window 2023-2032, of which $0.4 trillion would come from the billionaire 1% surtax.”

For a Bezos or a Zuckerberg, who sit on snow-capped Everests of appreciated stock, a 2% ultra-wealth tax would presumably force them to liquidate part of their holdings. It’s not clear how such sales might affect the market price of their stocks.

A financial transactions tax (FTT), most recently embodied in H.R. 328, also introduced in the 117th Congress, proposes a 10-basis-point tax (0.1%) on transactions involving stocks, bonds, futures, options swaps, and credit default swaps. Such a tax has been proposed in at least the past five Congresses, since the 2008-2009 financial crisis.

The FTT would aim at putting a speed bump in the path of various kinds of high frequency trading. The Joint Committee on Taxation estimated in 2020 that a prior proposal similar to H.R. 328 would generate $751.9 billion in revenue over 10 years. A February 23 study by the Congressional Research Service suggested that the bill might not stop all types or aspects of high frequency trading and that traders might invent ways to avoid it. 

The tax was discussed during a hearing this week of the Senate Banking, Housing and Urban Affairs committee, during a discussion involving the role of high-frequency trading, and of trading apps on phones used by minors, and the trading of GameStop shares, and the possible need for new regulation to prevent more such events. 

Of five panelists testifying, three—Gina-Gail S. Fletcher of the Duke University Law School, Teresa Ghilarducci of The New School and Rachel Robasciotti of Adasina Social Capital recommended it. The two others, Michael Piwowar, a former SEC commissioner, and Andrew Vollmer of the Mercatus Center, opposed new regulation.

Replace current tax deductions for retirement savings contributions with a refundable tax credits. As a candidate for the White House in 2020, President Biden unveiled a host of ideas for changing the tax system. Most of the ideas would raise taxes on the wealthiest or high-earning Americans (e.g., less than 2% of Americans earn more than $400,000 a year) and redistribute wealth down the income spectrum.

One of Biden’s proposals would replace a deduction (or income exemption) for contributions to traditional individual retirement accounts (IRAs) and defined-contribution pension plans with a refundable tax credit. The tax expenditure (tax forgone by tax deferral) for retirement savings was about $250 billion in 2019 and, if nothing changes, will be about $1.5 trillion over the 2019-2023 time frame, according to the Tax Policy Center.

Progressives point out that most of the benefits of tax deferral accrues to the wealthy, since they have the greatest capacity to save, save the most, and are in the highest tax brackets. When middle income people save in retirement accounts, the tax benefit of doing so is smaller. Switching to a tax credit could give a bigger incentive to the middle-class to save.

The retirement industry, as represented, for instance, by the American Retirement Association and the Investment Company Institute (ICI), can be expected to lobby heavily against any threat to current incentives of tax deferral, which has helped attract trillions of dollars into retirement accounts ($20.6 trillion in assets as of 6/30/2020), according to the ICI. 

Facing the inevitable

People tend to accept taxes that bring them tangible benefits, but resent taxes that don’t. Parents with children don’t mind school taxes, but empty-nesters do. Some people see taxes as theft by government, others as the price we pay for civilization. Some believe that getting rid of government would mean more money for everybody. Others believe that getting rid of government would mean no money for anybody, given that the federal government has a monopoly on issuing US money.

Do taxes reduce inflation? That depends. At the local and state level, you pay taxes, the money goes into an account, and government employees and contractors get paid. Ideally, they spend some their wages locally. At the federal level, I’m told, taxes involve a different process.

When it spends (Social Security benefits, for instance), the Treasury credits your bank account. When it taxes, it debits your bank account. The big difference is that the Treasury, unlike a state or county or individual, can spend before it taxes or borrows. Then it destroys the money it collects in taxes—thus reducing inflation. Don’t ask me exactly how or why. That’s above my tax bracket.

© 2021 RIJ Publishing LLC. All rights reserved.

New products bulletin

Nationwide and Annexus partner on income-generating FIA

Nationwide is partnering with Annexus, the prominent independent designer of fixed indexed annuities (FIAs), to issue Nationwide New Heights Select, which is built “on the foundation of 2020 top-selling income FIA with a guaranteed roll-up.”

Nationwide New Heights Select offers two new indices, new bucketing capabilities for greater diversification, competitive accumulation opportunities, and increased lifetime income payout percentages on one of the optional income riders, the companies said in a release.

The contract offers options that track the performance of an index and lock in earnings at the end of each strategy term. New bucketing capabilities allow a clients’ contract value to be allocated among up to five strategy options, including two new indices.

The SG Macro Compass Index, which uses the current economic outlook to determine its asset allocation, is available on the product. It can “adapt to current market conditions by pivoting and leaning into growth assets when markets are bullish and defensive assets when markets are bearish,” the release said.

The methodology leverages the expertise of Societe Generale’s Quantitative Research team. It is rooted in the academic research of macroeconomic regimes created by Dr. Solomon Tadesse.

Nationwide New Heights Select has also added the NYSE Zebra Edge II Index, based on a methodology developed by economist Roger G. Ibbotson and his team at Zebra Capital Management, and founded on Ibbotson’s behavioral finance research. It uses his behavioral finance filtering process to evaluate the 500 largest publicly traded companies in the United States each quarter, and then remove the riskiest and most volatile companies to identify equities with the potential for higher returns with less risk.

Nationwide New Heights Select offers two optional living benefit riders available for an additional charge, to create a source of guaranteed income for life. The Nationwide High Point 365 Select Lifetime Income rider with Bonus now offers higher lifetime payout percentages with the flexibility for earlier withdrawals.

It includes a bonus of 10% of a client’s purchase payment added to their Minimum Income Benefit Value at contract issue. In addition, the Minimum Income Benefit Value will continue to grow daily at a 7% compound annual rate until the earlier of 10 years or until beginning lifetime income withdrawals, whichever comes first. By year 10, the Minimum Income Benefit Value is guaranteed to at least double. 

Equitable extends RILA feature to variable annuity

Equitable, which invented the registered index-linked annuity (RILA) 10 years ago, has enhanced its Investment Edge tax-deferred variable annuity to include an investment choice with a downside buffer similar to the one on Equitable’s Structured Capital Strategies RILA.

This “segment-based investment approach will track a well-known benchmark index of the client’s choosing,” an Equitable release said. Clients experience the growth of that index up to a performance cap rate, with protection against the first 10% of potential losses, less the contract fee.

Clients can select either a Standard Segment which measures investment performance over a one-year term, or the Step Up Segment which guarantees a return equal to the Performance Cap Rate, less the contract fee, if the index performance is equal to or greater than zero when the Segment matures. Clients can transfer out of, or between, the two Segment options at any time.

Investment Edge also includes two other choices for investing:

– Preset portfolios consisting of either investments selected by well-known managers, or risk-based portfolios that create a diversified asset-allocation.

– Option to build a diversified portfolio of investments from more than 100 investment options, including core U.S. and international equity options and alternative investments

Interactive retirement education and detailed product information for Equitable Financial’s individual retirement annuities is available through its online Retirement Guide.

The latest version of Investment Edge also gives clients a return-of-premium death benefit. The contract can be used as an investment vehicle for inherited IRA contracts.

Securian offers new IOVA

Securian Financial has introduced MultiOption Momentum, an investment-only variable annuity (IOVA) offering both indexed and variable investment options in a tax-deferred, variable annuity.

The contracts are issued by Minnesota Life Insurance Company.

“MultiOption Momentum is our first IOVA. It provides customization, flexibility and the ability to build risk hedge,” said Chris Owens, Securian Financial’s national sales vice president for retail life insurance and annuities, in a release.

IOVAs allow investors to set aside taxable assets in a tax-deferred instrument focused only on investment. With MultiOption Momentum, investors and customize the product to meet their needs with optional benefits for an additional cost.

Key MultiOption Momentum product features include more than 70 variable investment options, two indexed account options and one guaranteed interest account option.

MultiOption Momentum is available to all Securian Financial-approved distribution channels.

Honorable Mention

Biden DOL won’t enforce Trump’s anti-ESG rule

The Department of Labor issued a notice yesterday saying, “Until it publishes further guidance, the Department will not enforce either final rule or otherwise pursue enforcement actions against any plan fiduciary based on a failure to comply with those final rules with respect to an investment, including a Qualified Default Investment Alternative, or investment course of action or with respect to an exercise of shareholder rights.”

The notice referred to “Financial Factors in Selecting Plan Investments,” 85 Fed. Reg. 72846 (November 13, 2020), which adopted amendments to the “Investment Duties” regulation under Title I of the Employee Retirement Income Security Act of 1974 (ERISA). The amendments generally require plan fiduciaries to select investments and investment courses of action based solely on consideration of “pecuniary factors.”

In yesterday’s notice, the Biden DOL said it “heard from stakeholders that the rules, and investor confusion about the rules, have already had a chilling effect on appropriate integration of ESG factors in investment decisions, including in circumstances that the rules can be read to explicitly allow. Accordingly, the Department intends to revisit the rules.”

PEP rally: TAG Advisors launches Pooled Employer Plan

TAG Advisors, a branch of Cambridge Investment Research, Inc., has launched a Pooled Employer Plan (PEP) with Voya Financial, Inc. serving as the PEP’s recordkeeper. The plan went into effect on Feb. 1, 2021.

The TAG(k) PEP is “one of the first of its kind in the independent broker-dealer space.” a company release said. The PEP is available to all independent financial professionals affiliated with TAG Advisors, along with clients who seek less fiduciary liability and the pricing advantage associated with aggregating plan assets.

The TAG(k) PEP will use Plan Compliance Services, Inc., an affiliate of The Platinum 401k, Inc., as the pooled plan provider for the program. “TAG Advisors sees the benefit of having a ‘private label’ PEP to market through their distribution network,” said Terry Power, president of the Platinum 401k, in a release.

The PEP will market to pre-existing 401(k) plans with assets of $2 million to $50 million, which may currently feel burdened by undergoing an annual plan audit as part of their Form 5500 submission. TAG Advisors selected Voya to serve as the PEP’s recordkeeper. For more than 40 years, Voya currently serves has approximately 13.8 million individual and institutional customers in the US.

“We are pleased to be one of the first firms of our type in the country to offer a custom-branded Pooled Employer Plan to our clients,” said Greg Raines, CEO of TAG Advisors.

PEPs were enabled by the Setting Every Community Up for Retirement Enhancement (SECURE) Act, a bill enacted in December 2019. Under the Act, pooled plan providers began operating in January 2021, allowing retirement plan service providers to offer a single 401(k) plan, and ending the requirement that single plans had to be sponsored by single employers.

Some sponsors of the Act hoped it would bring 401(k) plans to small companies that had never had a retirement plan of their own because of the paperwork and complexity involved. But PEP providers appear to be marketing to existing plans. That’s logical, because companies with no plans have no assets to manage, at least at first.

As a branch of Cambridge Investment Research, Inc., TAG Advisors supports more than 300 advisers in 29 states. 

Net income for life/annuity industry fell 55% in first three-quarters of 2020: AM Best

While the sales process remains a challenge, most rated US life/annuity (L/A) insurance companies have remained well-capitalized during the pandemic to date, and have benefited from favorable mortality and morbidity experience, low credit impairments and rebounding equity markets, according to AM Best’s annual Review & Preview market segment report.

Net income for the L/A industry in the nine-month 2020 period fell by 55% from the same period of 2019, to $13.2 billion. Absolute capital and surplus (C&S) for the segment grew by approximately 5% through Sept. 30, 2020, from the prior-year period, said the new report, “US Life/Annuity Industry Weathers the Pandemic Well in 2020.” 

The segment benefited from positive, albeit significantly lower, earnings and a change in unrealized capital gains. Low interest rates and L/A carriers’ desire to hold more liquidity during the pandemic drove an increase in debt issuance, as companies took advantage of the opportunity to refinance older issues that had been priced at higher interest rates.

Debt issuance for the L/A carriers amounted to nearly $35 billion through September 2020, significantly higher than the approximately $20 billion through September 2019.

Offsetting the ongoing macroeconomic challenges that L/A insurers face are favorable underwriting and evolving risk management practices, including the use of hedges, adjustments to crediting and discount rates, and a focus on technology to improve sales.

Still, the industry has been facing the challenge of adapting to the remote work environment while converting to virtual sales practices during a period where a COVID-19-fueled spike in unemployment has been a drag on demand, despite a renewed interest in the need for life insurance on the part of consumers.

While companies in this market segment will need to focus a significant amount of attention to mitigating these risks and others, the report notes that they can ill-afford to allocate resources to strictly defensive initiatives, if they are to survive and grow over the long term.

In 2021, leveraging capabilities developed to support remote work and sales environments during the pandemic in order to better position their business models for top-line growth will be critical. A flurry of merger and acquisition announcements in early 2021 reinforces AM Best’s expectations that the L/A segment will remain heavily focused on interest rate risk amid declining interest margins.

Luma platform will use FireLight annuity sales technology

Luma Financial Technologies, an independent, multi-issuer structured products and annuities platform, will use the FireLight insurance and retirement sales platform provided by Insurance Technologies, LLC, to bring its Luma Annuities solution to market.

The Luma platform is intended to simplify the structured product investment process. A global fintech firm in the structured products space, Luma is betting that market volatility and the low interest rate environment and the prospect of market volatility will continue to drive interest in annuities.

Luma Annuities is a turn-key annuity sales and lifecycle management solution for advisers.  It simplifies all aspects of learning, transacting, configuring, and managing annuities for investment firms and advisors that sell income-generating products.

The Luma platform was created in 2011 by Luma Financial Technologies to help financial teams study, create, order and manage market-linked investments such as structured products and structured annuities. Broker/dealer firms, RIA offices and private banks use Luma to automate the full process cycle for offering and transacting in market-linked investments, including education and certification; creation and pricing of custom structures; order entry; and post-trade actions. 

SEI Wealth Platform to offer Income Conductor income planning tool

WealthConductor LLC, a fintech company, announced that its Income Conductor retirement income planning software is now available with the SEI Wealth Platform for use by independent advisers who use the platform.

IncomeConductor uses a time-segmented strategy developed by co-founder Phil Lubinski CFP, and provides financial professionals the ability to create customized plans for their clients, implement with products of their choice, and track and manage those plans efficiently and compliantly throughout long retirement horizons.

Advisors can automatically pull in daily account and position values regardless of location through direct and open architecture integration options, providing daily plan performance, segment analytics and automated alerts that help advisors protect their clients’ income.

This service is now available to mutual clients of the Platform and IncomeConductor, including advisors that use SEI’s Managed Account Solutions and Unified Managed Account capabilities.

David Lacusky appointed to senior sales position at Global Atlantic

Global Atlantic Financial Group has appointed David Lacusky as senior vice president and director of Strategy & Internal Sales for Individual Markets. He will report to Sam Barnett, Global Atlantic’s head of sales.

Lacusky will be responsible for defining engagement strategies, as well as developing a strategy to use technology, data and analytics in the sales process for both annuities and life insurance. He will also engage with partner firms’ sales desks and wholesaling teams to improve the sales experience.

Prior to joining Global Atlantic, Lacusky served as senior vice president and chief sales officer of retirement and investments at Stadion Money Management. Before that, he spent 15 years with The Hartford, where he held sales leadership positions, including head of sales office and national sales manager for annuities, as well as chief distribution officer for Hartford Japan.

On February 1, 2021, Global Atlantic became a majority-owned subsidiary of KKR, a leading global investment firm that offers asset management and capital markets solutions across multiple strategies.

© 2021 RIJ Publishing LLC. All rights reserved.