How Participants & Asset Managers Lose 401(k) Assets


IssueM Articles

The Fed has positioned itself in such a way that its next move seems obvious and that it will ease policy further by some means sooner than later—with sooner being the December FOMC meeting. Expectations are moving in the direction of the Fed shifting asset purchases toward the longer end of the curve. Not to be outdone, some shops are expecting the Fed to increase the pace of asset purchases.
I have some nagging doubts about this narrative. Here I am going to outline those doubts and hopefully provide some context. Six facts are central elements to the growing narrative:
The path from those acts to some type of action at the December meeting seems straightforward. So what’s eating at me?
First, I don’t know entirely how to interpret Powell’s dovishness. I think he is rightly concerned that showing optimism will lead market participants to erroneously conclude that the Fed is closer than expected to hiking rates. He is genuinely committed to sustained accommodative monetary policy. Even if the US recovery remains intact this winter, the economy will still be in a hole with high unemployment. I don’t think he wants to blunder into a “taper tantrum” and slow progress toward the Fed’s goal.
That said, if Powell is concerned about inequality or long-term labor market damage, why hasn’t he pushed his colleagues into expanding the pace of asset purchases? The situation now is no different from two or three months ago. I can only conclude that he views monetary policy as a poor substitute for fiscal policy at this point.
When Powell says the Fed has reviewed the asset purchase program and concluded that it is providing the appropriate amount of accommodation, he may be saying that increasing it will neither accelerate the recovery nor deal with the structural issues that concern the Fed. Why then would they do something in December that they have already concluded won’t help?
While Powell may be suppressing optimism, Clarida let the optimism fly as he revealed that the good news on the vaccine gave him
“…more conviction in my baseline for next year and more conviction that the recovery from the pandemic shock in the US can be potentially more rapid, potentially much more rapid, than it was from the Global Financial Crisis…there is an enormous quantity of pent-up saving….so you [if] combine the good news on the vaccine with north of a trillion dollars of accumulated saving, then there is a very, very attractive right tail to this distribution.”
Could Powell see more upside risk than he is willing to admit?
Second, the Fed has not identified how the asset purchase program interacts with the Fed’s new strategy. The path of the asset purchase program and its relation to economic outcomes has not been tied down as the path of interest rates has. Powell said this at the November press conference:
EDWARD LAWRENCE. What would cause the Federal Reserve to shift more of its asset purchases towards the long-term securities and Treasuries and change the amount of spending there also? And, if there’s no fiscal stimulus package, would that trigger buying of more long-term assets or change the asset purchases?
CHAIR POWELL. We understand that there are a number of parameters that we have where we can shift the composition, the duration, the size, the life cycle of the program. All of those things are available to us as ways to deliver more accommodation… Right now, we like the amount of accommodation the program is delivering. It will just depend on the facts and circumstances.
What “facts and circumstances” were discussed? We don’t know. We can only assume that the “facts and circumstances” include addressing the negative impacts of a Covid-19 surge, but we don’t know that. Again, it appears the Fed has concluded that changing the asset purchase program would not accelerate the recovery. So why would they believe it could offset fresh pandemic weakness?
One obvious set of “facts and circumstances” would prompt the Fed to alter the asset purchase program: A financial disruption. And that brings me to my third concern. A financial hiccup would get the Fed’s attention and provoke a response. As of yet, however, there has been no financial disruption, despite the surge of cases across the nation.
The financial situation appears very different from this past spring. Then the markets quickly discounted the implications for the economy and stocks crashed while credits markets nearly froze. This time no such thing has occurred. Why? First, this will be “lockdown light.” It will have less significant economic impacts. Second, selling off is foolish because we know there will be a rebound on the other side. Third, market participants are looking through the short-term problems to the long-term solutions.
Whatever the reason, financial markets are not tightening. To be sure, longer term interest rates are edging higher, but that increase could be consistent with improving economic conditions, so it is not readily obvious the Fed would need to push back. This from Clarida was illuminating:
We are buying a lot of Treasuries, we’re buying $80 billion a month, that comparable to the path of QE2 and it’s roughly the duration pull…with long-term yield at historically low levels and below both current and projected inflation, financial conditions are accommodative…not concerned about the rise in Treasury yields and it is still in an accommodative range.
Those were not the words of someone interested in expanding asset purchases or changing the duration of the program to sit on the long end of the curve.
Bottom line: I don’t know that the Fed’s behavior with regard to the asset purchase program to date argues for changing the composition of purchases in response to feared renewed pandemic weakness.
If the Fed believed alterations to the program would affect economic outcomes in the current environment, they should already have changed the program. That outcome, though, seems more likely than expanding the pace of asset purchases.
Another possibility is that the Fed decides to clarify the length of the program to make is consistent with guidance on the interest rate. This seems like an easier call than other options.
The most likely reason to alter the asset purchase program would be to offset a tightening in financial markets. As of yet that doesn’t seem necessary. The upcoming minutes of the November FOMC meeting might reveal new information and the Fed’s discussion of the asset purchase program.
© 2020 Tim Duy.
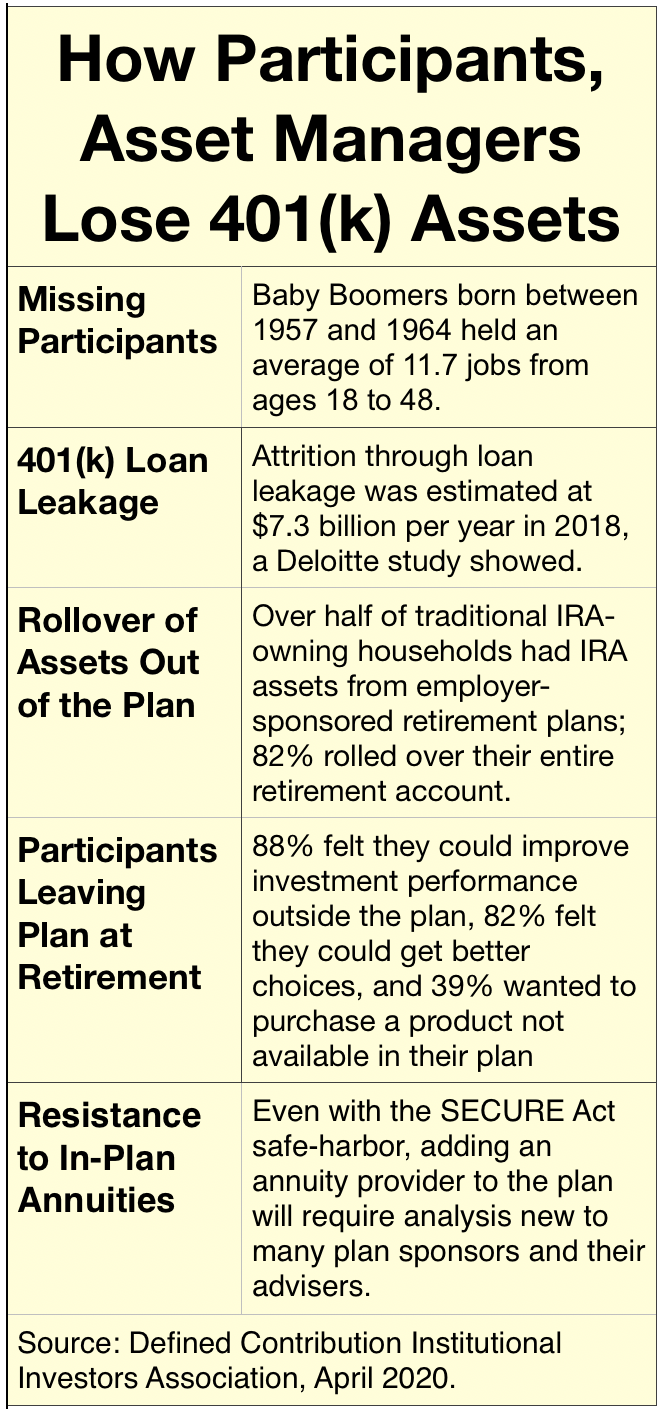
Taking advantage of provisions in the SECURE Act of 2019, Principal Financial Group will roll out a new Pooled Employer Plan (PEP) in 2021, marketing the Principal EASE multiple employer 401(k) plan to a range of employers, from start-ups with as few as 10 workers and to companies with as much as $10 million in existing plans.
Principal EASE will be a packaged 401(k) plan that combines integrated retirement plan administration, customer service and investment management services. Principal will serve as the Pooled Plan Provider (PPP), or oversee of the PEP, while National Benefit Services will be the third-party administrator (TPA) and Wilshire will handle the investments as a 3(38) fiduciary. (The numbers refer to B of the Employee Retirement Income Security Act of 1974, or ERISA.)
Congress created the SECURE Act in part to close the so-called retirement plan “coverage gap,” which refers to the fact that 40% or more of full-time workers in the US are at any given time without a tax-deferred payroll savings plan at work. The gap is especially prominent among small employers without the administration resources needed to sponsor a single-company 401(k) plan.
PEPs are intended to invite dozens or hundreds of small firms into a single turnkey plan that relieves the employer of all but a minor responsibility for selecting a legitimate provider. Principal, which operates 49,000 retirement plans in the US, would presumably fill the bill.
The SECURE Act does not require PEP providers to market only to firms without existing plans or to offer annuity options to participants. Principal plans to offer EASE to existing and prospective clients, and Wilshire will offer Principal’s Pension Builder deferred income annuity as an in-plan investment option.

Joni Tibbetts
“We will make the PEP available to our existing clients,” Joni Tibbetts, vice president of project management at Principal, told RIJ. “But EASE is focused on simplifying the choices for participants, and our existing clients won’t necessarily want to make that kind of change. Principal is indifferent to whether [a current plan client] joins the PEP or not.” In 2019, Principal acquired Wells Fargo’s Institutional Retirement and Trust business, becoming one of the largest retirement plan providers in the US.
Another goal of the SECURE Act was to help small companies enjoy the same high level of services and economies of scale that large companies typically enjoy when obtaining 401(k) services. In the past, small company plan participants often paid higher fees than large company plan participants.
That’s important, because a 1% fee difference over 30 years of saving can reduce a participant’s retirement plan balance by 30%, as behavioral economist Shlomo Benartzi of UCLA has pointed out. Principal is looking to serve firms with prospective annual 401(k) contributions of as little as $50,000. Before the SECURE Act, such firms could find boutique turnkey 401(k) providers or use SIMPLE 401(k)s, but demand for those options has not closed the coverage gap.
Principal declined to say what the EASE fees would be. “While we are unable to share fees for Principal EASE, they will be competitive for the value of the service package that’s being provided,” a Principal spokesperson said.
Principal’s in-plan deferred income annuity (DIA) for 401(k) plans, Pension Builder, will be one of the investment options approved and offered by Wilshire to PEP participants, Tibbetts told RIJ. Each company in the PEP will decide for itself whether to offer Pension Builder to participants or not. The DIA would have “institutional pricing,” she said.
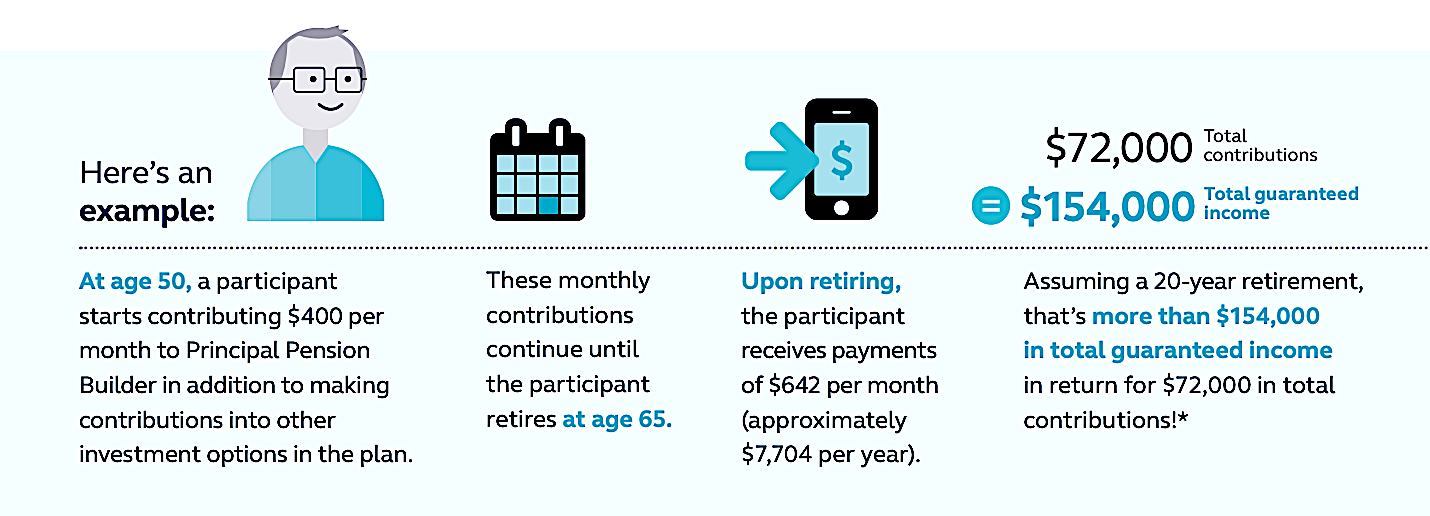
A hypothetical illustration of Pension Builder, from a Principal brochure.
Principal launched Pension Builder five years ago. It is a flexible-premium, unisex-priced, individual deferred income annuity (DIA) contract offered as a stand-alone investment option for plan participants. Contributions to the DIA go into the general account of the life insurance company, in this case Principal Life. Each contribution purchases a discrete amount of guaranteed income for life.
Participants who own Pension Builder contracts can roll them over penalty-free and tax-free if they change jobs, as stipulated by the SECURE Act, and retirees can choose to take lump sums instead of accepting the annuity. There may be surrender charges or value adjustments on lapsed policies, however, according to a PEP brochure.
The fact that Principal is the PPP and that its PEP offers a bundled Principal annuity product doesn’t present a conflict of interest, Tibbetts said. That’s because Principal doesn’t select itself as the annuity provider; Wilshire does. The employer can fulfill its fiduciary burden by following the requirements of the optional “safe harbor” procedure for annuity selection outlined in the SECURE Act. The employer also relies on the recommendations of the 3(38) fiduciary, Wilshire.
Principal offers this disclosure in its press release: “Wilshire and National Benefits Service are not an affiliate of any member of the Principal Financial Group. The decision to delegate to and ongoing monitoring of the Pooled Plan Provider (PPP) and 3(38) investment manager is the fiduciary responsibility of the adopting employer.”
Tibbetts has a clear mental image of the ideal small-business candidate for the Principal PEP: Her cousin the woodworker. “My cousin is a cabinetmaker,” she told RIJ. “He has a group of about 20 employees. I brought up the subject of PEPs with him and his wife at a family function. And when I testified about RESA [an early version of the SECURE Act] on the Hill I used them as an example of our target client.”
© 2020 RIJ Publishing LLC. All rights reserved.

© 2020 Steve Parrish. Used by permission.

Can cash value life insurance provide a useful retirement income supplement? It depends on whom you ask. Thirty years ago, I purchased a high cash value whole life policy, using my annual bonus to pay each year’s premium. When I reached retirement age, I made a tax-free exchange of the policy values into an immediate annuity that pays out a lifetime income for me and my wife.
But it doesn’t necessarily work for everyone. I met a physician recently who complained that an agent had sold him a “basket full of whole life policies” to generate tax-free income in retirement. The agent vanished, so the doctor surrendered the policies, paying a hefty tax on the gain.
There was a big difference between my situation and the physician’s, however. My policy was part of a retirement plan. His resulted from a life insurance sale with apparently little follow-up. Too often, life insurance is merely a sales idea with no real follow-up once the policy is delivered. Life insurance as a retirement strategy requires ongoing communication and administration.
While most retirees use life insurance for its death benefit, cash value life insurance policies can:

Steve Parrish
In this article, I propose that advisors use this checklist, or one like it, to assure proper execution of the plan. Any checklist should cover the acquisition of the policy, the implementation of the plan during pre-retirement years, and the decumulation of values during retirement. Ongoing administration of the plan and attention to detail are essential.
Clients, whether individual or corporate, will need help choosing an appropriate policy, both in terms of its use and its risks. For example, a variable universal life (VUL) policy requires more education and decision-making than does a whole life policy. With VUL policies, the policyowner controls the investment of the cash value. With whole life, the insurer controls it.
The advisor must also ask if the policy design fits the intended investment risk strategy for the client’s retirement plan. The advisor should also confirm whether the retirement strategy will use the policy as an uncorrelated buffer asset (a case for whole life) to mitigate sequence risk or, as vehicle for tax deferral (a case for VUL).
Another important question: Is the contract flexible enough? For example, if the owner wants a monthly retirement income when he or she starts decumulating the policy, can the insurer automate these payments? A written withdrawal request to the insurer every month would be unwieldy.
The advisor also needs to determine if the policy has the right triggering points to accomplish the retirement strategy. If the purchaser plans to use the policy for a voluntary retirement, many cash value products will work. If, however, the policyowner wants access to payments for disability or long-term care, the policy will require additional riders or policy features.
During the policy acquisition process, it will be hard to tell how the policy will perform. Cash value life insurance designs are often difficult to understand, and the illustrations vary by product type. For example, from a regulatory standpoint, a whole life policy uses a different illustration regime than, say, an indexed universal or variable universal policy. Some policies are considered securities under state and federal law; others are not. This can lead to apples-to-oranges comparisons. An advisor will need to take extra steps to explain and demonstrate the life insurance retirement income strategy to a prospective client.
The purchaser must also determine how the policy strategy will integrate with the client’s overall portfolio and plan:
Before any policy is actually issued and placed, certain legal issues must be addressed. When life insurance is used to buy out a retiring owner of a business, at least three legal issues arise.
First, to avoid income tax on a transfer for value, the advisor must determine if the business will own the policy or if it will be cross-owned by a business owner. If the policy is corporate owned, the notice and consent formalities of IRC Section 101(j) should be considered. Finally, the existence of the policies and their intended use should be documented in the buy-sell agreement.
If the life insurance will reside in an irrevocable life insurance trust, the policy should be issued, not transferred, to the trust in order to avoid estate inclusion under IRC 2035. Beneficiary designations should likewise be determined in advance.
While buying life insurance always requires the expertise of a licensed agent, help from attorneys and accountants will likely be needed to implement the plan. One of these professionals needs to be responsible for using a checklist to coordinate their activities.
When life insurance-based retirement strategies break down, poor administration and communication is often the cause. When a licensed insurance agent receives a heaped commission for placing the policy, that can be a disincentive to ongoing administration.
While the client’s attorney may be on retainer, he or she may not have the technical expertise to administer the life insurance plan. In some cases, execution of the plan may require the services of a specialist who earns a separate fee for services provided.
Other primary elements to include in a checklist for proper plan administration are:
In an individual client scenario, for example, the insured owner may choose to target policy withdrawals to avoid adding to taxable income (thus avoiding the NII tax, Medicare Part B increases, or Social Security covered compensation tax). In a corporate situation, the company’s advisor should determine which is more or less expensive: To access policy values or use the company’s own capital. If capital is inexpensive, waiting and using the life insurance for its death benefit may be better.
Once income withdrawals begin, the advisor should find out if the life insurer can automate the withdrawals. For example, can premiums cease and monthly payments begin automatically? When decumulation of a universal life policy begins, the owner should ideally switch from an increasing death benefit to a level one. This is often a predetermined step. It maximizes the value of the life insurance in retirement income planning. Who will be responsible for making this switch?
Further, withdrawals of the cash value should be made only until the owners recover their tax basis, and they should take future drawdowns from the policy as loans. If the insurer doesn’t offer these services, the advisor will need to help.
Every plan will need lifelong monitoring. The insurance company should be monitored for impaired financial ratings, mergers, or changes in its internal pricing of in-force policies. Tax law changes should be examined for effects on the retirement plan. And, of course, the client’s individual situation should always guide the execution of the plan. The life insurance policy ultimately represents a death benefit, and a change in the insured’s health status may alter the decision to use the death benefit or the cash value strategy.
Advisors will have their own approaches to fulfilling their duties related to a client’s retirement strategies. For the use of cash value life insurance in retirement planning, this checklist may be a useful tool. Applied throughout the period of accumulation and decumulation of the cash value life insurance contract, the checklist will help ensure the success of the retirement strategy.
© 2020 RIJ Publishing LLC. All rights reserved.

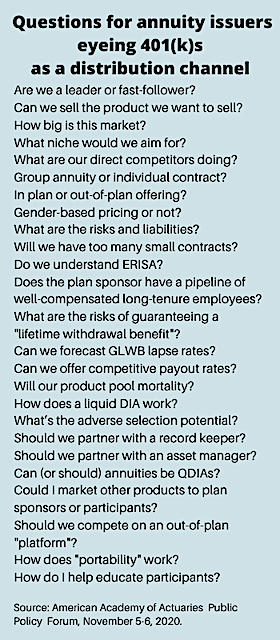
With Mark Iwry of the Brookings Institution and Greg Fox of Aon, I had the privilege last week of being a panelist in a webinar on the implications of the SECURE Act. The webinar was sponsored by the American Academy of Actuaries. AAA actuary Noel Abkemeier moderated.
The SECURE Act and I have a cautious relationship. When it first appeared, and I saw that it would allow unrelated small companies to “band together” to buy retirement plan services at scale. Somehow that didn’t sound plausible.
I asked a number of knowledgeable people, and they assured me that the Act didn’t mean that companies would band together. It meant that retirement services providers could offer a single plan to many unrelated employers at a time.
So, why did the legislators use the expression band together? My sources looked at me blankly. Was I born last night? The wording of all legislation is crafted in such a way, they said. If the legislation said, “The bill will help asset managers and life insurers achieve additional scale in the fragmented 401(k) business by replacing employers as plan sponsors,” it probably wouldn’t pass.
My role on the AAA panel was to report on the implications of the SECURE Act for life insurers. I believe with many others that the Act will be a game-changer for the retirement industry, especially because of the band-together provision, but not necessarily for life insurers—at least, not in the short run.
To be sure, some life insurers with existing ties to the 401(k) business (as plan administrators and recordkeepers) will move quickly into this space. Lincoln, Principal, Prudential and Nationwide, which are life insurers and retirement plan service providers, have already announced new annuity products for this market. (Prudential has continuously marketed its IncomeFlex product for over a decade.) I assume that they’ll market annuities to the plans they administer.
Empower, which still has a Great-West life insurance sibling even after selling its individual annuity business to Dai-ichi’s Protective Life, recently inked a deal to provide record keeping services for Mercer’s PEP (pooled employer plan), Mercer Wise 401(k). MassMutual, whom I expected to play in this space, sold its retirement business to Empower this fall. I have not been able to reach MassMutual for comment.
Some life insurers have already been providing annuities to asset managers that market target date funds. Lincoln, Equitable, Prudential and Nationwide have long attached lifetime income riders to AllianceBernstein’s target date fund (TDF), in a complex framework where three insurers bid each month to wrap their guarantee around contributions from workers invested in TDFs. United Technologies has used the AllianceBernstein program for a decade.
Other TDF providers, like BlackRock, Wells Fargo, and State Street Global Advisors are all assessing the 401(k) market, with varying degrees of development. They’re looking to partner with a life insurer on a TDF/annuity combination. TDFs are essential, because they are Qualified Default Investment Alternatives. Employers can auto-enroll employees into TDFs and, crucially, auto-enroll them into the living benefit rider when they reach, say, age 50.
So far I haven’t heard much from TDF providers like Capital Group American Funds, T. Rowe Price, Fidelity, or Vanguard on this topic. I’m not sure what how they view the opportunities created by the Act. Fidelity has an out-of-plan income annuity purchasing platform on its website, to which its own advisers can send clients.
Vanguard ended the relationship between its 401(k) plans and Income Solutions, the independent platform where retiring participants could solicit bids from several income annuity providers. But Vanguard and Fidelity have big rollover IRA businesses, so they don’t need to steer participants into lifetime income products in order to hold onto their money after they retire.
The SECURE Act has three elements that smooth the road toward incorporation of annuities in 401(k) plans. (Participants in 403(b) plans at non-profit organizations had long had access to group annuities, such as that pioneered by TIAA at colleges and universities.)
The first and most important component is a “safe harbor” that makes clear (somewhat more clearly than in the past) the steps that employers may follow to fulfill their responsibility as fiduciaries to choose a life insurer that is likely to be in business for the long haul. For me, this safe harbor is both too much and not enough.
It’s not enough, because it still leaves employers with some fiduciary responsibility (thus perhaps giving them reason to join a PEP). It’s also too much. It only requires employers to limit their search to life insurers that have been around for at least seven years and it allows plan sponsors to offer any type of annuity to their participants.
The lawyers for life insurers, who crafted crucial parts of the Act, are presumably satisfied with this language. But if I were a plan sponsor, I’d be looking for a life/annuity company with a 100-year track record.
The other two pro-annuity planks of the Act involve ensuring the portability of annuity contracts and giving all participants access to a lifetime income calculator. Portability allows participants to put their annuities into rollover IRAs when they change jobs. The requirement that plan provider offer participants a calculator that reveals the amount of income that participants’ 401(k) current balances would produce today will probably have no effect. Participants ignore disclosures and the income forecaster on the Department of Labor’s website already fills the bill.
The Act puts no limits on the kind of annuities that plan sponsors can offer. That’s very broad. A Biden administration—Bernie Sanders was asked on a network news program last night if he’d accept an offer to run the Labor Department—is likely to feel the way that the Obama Administration felt about fixed indexed and variable annuities.
The Obama DOL wanted to remove the caveat emptor standard for selling those products to retirement savers. The life/annuity industry defeated the effort in court, but the battle over the “fiduciary rule” has never really ended.
I am a bit skeptical about the prospects of the industry’s favorite income product for 401(k) plans. That’s the aforementioned TDF with the guarantee lifetime withdrawal benefit (GLWB) rider. The product has great appeal to the industry life insurers and asset managers because it keeps money in the plan (instead of being rolled over to a brokerage IRA) and it provides steady fee income.
But the most important advantage is that participants can be auto-enrolled into the TDF at enrollment and then auto-enrolled into the income rider a decade or more before they retire—and perhaps a quarter-century before they reach age 75 and have to start taking money out of their tax-deferred accounts.
In other words, participants might pay a 1% annual fee for 25 years for a benefit that some people will drop before using it. (The typical in-plan lifetime income benefit allows contract owners to turn on an income stream that can’t shrink unless they make excess withdrawals and that will last as long as they live.) In a fee-conscious 401(k) environment, will many employers commit themselves to that? Some already have, I’m told.
A more consumer-friendly alternative might be something like the SponsorMatch program that MetLife and Barclays Global Investors proposed before the Great Financial Crisis of 2008. It had two sleeves. Employers would contribute their match (say, 3% of salary) to the purchase of a pension-like deferred income annuity for each participant. A participant’s own contributions would go into investments, as they do today. I liked that concept.
© 2020 RIJ Publishing LLC. All rights reserved.
Barring any legal challenges to former Vice President Biden’s election as president of the United States, and keeping in mind that control of Congress remains undecided, Aite Group analysts share first takes on the recent U.S. election results and expect the following to unfold from the 2020 presidential election for the financial services industry:
Naming a new director to the CFPB is going to be a top priority of the new administration, with action likely to occur within the first 30 days. Many of the names being floated for this role include top staffers from the Cordray era, along with consumer finance experts, such as Representative Katie Porter of California. A new director will likely re-elevate the Enforcement and Fair Lending offices to their prior statuses and give a second look to rule-makings related to small-dollar/payday lending and overdraft fees.
President-elect Joe Biden’s administration will likely bring several issues/topics to the forefront: a reconsideration of how to approach Community Reinvestment Act rule-makings; a serious look at how practices in the financial services industry affect communities of color and what levers government entities can pull to influence this; what, if anything, should be done with regard to reform for government-sponsored enterprises (Fannie Mae and Freddie Mac); and new directions for long-simmering issues such as disparate impact, how guidance should be interpreted and deployed, the balance of power between states and federal regulations, etc.
The Democrats are not any more supportive of Libra, bitcoin, or other cryptocurrencies than are their Republican counterparts, and they largely support bans for financial licensing of big tech companies. The presidency of Joe Biden will likely focus on developing a central bank digital currency long before moving forward with licensing for any cryptocurrency.
President-elect Joe Biden has signaled that he will quickly strengthen consumer protections and empower the Consumer Financial Protection Bureau to offset President Donald Trump’s 2018 Economic Growth, Regulatory Relief, and Consumer Protection Act. The act exempted dozens of banks from the CFPB’s regulations. A resurgence of the CFPB by a Biden administration will resurface calls by consumer protection advocates for a stringent national data protection and privacy law, likely based on some of the provisions of the European General Data Protection Regulation and the voters’ recent approval of Proposition 24 to enhance the California Consumer Protection Act. Although a national law will harmonize a patchwork of state laws, its enactment and subsequent enforcement would be expected to increase regulation requirements for financial services organizations and their technology providers—and raise the cost of compliance.
President-elect Joe Biden has been opposed to President Donald Trump’s immigration policy and has also opposed building a border wall. The Biden presidency will likely encourage and further enable the formal transfer of funds between migrants and their families due to the far-reaching socioeconomic benefits that remittances provide. Additionally, the Biden presidency may encourage policies such as limiting fees on remittances to make more funds available to migrant families in light of the COVID-19 pandemic.
The new administration will likely give power back to the Consumer Financial Protection Bureau, which may refocus its attention on card products that rely heavily on fees and breakage income, such as single-use cards, incentive cards, and prepaid rebate gift cards. Additionally, depending on which party controls the Senate, retailer lobbies could see an opportunity to push for new limits on credit card interchange rates as they did with debit card interchange rates. A reduction in interchange expense will undoubtedly affect credit card rewards programs, but it reduces the risk that merchants will test alternative, less expensive payment options.
President-elect Joe Biden has not released enough details to indicate where he stands on this topic or if his administration will reverse course. Charters for fintech firms first gained traction during former President Barack Obama’s administration, although there has been significant pushback from bank and credit union lobby groups. Issuance of charters to fintech firms will likely continue, notwithstanding any big technology disruption or other big anti-consumer impact that may turn the Democratic Party against fintech firms providing these banking services.
A Democratic administration is more likely to pass larger COVID-19 relief packages that may include additional direct payments to Americans and extended unemployment benefits. As some studies have suggested, Americans largely spent much of the relief provided in the Coronavirus Aid, Relief, and Economic Security Act, waterfalling this relief to merchants, payment networks, and financial institutions. A larger relief package will therefore inject more use and spend, benefitting the payments and banking ecosystem as a whole.
The Democratic victory will likely see rapid passage of the long-stalled Secure and Fair Enforcement Banking Act, granting legal protections to banks that provide services to legal cannabis businesses in the US. With the Democratic platform including federal-level legalization of cannabis for medical and potentially recreational use, the removal of cannabis from Schedule I classification will rapidly enable financial services providers to enter the market without the constraints and significant regulatory hurdles they currently face. Expect to see a very rapid entrance from Tier-1 banks into the market, while the major payment networks will quickly reverse their avoidance of the market in the U.S. As happened in Canada, once the laws change, the networks will be quick to accept and process payments in the space, even if they do not announce this change very loudly. These moves will likely have a negative impact on some of the cannabis-related fintech firms that have arisen to address the lack of banking and payment support in recent years. Compliance, fraud, and anti-money laundering considerations will remain major concerns for the sector in the medium term, however, as many cash-rich businesses revert to more standard banking relationships and because cannabis-related businesses need to comply with state-level regulations regardless of federal status.
The financial services industry has expressed sweeping and far-reaching challenges to President Donald Trump’s proposal to make it harder for most institutional defined-benefit and private defined-contribution plan fiduciaries to adopt sustainable funds in their plans. That proposal, which was finalized on October 30, 2020, effectively holds environmental, social, and governance investing to a greater level of scrutiny than traditional investments are held to. Aite Group projects that the new administration will cancel the proposal and, by so doing, advance the evolution of sustainable investing options in U.S. retirement plans. In such a scenario, record-keeping platforms will increasingly make tools and data available that enable employers to offer comprehensive, bundled plan services, with fiduciary and investment outsourcing capabilities. Going a step further, once large corporate plans commit to sustainability in their retirement plans, the retail advisory firms will have to engage (as a matter of strategy), building capabilities in that area and training the front-line salespeople.
With the Democratic victory and Joe Biden elected as the 46th president of the United States, Aite Group expects an increasing focus on creating a uniform fiduciary standard. Fiduciary advocates believe that the Securities and Exchange Commission and Department of Labor would be pressured to reconsider the issues of best interest and a uniform fiduciary standard. Regulatory entities would not rely on new legislation but would instead use their existing authority to make changes. However, don’t expect any immediate changes, as the administration, Congress, and regulators will want to minimize disruption and confusion that could result from enacting changes too soon.
With President-elect Joe Biden’s win, there is a higher possibility of an initial negative reaction in U.S. equities and corporate credit markets due to concerns over higher taxes and regulation, but this can change as soon as the new fiscal stimulus package is approved. Financial institutions’ spend on regulatory initiatives has increased year over year, and Aite Group expects the introduction of more chapters under existing regulations (e.g., the Dodd-Frank Act).
A Democratic win will usher in an era in which attention shifts to preserving and expanding health insurance access through federal and state-level programs. While a Democratic win does not jeopardize the “HSA for all” approach, its priority level will likely be deescalated in favor of more imminent public health needs—namely, addressing COVID-19-related challenges. Beyond the immediate term, the Biden administration will strive to provide healthcare coverage for those who are unemployed or otherwise unable to access health insurance.
A Democratic win means that efforts to provide health insurance coverage for those who don’t have it will continue in the spirit of the Affordable Care Act (ACA), featuring a hybrid health insurance environment with elements of “Medicare for All” or a public option. The ACA will likely be mired in the courts system but will remain largely intact. The individual health insurance exchanges will benefit from a redesign that may encourage more health plans to participate in state-based health exchanges and ideally make it easier for individuals and families to navigate them. Health insurance exchanges will fill a gap for those who are no longer covered by employer groups, including those who are unemployed, as well as freelancers, contractors, and sole proprietors who otherwise have few choices.
The Affordable Care Act and its transparency provision remain intact, and consumers remain positioned as winners with price disclosures and a focus on eliminating surprise billing. Areas to watch are the impact to seniors if Medicare is replaced with a single-payer healthcare system and how transparency is addressed.
With President-elect Joe Biden’s win, more regulation is expected, as is an elevated likelihood of more state and local COVID-19 lockdowns, the latter of which could lead to further business contraction and subsequent business closures. However, with Democrats in control of the House and possibly in control of the Senate after the election, it will be easier for a business relief deal to be reached. The unknowns are what types of businesses will be granted relief and which businesses will become regulatory targets. A Biden administration will likely embrace certain tenets of the Green New Deal proposed by some members of the Democratic caucus, and some businesses could face some rough times as they come under greater regulatory pressure.
This report was prepared by Aite senior analysts Leslie Parrish, Talie Baker, Gilles Ubaghs, Wally Okby, Dennis Gallant, Vinod Jain, Inci Kaya, Jay Sarzen, Joe Krull, and David Shipper and research associate Francisco Alvarez-Evangelista.
In an effort to assist Vermont small business owners and their employees with access to a robust and cost-effective retirement savings vehicle, Vermont Retail & Grocers Association (VRGA) and affiliated entities, are rolling out of a Multiple Employer 401k Retirement Plan (MEP) for its members.
VRGA has partnered with the Alliance of State Retail Associations (ASRA) to offer their multi-state MEP 401k. ASRA is a non-profit advocacy group which administers the MEP for many state retail associations. Currently, ASRA affiliate states include ME, NH, MA, CT, PA, MD, IN, IL, CO, and now VT.
The recordkeeper for the MEP 401k is Lincoln Financial Group, a fortune 200 company and one of the largest retirement plan providers in the nation. The distribution of this solution is open to financial advisers who are properly licensed in the state of Vermont.
“Retail in Vermont represents over 95,000 employees across the state and unfortunately, many employees of these small businesses do not have a retirement savings,” said VRGA President Erin Sigrist, in a release. “This new plan provides any retailer the opportunity to begin offering this valuable benefit with reduced costs and liability. Many time employers do not offer 401k programs due to the complexities of setting up a plan, burdensome regulations, liability of non-compliance, as well as costs associated. VRGA believes by leveraging the power of a MEP, Vermont employers and employees will be able to access these tremendous benefits in their quest for a comfortable retirement.”
The passage of the SECURE ACT has paved the way for the expansion of Multiple Employer Plans due to the ability to leverage economies of scale. By banding together many small to mid-sized businesses this structure can lower aggregate costs across the entire group. Additionally, a MEP structure provides centralized governance, administration, and regulatory oversight so these entities can focus on what’s most important, their business.
The structure of the VRGA MEP 401k offering is of a “Closed MEP” which is only available to retail-oriented businesses. This homogeneous composition affords the plan single-plan status in the eyes of the IRS and DOL and is a tremendous advantage as we can decrease the duplication of efforts and requirements of an open MEP structure or an individual plan, while retaining all the plan design flexibility for each participating employer.
Administratively the MEP files a single IRS Form 5500, single ERISA Audit, single ERISA Bond, Fiduciary Liability Policy, single recordkeeper, third party administrator, and all the administration and regulatory oversight is handled by the designated fiduciaries of the plan. This allows an employer to gain all the benefits of offering a retirement plan without the complexities and liability that often accompany such a benefit.
Fixed and fixed indexed annuities issued by Forethought Life, a subsidiary of Global Atlantic (a KKR company) will be available on the annuity marketplace maintained by SIMON Annuities and Insurance Services LLC, SIMON announced this week.
Using SIMON’s platform offers pre- and post-sale analytics, financial professionals can seamlessly find and explore annuity products and features, run powerful allocation and income analyses, and access product-specific marketing literature—all from directly within SIMON’s interactive platform.
“Annuities are increasingly gaining traction within well-diversified portfolios because they offer clients a balance of the protection they need with the growth potential they want,” said Jason Broder, CEO of SIMON, in the release.
Borrowing by AM Best-rated insurers increased 31% to $56.0 billion during the 12-months ending Sept. 30, 2020, according to a new AM Best special report. Insurers were reacting to the potential negative impacts of the COVID-19 pandemic.
In the report, “AM Best-Rated Debt Issuance Surges Over 30% from 2019 Amid Pandemic,” the rating agency noted that debt issuance among this group in the first half 2020 vastly outpaced that same prior-year period, with the most activity between March and May. Debt issuance among life/annuity (L/A) companies jumped by more than two-thirds, with many citing the need to bolster liquidity.
Total debt issuance by L/A insurers increased nearly 65% year-over-year through September 2020. The interest coverage ratio for AM Best-rated L/A companies has dipped from its peak in 2019. Lower sales in the COVID-19 environment, lower earnings, and low interest rates are likely to keep it where it is.
“Interest coverage ratio” is earnings before interest and taxes (EBIT) divided by interest expense. It’s a measure of how well a company can pay its outstanding debts.
The health segment also reported a $3 billion uptick compared with 2019, with UnitedHealth Group, Cigna Corp., and Anthem, Inc. all among the 10 largest issuers so far this year.
“Issuances from health insurers have been for general corporate purposes, as well as to redeem or tender higher-coupon issued debt coming due over the next few years,” said Jason Hopper, associate director, industry research and analytics.
Despite the increased debt load for the health segment, its interest coverage ratio improved on strong operating results in 2019 and so far through first-half 2020, driven by the significant decline in member utilization resulting from the COVID-19 shutdowns and the deferral of routine care and elective procedures. Health care utilization reverted back to near normal levels in the third quarter, but may decline again as many states are now seeing hospital capacity weaken as a new wave has led to an influx of COVID-19 patients.
The analysis for the special report did not include those issuances unrated by AM Best, such as Wilton Re’s $400 million issuance of privately placed preferred stock, and converted foreign-denominated issuance to USD. The report also notes an uptick among just about all types of issuance, including preferred stock, as well as surplus notes from non-publicly traded companies that cannot access the public debt market.
Jean Boivin, PhD, managing director and head of the BlackRock Investment Institute, and Mike Pyle, CFA, managing director and Global Chief Investment Strategist for BlackRock, commented recently:
Joe Biden’s victory in the presidential race likely ushers in a near-term market environment dominated by low rates, a hunt for yield and growth stocks.
A Democratic takeover of the Senate looks unlikely, which would constrain the Biden administration’s ability to implement large-scale fiscal stimulus and public investment, tax, healthcare and climate related legislation.
President-elect Biden flipped the key states of Michigan, Wisconsin and Pennsylvania, giving him more than the needed 270 electoral votes to win the White House. See the chart below. We see the likelihood that recounts and legal challenges could overturn this outcome as remote and favor looking through any resulting market volatility.
Democrats’ effort to take control of the Senate has met roadblocks. Two Senate seats in Georgia are headed for a January runoff election, giving Democrats a narrow path to winning both and yielding a 50-50 Senate, with the vice president as the tie breaker.
A divided government—with Republicans retaining their control of the Senate—could see greater regulation for many sectors, but big-ticket legislative actions including large-scale fiscal stimulus and public investment, tax, healthcare and climate related legislation would likely face insurmountable hurdles.
Fiscal policy is critical for preventing permanent economic damage from the virus shock. Some fiscal relief looks possible in the near term during the lame-duck session of Congress, but we see the scope and size of fiscal stimulus and public investment as much more modest than what a united Democratic government might deliver.
We’re monitoring the fiscal response closely, as a premature retrenchment could set back an economic restart that has so far surprised to the upside. Taxation policies would likely stay steady under a Republican Senate. Long-term US Treasury yields had run up ahead of Election Day in anticipation of a Democratic sweep, bringing forward a rise in yields we expect to see in a higher inflation regime in the medium term.
The prospect of a divided government removed the accelerant and brought yields down for now. Yet we still expect yields to slowly move up over the next few years, boding well for risk assets, especially for credit and growth companies that have dominated markets for much of the post-crisis period.
A Biden win likely signifies a return to more predictable trade and foreign policy. We believe emerging market (EM) assets should perform on improved trade sentiment, especially in Asia ex-Japan. In addition, many Asian countries have managed to contain the virus and are ahead in the economic restart. Yet we see U.S.-China rivalry staying structurally elevated across technology, trade and investment, due to bipartisan support for a more competitive stance on China.
We also see an increased focus on sustainability under a divided government through regulatory actions, rather than via tax policy or spending on green infrastructure, and a rejoining of the Paris Agreement to combat climate change.
The bottom line:
A Biden divided government would bring significant changes in foreign policy and regulation—both in substance and tone. Yet the legislative agenda would be constrained, taking off the table the more transformative scenarios being contemplated ahead of the election.
The likely implication: Continuity in the market environment. We expect the quality style factor and large-cap equities to perform strongly—as they have often done in the past. Large-cap tech stocks have led the post-election rally, yet we note they would face regulatory pressure even under a divided government.
We are reviewing our tactical asset views in light of the election result. Other key inputs include the evolution of the virus shock and the timeline for a vaccine—and their potential to bring forward market expectations of inflation and change equity market leadership to cyclicals.
© 2020 RIJ Publishing LLC. All rights reserved.
When Equitable introduced the buffered annuity in 2010, it created not just a new kind of annuity but a new category of annuity, the RILA (registered index-linked annuity). Since then, sales have steadily grown. Equitable’s competitors have introduced similar products.
If there’s such thing as a no-brainer annuity for older people who don’t know what to do with their savings, buffered annuities might be it. Linked by options to the performance of equity market indexes, it offers a narrower range of returns than a conventional variable annuity but a wider range of returns than a fixed indexed annuity.
You can lose money on it, it’s true. And everyone who buys it can have a different return, because performance is based on each owner’s “contract year,” not on the calendar year. But it doesn’t give prospects many reasons to say no—other than the fact that they can’t possibly understand exactly how it works.
Equitable, the principal franchise of Equitable Holdings, Inc., is now making eight new options available for its Structured Capital Strategies Plus (SCS Plus) registered index-linked annuity (RILA), which enables contract owners to experience a positive return even in a down market.
“The new offerings provide clients with additional ways to capture some upside potential even when equity market benchmarks may decline,” an Equitable release this week said. Available on Nov. 23, these options expand the SCS Plus Dual Direction feature launched earlier this year.
With Dual Direction, if the S&P 500 declines up to or equal to the amount of the buffer (-10%, -15% or -20%) at the end of the investment time frame, clients earn a positive return equal to the percentage of the decline up to or equal to the buffer.
If the S&P 500 declines more than the buffer, the client is protected from losses within the buffer.* Positive returns are credited up to the cap.
The new segment options include:
Equitable, then AXA Equitable, introduced Structured Capital Strategies, the first registered index-linked, or buffered, annuity in 2010. Through Structured Capital Strategies, clients can participate in the performance of one of several mainstream equity market indices up to a cap, with the buffer protecting against the first -10%, -20% or -30% of potential losses.
Clients can choose the equity index on which the performance of their investment is based, such as the S&P 500 Price Return Index, Russell 2000 Price Return Index or iShares MSCI EAFE ETF. They can also choose the duration of the investment and the level of downside protection based on their goals and risk tolerance.
© 2020 RIJ Publishing LLC. All rights reserved.

Chris Blunt has held C-level positions in asset management, marketing or annuities at Merrill Lynch, New York Life and other top firms over a 34-year career. In 2018, he became CEO of Blackstone Insurance Solutions. About a year ago, he became president and CEO of Fidelity & Guaranty Life.
That makes Blunt, who is 58, well-qualified to comment on the evolution of the life/annuity industry since the Great Financial Crisis of 2008, and on the new business model that some companies, including F&G, have adopted. RIJ calls it the “Bermuda Triangle” model. The businesses call themselves “insurance solutions” providers.
It’s an investment-driven model. Powerful asset managers like Blackstone Group, Apollo Holdings, and KKR are helping certain insurers invest a portion of the assets backing their in-force fixed or fixed indexed annuities (FIAs) in relatively high-yielding, illiquid, long-dated asset-backed securities, or ABS. The asset managers are partnering with life insurers or making equity investments in them.
The asset managers make customized “leveraged loans” to high-risk borrowers, and/or bundle those non-investment grade loans into securities called collateralized loan obligations, or CLOs. Life insurers then buy the senior, investment-grade segments (“tranches”) of CLOs—which pay higher returns than the high-rated corporate bonds that make up a large chunk of a life insurer’s assets.

Chris Blunt
This strategy, especially when linked to the sale of troubled blocks of in-force annuities to offshore reinsurers, has helped mitigate the damage dealt to certain life insurers by a decade of low returns. Some annuity veterans worry, however, that while solving problems for annuity issuers, asset managers are bringing an overly aggressive style to the historically cautious life industry, that CLOs might prove too risky for life insurers to buy and hold, and that private equity culture may not be policyholder-centric enough.
Fidelity & Guaranty Life (F&G)—built on the old USF&G and recently acquired by FNF, the title insurance giant—didn’t pioneer the “insurance solutions” strategy. (Apollo and Athene did, in 2010.) But, working with Blackstone, F&G has used the strategy to become the #3 FIA seller in the independent agent channel, where half of all FIAs are sold. It has nipped market share from established FIA issuers like Allianz Life, American Equity, and Great American.
Blunt recently talked with RIJ about F&G and Blackstone and about the insurance solutions business. Although private-equity companies created this new business, Blunt said, making private equity purchases isn’t the chief skill they bring to annuity issuers. It’s their ability to create private credit.
By buying bank loans or placing bespoke loans to businesses with weak credit ratings but real assets (like machinery or cellphone towers) or contractual cash flows (from, for example, music royalties), F&G can add 20 basis points to the average return of a life insurers general account investments, producing 5% to 10% more investment income. That’s a meaningful competitive advantage, especially when pricing fixed indexed annuities in a low interest rate environment, consulting actuary Tim Pfeifer told RIJ.
 Questions and answers
 RIJ: F&G was a public company when CF Corp.—a company started and financed by William P. Foley III, owner of FNF title insurance, and Chinh Chu, a former co-chair of Blackstone’s Private Equity Group—bought it from HRG Group, formerly Harbinger, for about $1.84 billion in 2017. FNF took F&G private this year and CF Corp became FGL Holdings. How would you describe F&G as it stands today?
Blunt: We’re a life and annuity company, and we have been from our beginning as US F&G Insurance. The company used to be bigger in life insurance than it is today. Now we’re overwhelmingly a fixed deferred and fixed indexed annuity company.
RIJ: What inspired Foley and Chu to buy it?
Blunt:At the time [2017], everyone was aware of how Apollo had partnered with Athene. CF Corp. said to Blackstone: You guys have access to even bigger fixed income opportunities than Apollo does. As such, F&G should be able to become even more successful as a life and annuity company than Athene/Apollo, given Blackstone’s ability to source attractive investment-grade private debt.
RIJ: At what point did you get involved with this project, and in what capacity?
Blunt: I was hired by Blackstone in Jan 2018 and tasked with building a third-party asset management unit serving insurance companies. They knew I understood the nuances of both insurance and investments. By the fall of 2018, they saw that the key to success in the US would be to help scale F&G. At the same time, the board of F&G approached me about becoming CEO. So I left Blackstone (with their blessing) entirely at the end of 2018 and in January 2019 I became the CEO of F&G.
RIJ: What enticed you to make the move?
Blunt: It was a difficult decision to leave Blackstone, but I knew what Blackstone’s impact on the investment portfolio of F&G would be. I knew they could give F&G at least a 20 basis-point investment edge. I knew that was unbelievably meaningful, and I liked the size of the company, and the executives I had come to know there. So, in January 2019, I became CEO.
RIJ: And why did FNF decide to take F&G private this year?
F&G’s annuity business; source for charts: F&G 6-16-20 presentation.
Blunt: FNF’s insight was, ‘We’re currently the largest provider of title insurance. We do title insurance well and do really well in a low rate environment, but eventually rates will rise.’ In addition, FNF felt F&G would have a harder time raising capital in a low rate environment as a standalone company. So its thought was, ‘Why don’t we buy F&G?’ It’ll provide a buffer to FNF when rates rise, and FNF can help scale it faster.
RIJ: It feels like a number of life insurers are becoming sources of stable investment capital for private equity companies.
Blunt: It’s misleading to refer to the new wave of life insurers as ‘private equity-led.’ The relationships between the asset managers and life insurers have taken a variety of shapes. For instance, a private equity holding company might own or have stakes in the insurance company itself or simply manage part or all of their general account. Or, as in one case, a life insurer partners with two or more asset managers. Each relationship is structured differently. In the case of F&G/FNF, FNF and Blackstone have had close dealings with each other, but are completely independent entities.
RIJ: So private equity companies are not at the center of this model?
Blunt: We’re talking about the private-credit arms of the private-equity companies. Rather than taking equity positions in high-risk companies, the asset managers like Blackstone, which re-deploy fixed annuity investments, are more likely to buy or originate private investment grade loans as well as package below-investment grade loans into CLOs and sell the investment-grade senior tranches to life insurers.
RIJ: I see.
Blunt: The question we ask asset managers is, ‘Do you have access to unique private debt deals that are investment grade?’ Not everyone can do that. You have to be in that private deal world, and you need lots of people with specific expertise. Blackstone knows how to access these deals and, more importantly, how to analyze them. If you asked, ‘What’s the most impactful part of this business,’ that’s the most important piece.
Blackstone’s assets under management
RIJ: Impactful in what way, exactly?
Blunt: Maybe I pick up 20 basis points in total yield right there. We’re not taking more credit risk, but rather liquidity risk. They’re typically 4-5 year loans that are not easily tradable. By investing in private loans and structured securities, we’re picking up an illiquidity premium, a complexity premium and a size premium.
RIJ: So exactly how does this play out?
Blunt: Rather than wait for the phone to ring on a public deal, F&G will go to Blackstone Insurance Specialty Finance for example and say, ‘We want to place $1 billion in a diversified portfolio of loans, we want investment grade, we want no more than Y percent in BBB, with an average duration of X.’ Within those parameters, Blackstone goes out and sources deals for us.
RIJ: What’s Blackstone’s appeal to those borrowers?
Blunt: For a $300 million to $400 million loan, those borrowers wouldn’t go to a big investment bank. It’s too small a loan to be worth [the big banks’] while and they would, appropriately, charge a mark-up. Whereas Blackstone can say, ‘We have multiple insurance clients who would love this kind of yield/credit profile.’ The assets backing these deals can range from cellphone towers to machinery to music royalties—anything with real assets or contractual cash flows. Blackstone says, ‘Work directly with us and we’ll get all of your financing done in one place.’
RIJ: Why is it hard to find those deals? Can’t Blackstone just go into the bond market to find assets for F&G?
Blunt: The investment-grade public deals are massively oversubscribed. If we were F&G in the old days, a big life insurer would have already soaked up all the attractive investment-grade deals that were available [before we could get to them]. I’m not picking on the big insurers, but this is the dilemma in insurance.
![]() RIJ: Which tranches of asset-backed securities does F&G buy?
RIJ: Which tranches of asset-backed securities does F&G buy?
Blunt: With F&G, Blackstone is looking mainly for investment-grade debt tranches. As a life insurer, we can’t own more than five percent in non-investment grade debt. That means 95% of our fixed income is investment grade. Blackstone can originate private asset-backed loans and can choose to securitize them or not. Blackstone can, for example, manage a portfolio of CLOs for us that includes Blackstone-structured CLOs as well as CLOs from other CLO creators.
RIJ: What’s your response to academics and others who feel that CLOs are too risky for life insurers?
Blunt: A lot of people don’t like securitized products. They say, ‘Oh, this could be the next disaster.’ But a single CLO has hundreds of loans from a variety of industries. They’re senior financings; which means, as the creditor, I can liquidate your property if I have to. Frankly, we believe it’s a better risk than an unsecured BBB bond from a single company in a single industry.
RIJ: So, is F&G buying BBB tranches of CLOs?
Blunt: Mainly we’ve bought the single A tranches of a CLO. The BBB grade clearly has more risk whether it’s a CLO or a bond, but we haven’t seen massive downgrades or defaults on them. I’d rather own a BBB tranche of a CLO than a BBB corporate. So where does all the handwringing come from? There’s no historical basis for it.
RIJ: Thank you, Chris.
© 2020 RIJ Publishing LLC. All rights reserved.

Collateralized loan obligations, or CLOs, are a type of asset-backed security (ABS) whose returns, relative to their risks, are providing some extra yield to an annuity industry worn down by a dozen years of Federal Reserve low-interest rate policy. But important questions remain about CLOs.
Those questions resemble the ones that surrounded collateralized debt obligations, or CDOs, during the 2008 financial crisis. Both CLOs and CDOs are bundles of below-investment grade loans or mortgages that have been turned into a single security, segments of which (the “senior tranches”) are rated as investment-grade—and thus permissible for life insurers to buy and hold.
CDOs crashed back in 2008, and the debacle inspired the bestselling book and movie, “The Big Short.” In the movie, investors (played by Christian Bane, Steve Carell and others) reaped fortunes by identifying the most flawed mortgage-backed CDOs and betting against them. Now academic researchers are asking if CLOs might be as problematic as CDOs.
This is important, because asset managers who can select the best high-risk loans and bundle them into out-performing investment-grade fixed income instruments are helping life insurers battle the long interest rate drought. By redeploying a portion of fixed indexed annuity assets into CLO tranches, they are making old FIA books better-funded and new FIA issues more competitive. (See Part I of RIJ’s series on the “Bermuda Triangle” strategy.)
Two scholarly analyses of CLOs appeared in October. In one, credit ratings experts at the University of Texas and MIT ask why the ratings of CLOs didn’t drop as much as the ratings of the debt inside them during the financial crisis that started last March. The second study was written by economists at the Federal Reserve Bank Board and Yale School of Management.
The economists ask if traders (like those played by Bane and Carell) are hacking (my word, not theirs) into CLOs to find out which ones might be mis-priced. These two papers are highly academic, but if you want to understand the CLO market better, they’re worth your time.
Why do CLOs get higher ratings than their components?
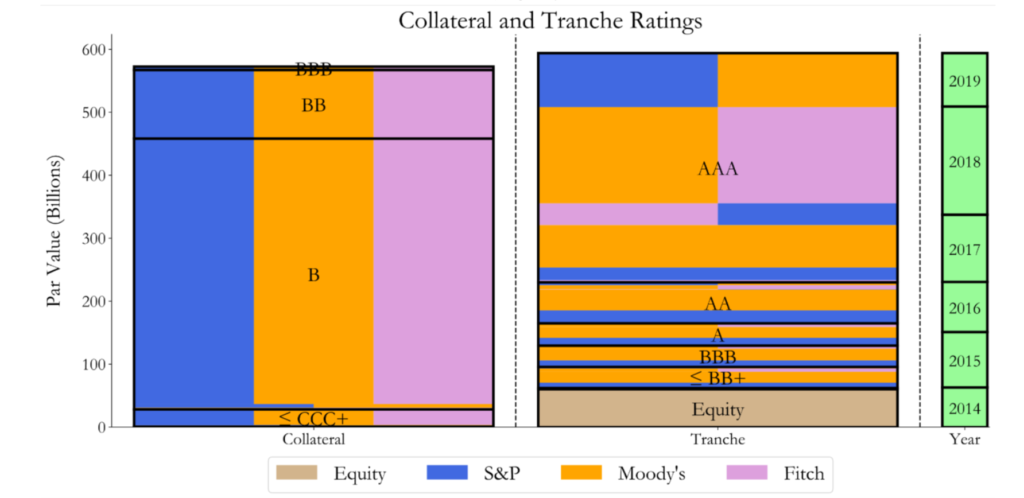
In their paper, “Are CLO Collateral and Tranche Ratings Disconnected?” John Griffin (Texas) and Jordan Nickerson (MIT) assert, “CLOs appear considerably riskier than current ratings suggest,” adding that their findings “have current relevance for policymakers.”
“Beginning in March and accelerating in April, both S&P and Moody’s began downgrading large amounts of collateral,” the paper said. “Collateral downgrades stabilized by mid-June, with S&P downgrades standing at 30% of the par-weighted CLO assets while Moody’s downgraded 26% of their rated collateral at the end of August.
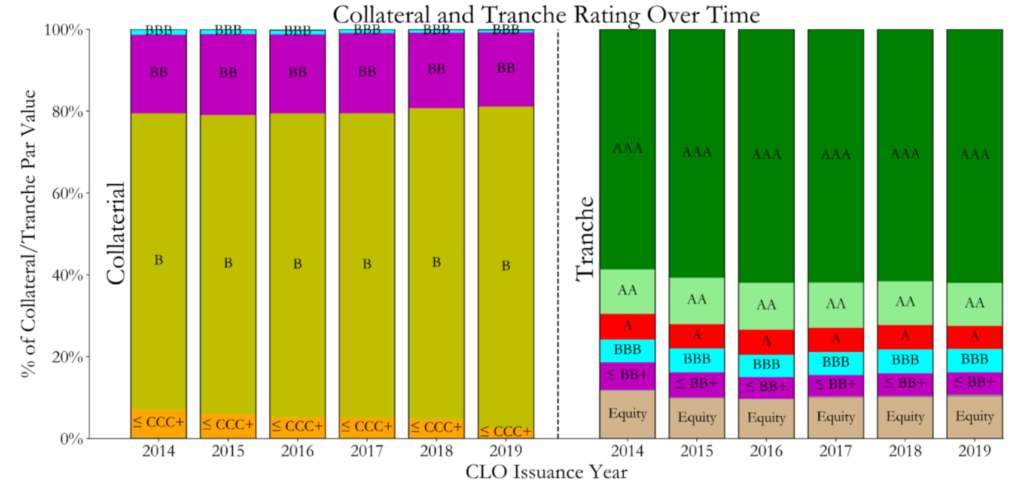
One of the figures in the Griffin Nickerson paper. Another is below.
“In contrast, the par-weighted percent of tranches downgraded is 2% for S&P and 1.75% for Moody’s. When considering tranches placed on negative credit watch these magnitudes increase slightly to approximately 3.5% and 5.5%, respectively. It is difficult to reconcile the current lack of tranche rating actions with either rating agency’s methodology, based on prior disclosures or current model outputs,” Griffin and Nickerson wrote.
“We are not able to explain the potential reliance on non-model considerations by rating agencies. Additionally, roughly twice as many CLO tranches would be considered failing by S&P standards had managers not engaged in trading that made the portfolios appear to be safer,” the paper said. Banks, insurance companies, and mutual funds “which hold such assets could contribute to systemic risk if assets are downgraded or experience correlated losses, as often happens with structured products during distress states.”
‘Privately-produced debt is a double-edged sword’
In “Adverse Selection Dynamics in Privately-Produced Safe Debt Markets,” a new paper by Nathan Foley-Fisher and Stephane´ Verani of the Federal Reserve Board and Gary B. Gorton of Yale, the authors explore an issue closely related to the events in “The Big Short.” It’s the issue of adverse selection. In good times, the authors write, investors take the AAA-rated upper tranches of CLOs literally at face value, even though their underlying contents, structures, and trading strategies are relatively opaque. It just costs too much for investors to evaluate them, and there’s no reason to doubt them. In the authors’ words, this renders them “information-insensitive.”
“CLOs have complicated and opaque internal structures,” the authors explained. “All these attributes make it very expensive for agents to produce private information about the value of the AAA tranche, allowing buyers of this debt to avoid adverse selection because it is very expensive to produce private information. But, in bad times this is exactly the problem!”
In early 2020, as in 2008, investors start looking at CLOs and other ABS more closely. Like the curious investors in “The Big Short,” they sensed that it would be worthwhile to invest considerable time and money to identify mis-pricing that they might capitalize on. As the authors put it, “When the pandemic hit some agents became informed while others did not.”
CLOs suddenly moved from “information-insensitive” to “information-sensitive.” People on one side of a CLO trade knew more than the people on the other side, which the authors described as “a unique risk.” That’s why the trade prices in the CLO market changed dramatically in March 2020, they believe. Like income annuity issuers who know less about the health and longevity risks of their customers than do the clients themselves, traders of CLOs were vulnerable to adverse selection, and weren’t sure how to price the instruments.
(c) 2020 RIJ Publishing LLC.
Mercer, the global benefits consulting firm with $300 billion in global OCIO, has selected Empower Retirement as the recordkeeper for Mercer Wise 401(k), the firm’s outsourced 401(k) solution, and to use Empower as its record keeper when it launches a Pooled Employer Plan (PEP) in early 2021, according to a Mercer release.
Launched in 2017, Mercer Wise 401(k) now has over $1 billion in participant assets under management. Mercer, which ranked as the largest Outsourced Chief Investment Officer (OCIO) according to Pensions & Investments magazine, with some $300 billion in global OCIO assets under management.
“Besides our growth in OCIO AUM, we’ve also experienced strong growth in interest for our manager research through MercerInsight, our digital delivery platform, and in our traditional investment consulting client base. As of June 2019, over half of Mercer’s $15 trillion in assets under advisement were from MercerInsight clients that have access to the firm’s manager research5,” said Deb Clarke, Mercer’s Global Director of Research.
PEPs were made legally possible by a provision in the 2019 SECURE Act. That provision allows many unrelated employers to join a single large multiple employer plan offered by a Pooled Plan Provider. In the past, only companies with some natural affiliation—geographical, professional, union-related—could belong to a single plan. For employers who want to offer a plan but not start one, joining a PEP allows one-stop shopping.
“Given recent market volatility, the complexity of retirement plan and investment issues, and many competing demands for employers’ time, the idea of outsourcing to a high-quality pooled plan can be a compelling one,” said a Mercer executive in the release.
Mercer’s clients include many types of institutional investors, such as defined benefit and defined contribution plans, insurance assets, financial intermediaries, not-for-profit foundations, endowments and healthcare systems, family offices and sovereign wealth funds. Mercer clients will now also have the benefit of access to Empower, the second largest retirement services provider in the US, after Fidelity Investments. Robert Reynolds, chair of Great-West Lifeco US, and Edward F. Murphy III, president and CEO of Empower Retirement, and Robert Reynolds, chair of Empower’s parent, Great-West Lifeco US, are former senior executives at Fidelity.
In 2019, Great-West Lifeco sold almost all of its individual life and annuity business to Protective Life, a subsidiary of Tokyo-based Dai-ichi Life Holdings, in a reinsurance deal valued at about $1.2 billion. The value included a positive ceding commission to Great-West Lifeco’s U.S entities and a capital release of approximately US$400 million.
The business transferred included bank-owned and corporate-owned life insurance, single premium life insurance, individual annuities, and closed block life insurance and annuities. This business contributed approximately US$95 million, to Great-West Lifeco net earnings for the first three quarters of 2018.
GWL&A will retain a small block of participating life insurance policies which will be administered by Protective following the close of the transaction. GWL&A’s retirement and investment management divisions, Empower Retirement and Great-West Investments, are not affected by this transaction.
Rosemont, IL-based asset manager TrueMark Investments has launched NVMZ, the fifth ETF in the True-Shares structured outcome product suite. The TrueShares Structured Outcome (November) ETF is sub-advised by SpiderRock Advisors, a Chicago-based asset management firm specializing in option overlay strategies.
The fund seeks to provide investors with structured outcome exposure to the S&P 500 Price Index. The structured outcome ETF suite combines downside buffers with uncapped upside participation.
“NVMZ’s structure allows for the potential of an asymmetric return profile,” according to a TrueMark release. The fund seeks to provide investors with returns (before fees and expenses) that track the S&P 500 Price Index, while seeking to provide a buffer of 8-12% on that index’s losses over the fund’s one-year investment period.
In practice, the fund adviser will target the buffer at 10% of index declines over the investment period following the first day of trading while also allowing for uncapped upside participation. NVMZ’s expense ratio is 0.79%.
NVMZ is the fifth of twelve monthly series ETFs in the True-Shares Structured Outcome ETF suite. Each fund will roll over at the end of a year-long term, at which point the downside buffer and upside participation will reset based on current pricing for the options used by the strategy for each respective ETF.
Due to the cost of the options used by the Fund, the correlation of the Fund’s performance to that of the S&P 500 Price Index will be less than if the Fund invested directly in the S&P 500 Price Index without using options, and could be substantially less, the release noted.
Beacon Annuity Solutions, a provider of cloud-based software, has introduced Annuity Switchboard, a source of “pre-sale and compliance-driven solutions” for annuity manufacturers and distributors, according to a news release.
Annuity Switchboard “enables insurers to communicate their most current annuity rates and product information at key point throughout the annuity purchase cycle,” the release said. The information will be directed to broker/dealers, banks, brokerage general agencies and other distribution partners.
“Switchboard provides secure real time access to carrier information on thousands of fixed, fixed index, indexed variable and variable annuity products along with more than 10,000 rates. Custom APIs deliver a seamless integration into bank and broker dealer compliance systems as well as carrier back offices,” the release said.
Beacon also has an archive of closed annuity products with versioning going back to 1997. The archive enables brokers to make detailed comparisons of the exact version of an exchanged product verses a recommended one for any type of annuity.
In addition to supporting annuity sales and distribution, the Annuity Switchboard interface “allows annuity providers to control and understand how their products are being used across their own distribution ecosystem.
“Carriers effectively manage each distributor’s access to its products and approve all its annuity offerings for each distributor down to the state level planned product roll outs and integration with straight through processing. Over time, carriers experience less NIGOs (applications deemed Not In Good Order) and breakage, resulting in reduced acquisition costs.”
The IRS has released Revenue Procedures 2020-45 and 2020-32, which set forth the 2021 inflation-adjusted limits for certain employee welfare benefit plans and the dollar amounts used for certain discrimination testing, according to a bulletin published by the Wagner Law Group.
Health FSAs. The 2021 limit for employee salary reduction contributions to health flexible spending accounts will remain at $2,750. If the cafeteria plan permits the carryover of unused amounts, the maximum carryover amount is $550.
Health Savings Accounts. The 2021 limit on contributions to health savings accounts (“HSA”s) increases to $3,600 (up from $3,550) for a self-only HSA, and $7,200 (up from $7,100) for a family HSA. For 2021, the minimum deductible required for a high deductible health plan (“HDHP”) remains (unchanged from 2020) at $1,400 for employee-only coverage, and $2,800 for family coverage. The maximum out-of-pocket amount for an HDHP (including deductibles, co-payments and other amounts, but not including premiums) cannot exceed $7,000 (up from $6,900) for self-only coverage and $14,000 (up from $13,800) for a family.
Dependent Care. There were no changes to the limits for dependent care flexible spending account contributions, and the maximum tax-exempt benefit from a dependent care assistance plan remains at $5,000 ($2,500 if married and filing separately), as this amount is not indexed to inflation.
Transportation and Parking. For 2021 the qualified transportation benefit limit for transit passes and for qualified parking remains at $270 per month.
Highly Compensated Employee. “Highly compensated employees” (or “HCE”s) must be determined for several welfare plan nondiscrimination tests. For the 2021 plan year, the IRS announced in Notice 2020-79, that an employee who earns more than $130,000 in 2020 is an HCE.
Patient-Centered Outcomes Research Institute (“PCORI”) Fee. As a reminder, the Further Consolidated Appropriations Act, 2020 (enacted last December) extends the PCORI fee obligations for ten years. While it was set to expire for policy/plan years ending on or after October 1, 2019, the fee will continue to be assessed through 2029. To date, the IRS has not yet released the PCORI fee amount for the 2021 plan year.
Revenue Procedure 2020-45 is available at: https://www.irs.gov/pub/irs-drop/rp-20-45.pdf, and Revenue Procedure 2020-32 is available at: https://www.irs.gov/pub/irs-drop/rp-20-32.pdf.
The 2019 total US professionally managed market at $51.5 trillion, according to Cerulli Associates.
The split of US professionally managed assets continues to favor institutional client channels (53.8%) over retail client channels (46.2%), although retail client channel marketshare has increased by 5.2 percentage points since 2009, according to Cerulli’s latest report, “The State of US Retail and Institutional Asset Management 2020.”
Retail and institutional distribution is increasingly intermediated by third parties. In retail client channels, the share of assets that move through the third-party distribution channel has increased from 72.8% in 2014 to 74.3% in 2019. Similarly, the share of institutional client assets moving through third-party distribution has climbed from 45.6% to 53.6%.
“Centralized influence points, such as investment consultants and broker/dealer (B/D) home offices, can help amplify distribution efforts as they provide a single point of contact for what is the potential of multiple client relationships,” said Brendan Powers, associate director, in a press release.
B/D-affiliated financial advisors are shifting to fee-based business models and increasingly adopting asset allocation model portfolios, emphasizing a focus on financial planning and delivering holistic advice.
“In this case, platform shelf space and model inclusion will be gate-kept by the home office,” adds Powers. The collective bargaining power and negotiating skills of investment consultants on the institutional side means that the fee negotiation process will be a challenging part of winning new business.
Investors and their intermediaries have access to a greater variety of vehicles. The report cites that open-end mutual funds (31.7%) and institutional separate accounts (22.4%) hold 54.2% of US professionally managed assets. However, both vehicles’ five-year compound annual growth rates lag those of model-delivered and manager-traded dual-contract separate accounts, exchange-traded funds (ETFs), and collective investment trusts (CITs).
“Investors are increasingly open to vehicles beyond traditional open-end mutual funds and institutional separate accounts. Cost, transparency, and customization are becoming increasingly important attributes,” Powers said. “Looking forward, asset managers should be focused on building out new investment vehicle capabilities to the extent that they can provide more flexibility to clients in selecting how they want to consume the strategies their firm offers.”
Add “survival pessimism’—not expecting to live very long in retirement—to the list of reasons (along with high costs, illiquidity and complexity) why relatively few older people buy life annuities, according to a new working paper from the National Bureau of Economic Research.
Researchers Cormac O’Dea and David Sturrock reached that conclusion after analyzing survey data from the English Longitudinal Study of Aging, a biennial survey of English households over the age of 50, in which individuals are asked about their expected lifespans with mortality data that reveal actual lifespans.
On average, individuals underestimated their lifespan during their 50s, 60s, and 70s. Those in their early 60s underestimate the likelihood that they will survive to age 75 by more than 25 percentage points, on average, and those in their early 70s underestimate survival to age 85 by more than 15 percentage points. Sturrock and O’Dea reported their findings in a new paper: “Survival Pessimism and the Demand for Annuities” (NBER Working Paper 27677).
Ironically, people in their late 80s tended to overestimate their remaining life expectancies.
Survival pessimism may explain why people think annuities, which reward longevity, offer poor value. The researchers estimate that 88% of individuals would view as unfairly priced an annuity that is in fact priced fairly for someone of their age, sex, and year of birth.
Depending on their attitude toward risk, however, even survival pessimists may still buy annuities they regard as overpriced rather than stay uninsured. The researchers apply a lifecycle model that accounts for individuals’ patience and their attitude to risk to estimate the demand for annuities.
In their model, individuals who do not discount the future [i.e., do not suffer from “present bias,” the tendency to value spending in the future less than spending in the present] at all would all purchase annuities if they knew their lifespans. When they base their decisions on expected lifespans, recognizing survival pessimism, however, the rate of annuitization falls to between 42% and 64%, depending on the individual’s aversion to risk.
For individuals with positive discount rates toward the future, the level of desired annuitization is lower, but the drop in annuity demand from survival pessimism is still substantial.
Low payouts because of market imperfections such as adverse selection in the pool of annuity buyers may also explain low demand, the researchers note. They estimate that the impact of survival pessimism on the demand for annuities is comparable to the impact of offering payouts that are 82% of the actuarially fair payout using population mortality rates. The effect of individuals underestimating their lifespans may have as strong an effect as these market imperfections.
© 2020 RIJ Publishing LLC. All rights reserved.

Here’s is the text of the statement the Fed issued November 5:
The Federal Reserve is committed to using its full range of tools to support the U.S. economy in this challenging time, thereby promoting its maximum employment and price stability goals.
The COVID-19 pandemic is causing tremendous human and economic hardship across the United States and around the world. Economic activity and employment have continued to recover but remain well below their levels at the beginning of the year. Weaker demand and earlier declines in oil prices have been holding down consumer price inflation. Overall financial conditions remain accommodative, in part reflecting policy measures to support the economy and the flow of credit to US households and businesses.
The path of the economy will depend significantly on the course of the virus. The ongoing public health crisis will continue to weigh on economic activity, employment, and inflation in the near term, and poses considerable risks to the economic outlook over the medium term.
The Committee seeks to achieve maximum employment and inflation at the rate of two percent over the longer run. With inflation running persistently below this longer-run goal, the Committee will aim to achieve inflation moderately above two percent for some time so that inflation averages two percent over time and longer-term inflation expectations remain well anchored at two percent. The Committee expects to maintain an accommodative stance of monetary policy until these outcomes are achieved.
The Committee decided to keep the target range for the federal funds rate at 0 to 0.25% and expects it will be appropriate to maintain this target range until labor market conditions have reached levels consistent with the Committee’s assessments of maximum employment and inflation has risen to two percent and is on track to moderately exceed two percent for some time. In addition, over coming months the Federal Reserve will increase its holdings of Treasury securities and agency mortgage-backed securities at least at the current pace to sustain smooth market functioning and help foster accommodative financial conditions, thereby supporting the flow of credit to households and businesses.
In assessing the appropriate stance of monetary policy, the Committee will continue to monitor the implications of incoming information for the economic outlook. The Committee would be prepared to adjust the stance of monetary policy as appropriate if risks emerge that could impede the attainment of the Committee’s goals. The Committee’s assessments will take into account a wide range of information, including readings on public health, labor market conditions, inflation pressures and inflation expectations, and financial and international developments.
Voting for the monetary policy action were Jerome H. Powell, Chair; John C. Williams, Vice Chair; Michelle W. Bowman; Lael Brainard; Richard H. Clarida; Mary C. Daly; Patrick Harker; Robert S. Kaplan; Loretta J. Mester; and Randal K. Quarles. Ms. Daly voted as an alternate member at this meeting.
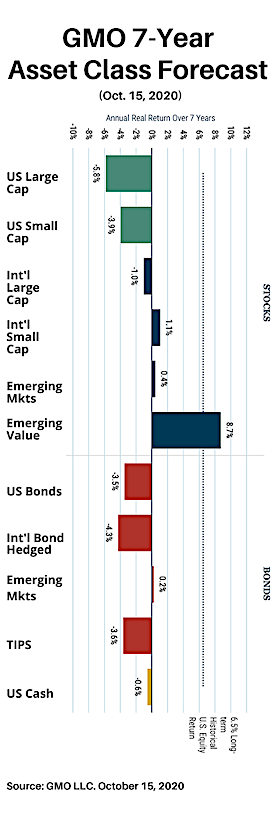
As we “go to press” on the morning of Nov. 6, Joe Biden appears to have been elected the 46th president of the United States. If so, his lead of four million votes nationally should remove any doubt of the legitimacy of his victory. Whether he can push the Democratic policy agenda through Congress remains to be seen.
What kind of retirement policies will we see from a Biden administration?
Biden has already published a Social Security plan. He would presumably try to prevent the 25% across-the-board cut in benefits that might occur if no remedial action is taken. His plan raises taxes on those earning $400,000 per year, but it doesn’t close the program’s funding gap. I expect him to come up with a plan that does.
Biden would appoint a new Labor Secretary. He is not likely to nominate a fox to guard the DOL poultry. That is the situation today, where a attorney known for helping corporations frustrate the intent of labor laws has been Secretary for over a year. Biden could appoint Bernie Sanders. That would be newsworthy.
Here’s a guess: A blue Labor secretary would take issue with some of the elements of the SECURE Act. The Obama DOL was skeptical of the consumer-friendliness of both variable and fixed index annuities. As it stands, the SECURE Act does not restrict plan sponsors or life insurers from offering those products in 401(k) plans.
A Biden appointee might feel differently. But Biden has represented Delaware for decades. The tiny coastal state is a famously corporation-friendly space. On the other hand, Biden has promised to help labor unions. The post-1980 US economy has been built on the diminution of trade union clout; that trend helped turn the Rust Belt red. If Biden keeps his promise to workers, Democrats might succeed in weakening the Republican’s near-monopoly on the loyalty of white men without college degrees.
Ideally, Biden will surround himself with advisors who understand how the financial system in the US actually works. I expect his opponents to revert to the false mantra that US fiscal policy is hopelessly hobbled by the national debt and by the massive budget deficits that his predecessors—Democrat and Republican—left behind. He shouldn’t allow that to happen.
Trillion-dollar bailouts of the financial sector in 2008 and 2020 have awakened many Americans to the reality that Uncle Sam has virtually unlimited credit. To a degree that no other sovereign country enjoys, our government’s IOUs (dollars and bonds) are accepted as money, not only domestically but throughout the world.
We need a president who can persuade skeptics that, in the reality, the government—and the country—is never “broke.” Biden might point out that Americans earn about $18 trillion a year and spend about $13 trillion per quarter on goods and services. Americans have saved about $32 trillion for retirement. US financial professionals manage $51.5 trillion in assets (2019), according to Cerulli Associates.
If you counted up all of the assets that can be bought for US money in the US—not just financial assets but everything from land and minerals to intellectual property and college educations—it becomes obvious that we have virtually infinite resources to bank on. Whether we apply the word “trillion” to assets or liabilities, the T-word should no longer scare us. We’re bigger than that.
(c) 2020 RIJ Publishing LLC. All rights reserved.
Retirement policy has been one of the few topics, aside from tax cuts, that Democrats and Republicans can agree on. Congress passed the SECURE Act in 2019. Now red and blue House members have collaborated on a sequel: The Securing a Strong Retirement Act of 2020, or as some are calling it, SECURE 2.0.
The newest proposal, announced this week, builds on last year’s SECURE (Setting Every Community Up for Retirement Enhancement) Act in removing regulatory snags and stumbling blocks that have vexed life insurers, asset managers and retirement plan providers for years. Both bills reflect many specific requests from the retirement industry and its attorneys.
At first glance, the new bill lacks the potentially game-changing elements in the SECURE Act, which opened the gate for the creation of giant 401(k) plans that many unaffiliated companies could join, and took steps to reduce the legal liabilities of employers who offer annuities as investment options in their plans.
Among other things, SECURE 2.0 would:
The most surprising provision in this new bill might be the requirement that workplace retirement plan sponsors auto-enroll newly eligible employees into a plan and begin automatic contributions of up to 10% of pay. (Employees may still opt-out of their plans.) This almost sounds like a mandate—which are frequently unpopular.
The QLAC relief is welcome. It adds much-needed flexibility to these deferred income annuities, which have been underused in their current form. Under the existing rules, the tax breaks were too meager to spark much interest among the retirees who could best afford to take advantage of them.
In SECURE 1.0, I thought Congress may have missed an opportunity in not connecting the provisions that lower barriers to annuities in plans with the provisions that enable the creation of multiple employer plans, or MEPs or pooled employer plans (PEPs). Offering annuities through MEPs seems promising: There would be greater economies of scale, and the sponsors of MEPs or PEPs will likely be more financially sophisticated than traditional plan sponsors (i.e., employers).
The tweaks in these two acts of Congress may facilitate healthy change in the retirement world, but I can think of changes that life insurers, plan participants and retirees might welcome more: A less repressive interest rate environment, significant mandatory employer contributions to defined contribution accounts (as in Australia, for instance); and, most of all, a resolution of the suspense over the future of Social Security benefits.
Tweaks to the defined contribution system are welcome, but Social Security remains the most important source of retirement income for the majority of Americans. If Congress can collaborate on retirement legislation, maybe they can collaborate on eliminating the technical shortfall in funding that Social Security faces.
(c) 2020 RIJ Publishing LLC. All rights reserved.

The viability (survival) of a retirement portfolio is a function of the withdrawal rate each year and the performance of the portfolio in that same year. For retirees, a key concern is a bad sequence of portfolio returns within the first five to six years after they begin taking withdrawals. Other important variables include the asset allocation of the portfolio (the driver of performance) and the total portfolio cost (the expense ratios of the underlying investments plus the adviser’s management fee).
In this study, I find that retirees face little danger of portfolio failure after the first five years or after 25 years, assuming:
In the process, I also find that percentage-based withdrawal strategies (such as the RMD rules) are superior to withdrawals of fixed dollar amounts adjusted upward each year for inflation.
The study employs an Excel-based tool that allows a retiree (or pre-retiree) to visualize the dynamics of retirement portfolio durability (survival), based on the nominal performance of the financial markets over 70 rolling 25-year periods from 1926 to 2019. The impact of taxes was not considered.
I’ve used this spreadsheet tool in my research for many years. The tool accommodates many different sets of assumptions—about withdrawal rates, asset allocations, retirement ages, life expectancies and portfolio balances—based on each client’s circumstances. Because it relies on past performance and on average annual withdrawals, it can’t be used to make firm predictions. But by helping people visualize the range of possible outcomes that stem from a particular withdrawal strategy, it can help foster a client’s confidence in the future and have a calming influence during market downturns.
Core asset classes since 1926
There are four core asset classes that we can measure back to 1926: US bonds, US large cap stock, US small cap stock, and cash. These asset classes represent the building blocks of a retirement portfolio.
Over the 94-year period from 1926 to 2019:
Other asset classes were not included because they lacked at least a 94-year performance history.
As shown in Figure 1, there is a strong case for optimism among retirees using the RMD strategy, starting at age 72. Given the $1 million starting balance (as shown by the dotted red line in the graph), the average portfolio balance after five years of RMD-based withdrawals was $1.245 million (as shown by the dotted black line) and after the full 25 years of withdrawals the average portfolio balance was $1.429 million (as shown by the blue vertical bars). In short, if the retiree withdraws only the amount of money specified by the RMD (and no more) a diversified retirement portfolio stands a good chance of growing over time.
Figure 1. 94-Year Analysis of a Four Asset Retirement Portfolio
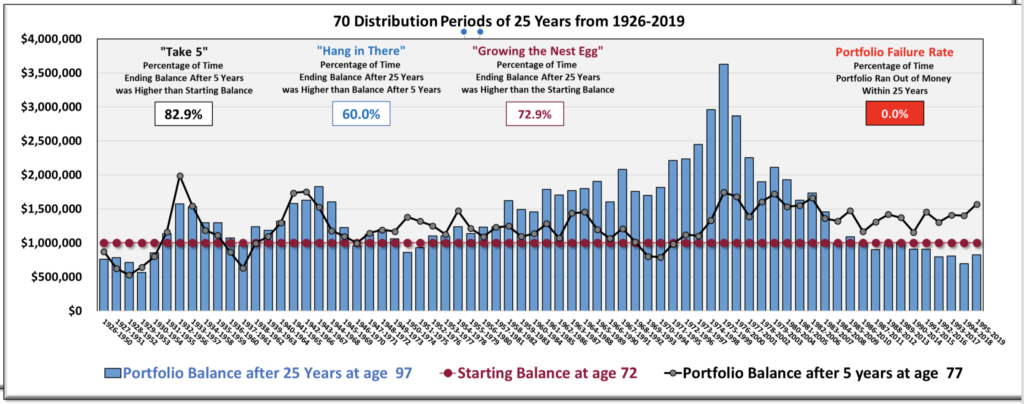
The graph visualizes the experience of 70 different retirees, each starting his or her retirement one year after the last. The first person retired in 1926 at the age of 72 and withdrew money (based on the current RMD divisors) for 25 years. At the age of 97 (in the year 1950) that retiree’s portfolio balance was about $750,000 (as shown by the leftmost vertical blue bar).
The next person retired in 1927 and experienced a different sequence of returns. Her ending account balance 25 years later (1951) is shown by the second blue bar (about $780,000). The 70th person retired in 1995 with an ending account balance in 2019 of roughly $800,000.
Among these 70 hypothetical retirees, the average annual withdrawal over their respective 25-year withdrawal periods (up to the age of 97) was $106,104 (see Table 1). The average ending account balance after 25 years was $1,429,371—or more than $400,000 larger than their starting balance (in nominal terms).
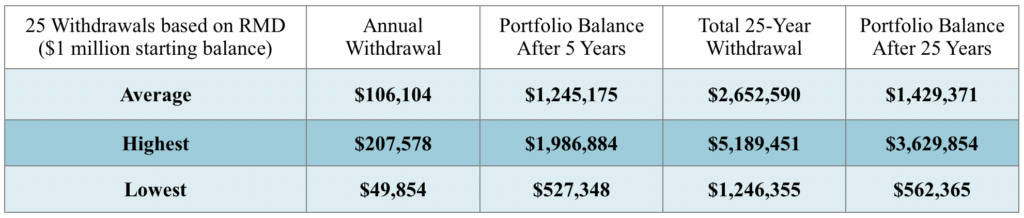
Note the three summary statistics in the upper left corner of Figure 1. The first is called “Take Five.” It represents the frequency at which the portfolio balance after five years of annual withdrawals exceeded the starting balance. Based on our assumptions, this occurred 82.9% of the time. The relationship between the dotted black line and the dotted red line allows retirees to see that their portfolios can in many cases grow over the course of retirement.
The second statistic is “Hang in There.” It represents the percentage of time the portfolio balance after 25 years exceeded the account balance at five years. The relationship between the horizontal dotted black line and the vertical blue horizontal bars visualizes this fact. In two cases, the portfolio was “underwater” (below the starting value of $1 million) after 5 years, but rebounded to finish well above $1 million after 25 years. These long-term views help protect clients from the effects of “recency bias” (extrapolating a recent trend into the future) and helps them avoid panic-based decisions after a market hiccup.
Said differently, a rough initial sequence of returns does not necessarily presage that the portfolio will die an early death. So, the client can hang in there. This statistic shows that, even after a poor five-year performance, a retirement portfolio is likely to rebound more than half the time. The portfolio glass is actually more than half-full. Sadly, many retirees operate with a fear-based “glass half empty” mindset when it comes to the durability of their portfolios. This analysis help change pessimism to optimism.
The third statistic in Figure 1 is “Growing the Nest Egg.” It refers to the percentage of time that the ending account balance exceeded the starting balance after 25 years on a nominal basis. Based on our assumptions, this occurred nearly 73% of the time over the 70 rolling 25-year periods in this analysis. That’s another reason for the retiree to feel optimistic about the future.
Does optimism fade at some point?
So far, we have only examined a portfolio that uses the annual RMD withdrawal starting at age 72 (and no withdrawals in excess of the RMD). What if a person starts withdrawing from a portfolio that is not subject to the RMD, and is uncertain how much to withdraw each year? Below is a summary of the outcomes 25 years later, based on a variety of annual withdrawal rates from the same portfolio described above. As in Table 1, the results shown in Table 2 are based on 70 rolling 25-year periods from 1926-2019.
Table 2. Withdrawing a fixed percentage of the portfolio balance at the end of each year
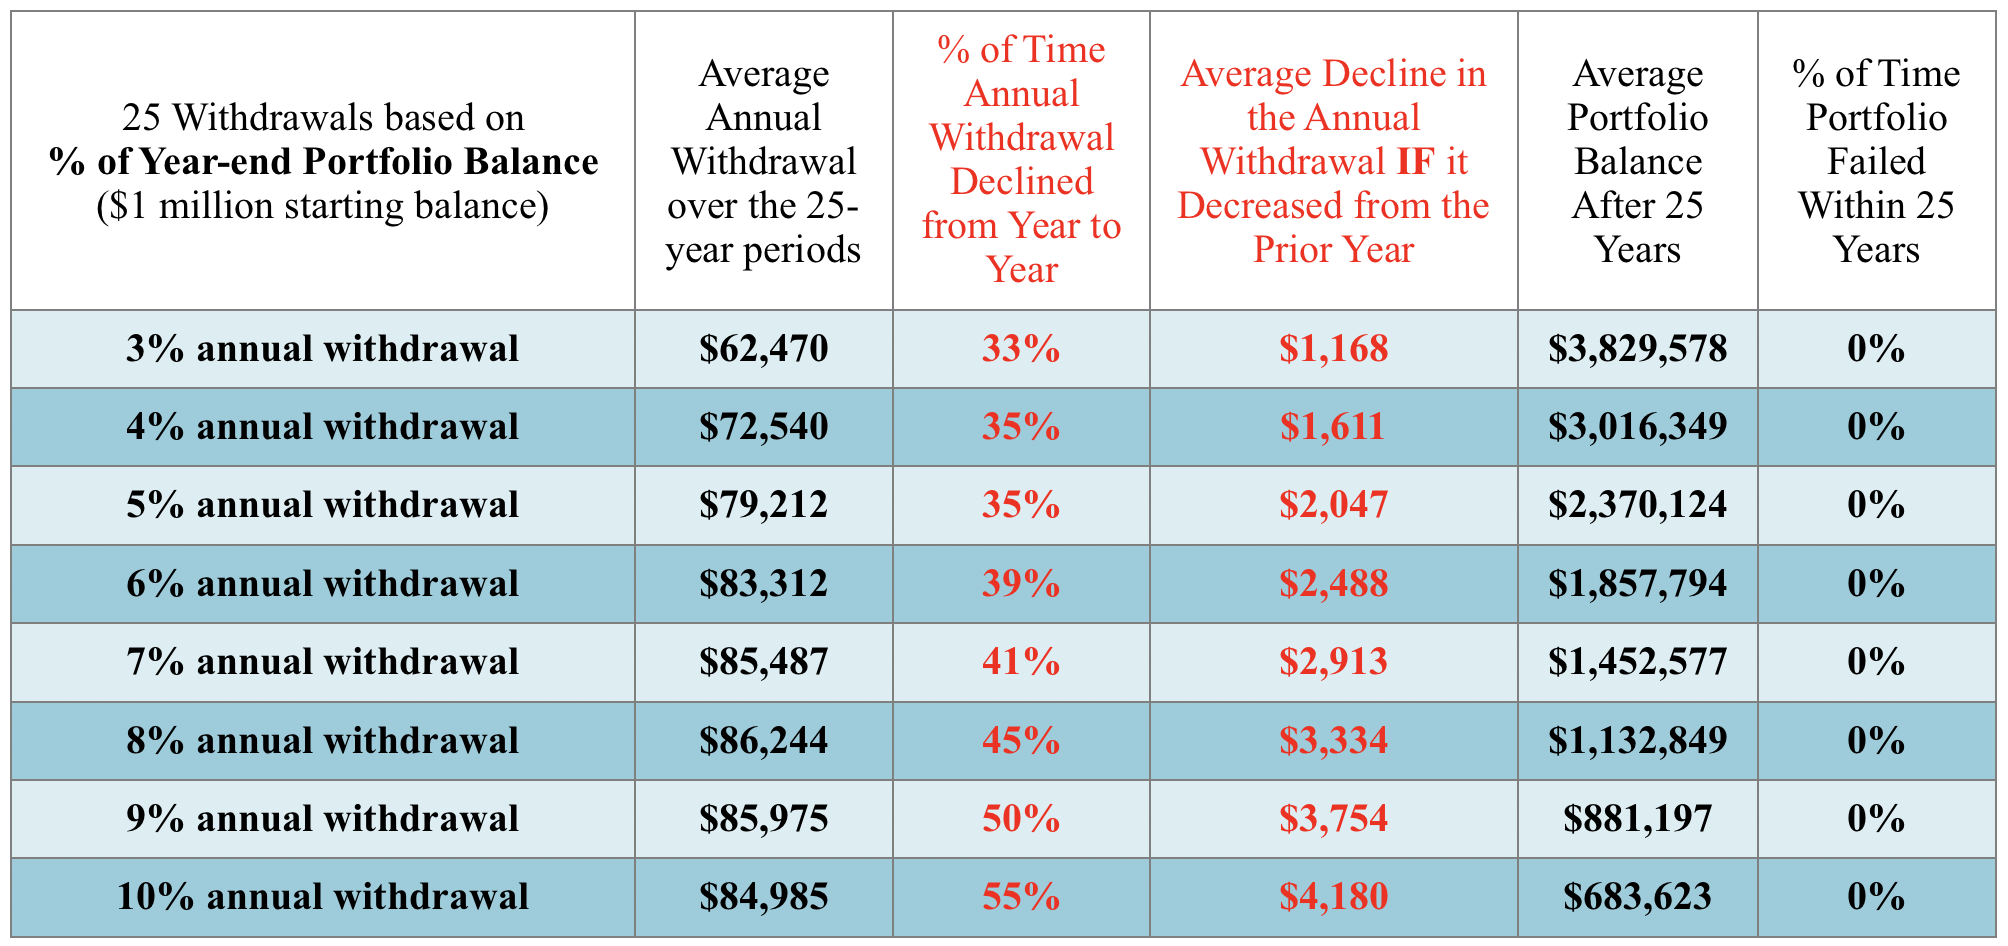
As you can see, the higher the withdrawal rate, the greater the chance that income would decline from one year to the next, and the greater the drop in income when a decline occurs. But, again, this analysis can be encouraging for the client. The drop in income never exceeds five percent and, because we adjust income downward after a down year in the market, the portfolio never fails in the long run.
Table 3. Withdrawing an inflation-adjusted amount each year
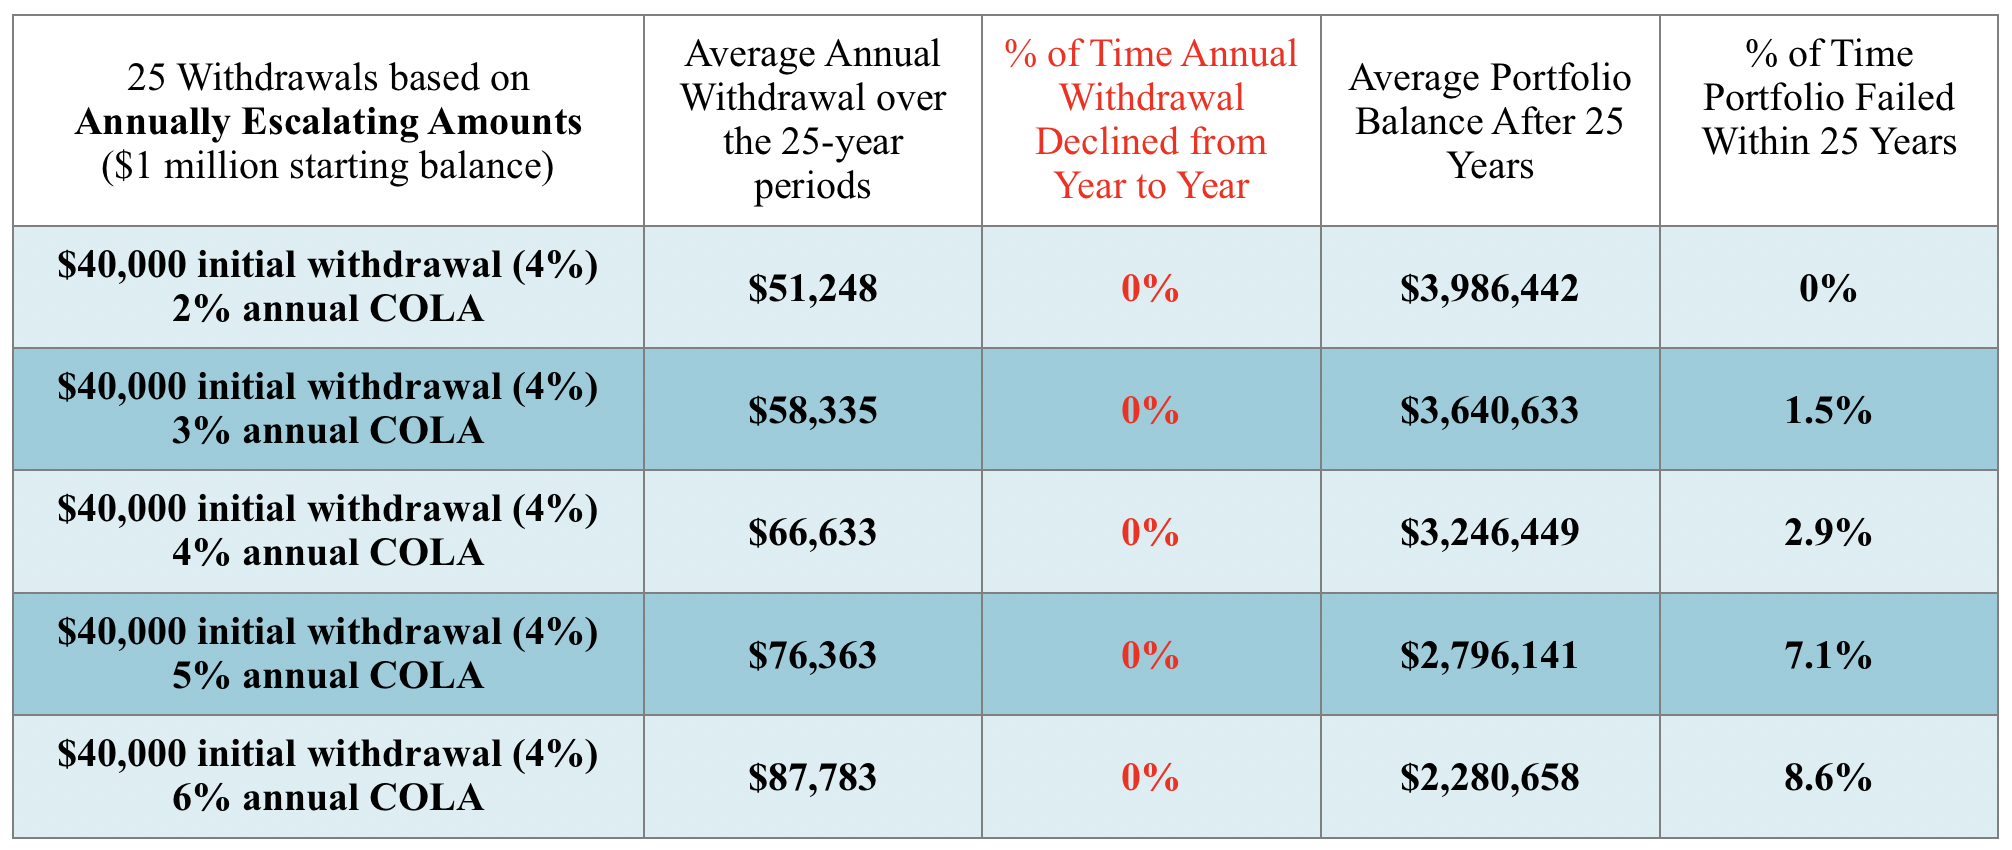
Table 3 offers scenarios where the annual withdrawal percentage is raised to keep pace with increasing expectations for inflation. For this more aggressive withdrawal strategy, the results are not as encouraging. A retirement portfolio is much more likely to experience long-range failure when a fixed, inflation-adjusted withdrawal strategy replaces a percentage-based withdrawal strategy.
The spreadsheet I’ve introduced is a powerful teaching tool. It allows an advisor to engage a client in a conversation that involves a variety of “what-if” scenarios that can be visualized within seconds. To schedule a demonstration of the spreadsheet please contact the author via email at [email protected].
© 2020 Craig Israelsen. Used by permission of the author.

Three major publicly held annuity issuers have announced major restructuring moves—a signal that COVID-19 and low interest rates are adding fuel to a life/annuity industry shakeup that began soon after the 2008 financial crisis and has only accelerated since.
Here’s what happened this week:
These deals are allowing established annuity issuers to improve their balance sheets by transferring business they don’t want to reinsurers or a new breed of “insurance solutions” providers who do want it. It’s also unlocking hundreds of millions of dollars of reserve capital that Equitable and Great American can apply to more profitable business lines, new ventures or share buybacks.
“The long-dated liabilities associated with many life insurance and annuity contracts are under pressure from declining investment returns, while other businesses (property/casualty insurance, group businesses, international operations) are now viewed more favorably by institutional investors in publicly traded stock,” said ALIRT, the insurance research firm, in a report issued Wednesday.
Equitable Holdings (formerly part of AXA, the French financial giant) agreed to a deal where Venerable Holdings, Inc., will reinsure legacy “Accumulator” variable annuity policies sold between 2006-2008 backed by approximately $12 billion of general account assets.
“The transaction accelerates the Company’s strategic actions to de-risk its balance sheet and shift towards less capital-intensive businesses,” Equitable said in a release this week. AllianceBernstein will be the preferred investment manager for the assets.
As part of the transaction, which is expected to close in the second quarter of 2021, Venerable will buy Equitable’s runoff variable annuity reinsurance entity, Corporate Solutions Life Reinsurance Company.
Source: Equitable.
The transaction will generate “approximately $1.2 billion of value for Equitable Holdings on a Statutory basis, which includes an expected $800 million capital release, a positive ceding commission and consideration for Corporate Solutions Life Re totaling approximately $300 million subject to adjustment, and approximately $100 million in tax benefits, according to an Equitable release. Equitable called it a first-ever deal to reinsure a block of variable annuity business.
Equitable’s board has approved share repurchases of $500 million in 2021, subject to the close of the Venerable deal. Voya Investment Management will continue to be the preferred asset manager for Venerable’s existing book of business.
As part of the transaction, Equitable Holdings is discussing taking a 9.9% equity stake in Venerable’s parent, VA Capital Company LLC, including a board seat. Equitable will continue to administer the variable annuity contracts for the contract owners.
In another multi-billion dollar deal, Great American Life’s parent, American Financial Group, Inc., agreed to a deal where Commonwealth Annuity and Life Insurance Co. will reinsure $5.1 billion worth of fixed indexed annuities and $600 million worth of fixed annuities issued by Great American, taking on both the liabilities and the underlying assets.
The blocks represent about 15% of Great American’s in-force annuity business. Commonwealth is a unit of Global Atlantic Financial Group, which is being acquired by private equity giant KKR.
The deal will improve the profitability of the $34 billion in annuity reserves that Great American is keeping. “The assets transferred under the agreement have a lower average yield than AFG’s overall annuity portfolio yield, and the policies ceded have an overall cost of funds that is higher than that of AFG’s retained business,” a press release said. “AFG expects to earn an increase in the net interest spread on its retained $34 billion of annuity reserves.”
The deal will also release capital that was backing the blocks. According to the release, “As a result of the assets and reserves transferred in this transaction, this agreement is expected to free up between $300 million and $325 million of Great American’s statutory capital in the fourth quarter of 2020. The transaction is expected to create $375 million to $400 million of additional excess capital for AFG.”
Last Monday, American International Group, Inc. (AIG) announced its intention to separate its Life & Retirement business from AIG in order to “create value for shareholders and benefit all stakeholders,” according to an AIG release.
AIG also announced that Peter Zaffino, AIG’s current President, will become AIG’s Chief Executive officer in March 2021 (succeeding Brian Duperreault).
Like Equitable and Great American, AIG has engaged in reinsurance transactions. According to ALIRT, in 2018, the AIG life insurers entered into a reinsurance agreement with Fortitude Re (previously an affiliated company) to reinsure certain closed blocks of life, health, and annuity business.
AIG has sold the vast majority of Fortitude Re and retains a small (3.5%) ownership stake in the company. The reinsurance transactions were executed on a modified coinsurance basis, and as a result the AIG U.S. life insurers (AGL, USLNY, and VALIC) retain the legal control of the policy liabilities and the assets that are in support of those liabilities.
AM Best commented on Tuesday that the Long-Term Issuer Credit Rating (Long-Term ICR) of “bbb” of American International Group, Inc. (AIG) (headquartered in New York, NY) remains unchanged following its announcement to pursue a separation of its life and retirement business.
“Historically, the consolidated group has benefited from the operational profitability and diversification brought by AIG L&R,” AM Best said in a release. “However, AM Best notes the significant changes in underwriting, volatility reduction actions taken through reinsurance purchases and product portfolio repositioning that have been implemented at AIG PC over the last few years, all of which have improved AIG PC’s operational profile.
AM Best also has commented that the Financial Strength Rating (FSR) of A (Excellent) and the Long-Term ICRs of “a” of AIG’s property/casualty insurance subsidiaries (collectively referred to as AIG PC) remain unchanged. Concurrently, AM Best has commented that the FSR of A (Excellent) and the Long-Term ICR of “a” for the members of the AIG Life & Retirement Group (AIG L&R) also remain unchanged. The outlook of these Credit Ratings (ratings) is stable.
(c) 2020 RIJ Publishing LLC. All rights reserved.
