Top 25 US Life and Fraternal Insurance Groups and Companies
IssueM Articles
The challenges posed by an aging population are manifold, and they are neither new nor unique. The populations of Italy and Japan have been declining for some time, and in the US, numerous state governments’ large unfunded pension liabilities are a chronic problem.
While low interest rates in most advanced economies have held down governments’ borrowing costs, they pose significant challenges for pension asset management. In real (inflation-adjusted) terms, returns on Japanese, German, and other European sovereign bonds have been negative for some time.
Short-term interest rates on US Treasuries may have drifted higher as the Federal Reserve began to unwind its post-crisis stimulus policies (and may edge higher still after the Fed’s current pause), but longer-term US interest rates remain low by historical standards.
The two decades after World War II, as one of us has documented, were also characterized by low real returns on government bonds in both the US and elsewhere. Unlike now, however, that era boasted a much younger and faster-growing population. Furthermore, households had trivial debt levels by modern standards. The solvency of pension plans was not yet a concern.
Regardless of whether yields in advanced economies rise, fall, or stay the same, core demographic trends are unlikely to change in the coming years, implying that pension costs will continue to balloon. Since the creation of the US Social Security system in 1935, Americans’ life expectancy has risen by almost 17 years, while the retirement age has risen by less than two years. In 1946, the assets of pensions amounted to about 29% of US GDP; they have almost quadrupled since then.
Understandably, the search for higher yields has become a higher priority, even for fully-funded pension plans. When unfunded liabilities (which represent the assets that pension funds will have to purchase in the future to meet their obligations) are included, the magnitudes soar even higher.
The search for higher returns has led US pension plans (excluding that of the federal government) to tilt toward equity markets in recent years. This trend has been evident among other investors as well, including some of the world’s largest sovereign wealth funds.
But our recent work with Josefin Meyer suggests that another asset class can provide real long-term returns above those of “risk-free” US government securities. In our study, we focus on external sovereign bonds and compile a new database of 220,000 monthly prices of foreign-currency government bonds, covering 91 countries, traded in London and New York between 1815 and 2016.
Our main insight is that, as in equity markets, the returns on external sovereign bonds (largely bonds issued by emerging market countries and now-advanced economies) have been sufficiently high to compensate investors for risk.
Real ex post returns on external sovereign bonds averaged 7% annually across two centuries, including default episodes, major wars, and global crises. An investor entering this market in any given year received an average excess yearly return of around 4% above US or British government bonds, which is comparable to stocks and higher than corporate bonds.
The observed returns are difficult to reconcile with the degree of credit risk in this market, as measured by historical default and recovery rates. Based on our archive of more than 300 sovereign debt restructurings since 1815, we show that cases of full repudiation of sovereign debt are relatively rare and mostly connected with major revolutions (Russia in the early twentieth century, China’s Maoist regime, Cuba, and the European countries that fell under Soviet control following World War II).
For the full asset class over two centuries, the typical haircut investors suffer in debt crises is below 50% – a smaller haircut than Moody’s estimates for US corporate bonds over the past century.
The main driver of the higher ex post real returns is the comparatively high coupon these sovereign bonds offer. Beyond the return history itself, there is the fact that emerging and developing economies now account for about two-thirds of global GDP, compared to just one-third 50 years ago, when portfolio diversification was almost entirely a domestic affair.
Adding to the attractiveness of a portfolio of emerging-market sovereign securities, its returns are not perfectly correlated with equity returns. Moreover, there is evidence that creditor rights and enforcement powers in external sovereign debt markets have increased in the wake of recent US court judgments.
These findings are not an invitation to embrace indiscriminate risk taking. Another wave of sovereign defaults may be ahead of us, and sovereign bonds can become highly illiquid in distress. Nonetheless, our results highlight the long-term gains from diversification into a growing but relatively under-studied asset class. And for pensions, the risks of relying on assets that offer negative or only very low long-term real returns are no less serious, especially as they compound over time.
Carmen Reinhart teaches at the Kennedy School of Government at Harvard. Christoph Trebesch is a macroeconomist at the Kiel Institute for the World Economy.
© 2019 Project-Syndicate.
Standard theories in financial economics hold that Investors shouldn’t care whether they receive income from dividends or from capital gains, assuming that there are no tax differences and or capital market frictions that favor one over the other.
But that’s not how real people—retirees in particular—actually behave, according to “Monetary Policy and Reaching for Income,” a recent working paper from the National Bureau of Economic Research (NBER Working Paper No. 25344).
The paper shows that when interest rates fall, as they might after a relaxation I the federal funds rates, some interest-and-dividend investors adjust the amount of high dividend paying stocks in their portfolios.
Authors Kent Daniel and Kairong Xiao of Columbia and Lorenzo Garlappi of the University of British Columbia analyzed individual portfolio holdings at a large discount broker over the period 1991-96 for 19,394 households.
They merge the portfolio data with the CRSP (Center for Research in Security Prices) stock database, and determine income and pricing for the stocks in each individual portfolio. The average dividend yield of the stocks in the sample was 2.1%. “High income yield” stocks were defined as those with dividend yields above the 90th percentile, or 5.7%.
Using the CRSP Survivor-Bias-Free US Mutual Fund Database, which provides mutual fund income yields, asset flows, returns, size, expenses, and volatility from January 1991 to December 2016, the authors analyze rotations of fund flows following a decrease in the federal funds rate. The average yield of equity mutual funds was 1.3% and the yield at the 90th percentile was 2.8%.
In the six months after a one percentage point drop in the federal funds rate associated with accommodative monetary policy, households raise the share of their portfolio in stocks paying high dividends by 0.95 percentage points.
Over the following three years, the researchers find a 5.2 percentage point increase in inflows to equity mutual funds with high income-yields. An accommodative monetary policy appears to reduce portfolio diversification and increase the value of high dividend stocks relative to low dividend stocks.
To disentangle monetary policy changes from other economic changes, the researchers compare changes in holdings of individual stocks by households in different Metropolitan Statistical Areas. The demand for dividends was negatively related to local area bank deposit rates, suggesting that local bank deposit rates “provide a more accurate measure of available sources of income for local investors than the Fed Funds rate.”
The researchers suggest that reaching for income can be an optimal investment strategy if investors try to discipline themselves by restricting their spending to the income from their portfolios. The investors who reach for income are disproportionately those with low labor income, such as retirees.
© 2019 RIJ Publishing LLC. All rights reserved.
Prudential Financial, Inc., is asking employers to add an after-tax emergency savings feature to their 401(k) plans to help workers save for unexpected expenses.
The emergency savings feature, which is part of Prudential Retirement’s “financial wellness” offerings, gives workers an alternative to savings and investment accounts outside the workplace. It also helps stop the drain on pre-tax retirement contributions.
Linking emergency savings to an employer-sponsored retirement plan provides other benefits such as no minimum account balance and lower investment fees than a worker might pay at a brokerage, a Prudential release said.
The feature allows employees to withdraw their after-tax savings if an emergency arises, while preserving the before-tax retirement contributions. Any earnings that are withdrawn are subject to taxation as well as a 10% premature distribution tax, if withdrawn before age 59½.
Just 26% of Americans are on track toward building an emergency savings account, Prudential’s 2018 Financial Wellness Census found. Only an estimated 15% of millennial and Gen X veterans are on track toward building an emergency savings account.
During the partial government shutdown earlier this year, nearly half of affected federal workers fell behind in paying bills and 83% reported higher overall stress levels, a 2019 Prudential survey found. Earlier research found that most Americans cannot pay for a $500 emergency.
After-tax contributions are the least used of the three retirement savings options available to most private sector workers, including before-tax contributions and a Roth 401(k) option. Just 14.6% of employers offer an after-tax savings option within their 401(k) plan, according to 2016 Plan Sponsor Council of America data.
In 2018, Prudential Retirement introduced an emergency savings feature for workplace 401(k) plans to provide employees the opportunity to make after-tax payroll contributions alongside before-tax contributions.
Prudential has offered its own employees an after-tax savings feature through its 401(k) plan for many years, along with before-tax and Roth 401(k) contribution options.
Under The Travelers’ “Paying It Forward Savings Program,” employees of The Travelers Companies, Inc., can make payments toward student loans that will qualify for the company’s 401(k) plan matching program.
As part of its benefits package, Travelers has a “matching” program for employee contributions to 401(k) accounts. Beginning in January 2020, when The Travelers Paying It Forward Savings Program takes effect, student loan payments will also be taken into account when determining the company’s 401(k) contribution.
“Employees, including those who are not in a position to contribute at all to their 401(k) accounts because of student loans, who participate in the new program could accumulate tens of thousands of dollars in their 401(k) accounts over a decade, which could be worth hundreds of thousands of dollars at retirement,” a Travelers release said.
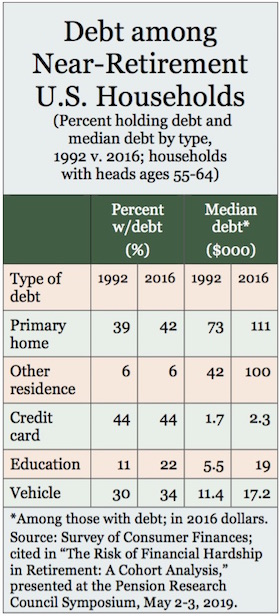
According to the Federal Reserve, student loan debt in the United States reached more than $1.5 trillion at the end of 2018. The Fed’s latest Report on the Economic Well-Being of U.S. Households noted that 41% of 18-to 29-year-olds said they had no retirement savings and that 42% of those who had attended college, representing 30% of all adults, incurred debt for their education.
Athene Holding Ltd., a provider of retirement savings products, has reported a net loss of $104 million $(0.53) per diluted Class A share for the fourth quarter of 2018, down from net income of $439 million ($2.22 per share) for the fourth quarter of 2017, the company reported this week.
“The loss was driven by unfavorable changes in reinsurance embedded derivatives due to credit spread widening, as well as unfavorable changes in fixed indexed annuity derivatives due to equity market depreciation,” a release said.
Net income for the full year 2018 was $1.05 billion, or $5.32 per diluted share, compared to net income for the full year 2017 of $1.36 billion, or $6.91 per diluted share.
Adjusted operating income1 for the fourth quarter 2018 was $240 million, or $1.23 per adjusted operating share, compared to adjusted operating income for the fourth quarter 2017 of $313 million, or $1.60 per adjusted operating share. The decrease was driven by higher other liability costs resulting from equity market depreciation. Adjusted operating income for the full year 2018 was $1.14 billion, or $5.82 per adjusted operating share, compared to adjusted operating income for the full year 2017 of $1.06 billion, or $5.39 per adjusted operating share.
Highlights of Athene’s fourth quarter and EOY earnings report included:
ROE of 12.1%, Retirement Services adjusted operating ROE of 18.4%, and Consolidated adjusted operating ROE of 13.9% for the full year ended December 31, 2018
“In 2018, we continued our disciplined strategy of capital stewardship and opportunistic deployment,” said Jim Belardi, CEO of Athene. “We grew invested assets by more than 45%4, marking 2018 as a year of acceleration for Athene. Our multi-channel distribution model generated record organic growth of more than $13 billion, and this was complemented by closing two inorganic transactions in a calendar year for the first time in our history, totaling an additional $27 billion. Importantly, we underwrote this new business to the same high return standards we have historically.
“In the current environment, it’s clear the market has not properly valued the growing earnings power of our business, so we commenced opportunistic share repurchases totaling $147 million,” Belardi added. “
Since these repurchases were executed at an average share price in line with our initial public offering price more than two years ago, when the size and earnings profile of Athene was significantly less than it is today, we believe this method of capital deployment will prove very accretive.”
© 2019 RIJ Publishing LLC. All rights reserved.
Fixed indexed annuity (FIA) surrender rates climbed in 2017-18, after declining slowly from 2010 to 2016, according to Ruark Consulting LLC. Ruark released the results of its 2019 studies of FIA policyholder behavior this week.
Shock duration surrender rates in the most recent quarter rose to a level last seen in 2009, Ruark found.
“For a product with surrender charges at issue, the shock duration is the first year that the surrender charges are zero,” said Ruark CEO Tim Paris told RIJ. “For a typical seven-year product, the shock duration would be year eight. There tends to be a big uptick—a shock or spike—in surrenders at that time.”
The Ruark studies, which examine the factors driving surrenders, guaranteed lifetime income benefit (GLIB) utilization, and free partial withdrawals, were based on experience from 3.5 million policyholders from 2007 through September 2018.
Fifteen companies participated, with a combined $240 billion in current account values. Highlights of the studies include:
By aggregating data from across the annuity industry, Ruark tries to achieve greater precision in identifying trends than companies could achieve by relying only on their own experience, Paris said in a release. Timothy Paris, Ruark’s CEO in a release.
Detailed study results, including company-level analytics and customized behavioral assumption models calibrated to the study data, are available for purchase by participating companies.
Ruark Consulting, LLC (www.ruark.co), based in Simsbury, CT, is an actuarial consulting firm that provides a platform and industry benchmark for principles-based insurance data analytics and risk management. Ruark collaborates with the Goldenson Center for Actuarial Research at the University of Connecticut.
© 2019 RIJ Publishing LLC. All rights reserved.
The word “risk” means different things to different people. For an investment-oriented advisor, risk-taking is mainly positive: it’s a path to higher returns. If that’s your preference, you probably worry that your clients might take too little investment risk during retirement, or that they might rashly de-risk—by selling depressed assets—during a market correction.
To an advisor whose roots are in the insurance world, or who blends insurance and investment products in retirement, risk is less positive. From that advisor’s perspective, risks represent predictable hazards that clients need to anticipate and prepare for, especially if they want to sleep easily at night during retirement.
Both attitudes toward risk are valid, but I’m approaching it from the second perspective. In an article in last week’s edition of RIJ, I discussed the threat of longevity risk—the risk of outliving one’s savings—in detail. This week, I’ll focus on other, equally important risks: financial risks, health care risks, political risks, and others.
Mackenzie
Low-return risk. Even if life spans were completely predictable, investing at any age is fraught with risk. This is particularly the case today, given the decline in interest rates. With 10-year Treasury bond rates around 2½ percent, their return after inflation and taxes is negative for most investors. A decent rate of return on average requires risk-taking. A portfolio with an investment of 60% in S&P500 index fund and 40% in a bond index fund has a much lower rate of return than it used to.
There is no obvious solution to this basic change in the financial landscape, except perhaps making an extra effort to improve the risk-return tradeoff by lowering investment fees and more importantly, saving more.
Sequence-of-returns risk. Apart from the woefully low rates of return on safe investments, the problem of sequence of returns risk arises with portfolios with variable rates of return. Of two portfolios with the same geometric average return over some given number of years from which a specified stream of withdrawals is being made, the portfolio whose good years occur early will run out less quickly than the portfolio whose bad years occur early.
Sequence-of-returns risk can be reduced by choosing a portfolio with a less variable rate of return, but that will lower the expected rate of return. Sequence-of-return risk does not arise when no withdrawals are being made, as with some endowment funds.
Inflation risk. Inflation risk arises because future rates of inflation are not predictable. It can be seen as a form of financial risk, because it affects the real rate of return on any financial asset whose return is not indexed to inflation. It also creates a risk for recipients of sources of nominally fixed income, like pensions.
Interest rate risk. Even with risk-free assets, interest rate risk arises when the assets are redeemed, and the proceeds have to be reinvested at a lower than expected rate of interest. This problem can be minimized by a laddering strategy: matching the maturity of an asset like a Treasury or bullet bond, to the extent possible, with the year when their proceeds will be spent. Thus, the proceeds of a bond maturing in 15 years should be matched with a reasonable estimate of expenditures expected fifteen years hence. Perhaps the estimate should be conservative, so that any expenditure exceeding it would be financed in other ways. Interest rate risk can be reduced, but not eliminated, in this way.
Perhaps the most basic issue with financial risk is the investor’s attitude toward it. The level of risk of a portfolio should not be so high as to cause the investor sleepless nights. Peace of mind may well require sacrificing high expected returns; but that in turn will require higher saving rates prior to retirement to achieve a given target for retirement income.
For clients who are no longer working or have limited ways of achieving expenditure economies, boosting saving significantly may not be possible. However, advisors of clients who still have some years of work in front of them need to emphasize that shrewd investing alone will not a secure retirement make. They should also recognize that putting in extra years of work to boost income in retirement may not be an option for everyone, particularly for people who have disabilities.
Health care risk. Most Americans aged 65 years and older enjoy a reasonable degree of protection from health care cost risk. Medicare alone provides a fair amount of protection, and the gaps in its coverage can be covered mostly by acquiring a supplementary policy. About six of seven older Americans have this additional coverage. Nonetheless, even this combined coverage does not ensure that all expensive or experimental coverage of prescription medicines or treatment will be covered.
Older Americans not yet eligible for Medicare can be at risk for health care costs that are large enough to force bankruptcy. Employer-provided health care tends to be a feature of larger corporations. Even so, the loss of even a well-paying job can (and usually does) entail the loss of employer-provided health insurance.
While the unemployment rate for older American is lower than the average for all ages, unemployment spells are longer for them. Finding another job, particularly one with comparable salary and benefits, can be a challenge, and individual health insurance is typically very expensive if it is available at all.
Job loss at a relatively advanced age can affect households at all income levels. Medicaid, the poor household’s Medicare, may be available to some households whose members are all less than 65 years of age even if household income exceeds the poverty line, but it is not a universal safety net. The issue of the effects on retirement security of job loss and other non-medical contingencies is taken up again below.
Long-term care cost risk. Most Americans think that Medicare covers long-term care (LTC) costs, but Medicare in fact only covers nursing home stays, post-surgical and the like, for a relatively short period. Medicaid covers the cost of nursing homes and other facilities needed by people who have difficulty coping with daily living requirements. But, unlike the care covered by Medicare, Medicaid coverage requires that participants satisfy certain income and asset tests.
Medicaid’s coverage was initially limited to the very poor. Its coverage subsequently expanded considerably. Under the Supplemental Security Income (SSI) assistance program, most states now offer coverage to people with incomes up to $2,300 a month, or three times the poverty rate for individuals.
However, 33 states offer another “pathway” to Medicaid coverage known as the medically needy program. To be eligible for this program, candidates must finance out of their own pocket expenses equal to the difference between their monthly incomes and a floor set by their state of residence, over a period ranging from one to six months, also set by the state. For example, a state might set an income threshold of $500.
If a candidate for the program had monthly income of $10,000, and the period set for the test was six months, eligibility would require an outlay of 6 x ($10,000 – $500) or $57,000. This is certainly a tidy sum, although not beyond the means of many better-off Americans. Unlike the other tests, even an individual with a high income can become eligible for Medicaid, although the higher the income, the larger the up-front payment.
Certainly, for the poor, and even for many better off families, these financial arrangements make private LTC insurance look unattractive compared to its publicly-provided alternative. Private insurance, if an individual can afford it, has two important advantages, however. First, policyholders are not expected to devote a large chunk of whatever income they may have toward defraying nursing home costs when they become a resident. Second, someone with private insurance will have more control and a wider range of choice of facility. LTC insurance can be a good deal for the better off, particularly if it is offered as a group policy. Investing in a policy while still relatively young is also a good move.
Political risk. The recent annual reports of the Trustees of the Social Security system make clear that the current level of benefits cannot be sustained. Some combination of benefit reductions and/or payroll tax increases must sooner or later take place. The combination of measures that could in principle address the current financial imbalance is virtually without limit, but all would face political headwinds—strong headwinds, in many cases.
Congress cannot continue to kick the can down the road forever. It will have to act sooner or later. What will it do? Politically and morally, reducing the benefits of those already retired is a non-starter, particularly for older retirees, with high-income households a possible exception. The role of the Social Security benefit in the retirement income of wealthy households is rarely great.
Reducing the benefits and/or increasing taxes on workers approaching retirement also seems like a tall order politically. It basically leaves young workers, and young Americans who have yet to earn their first pay check, to take the hit. Consequently, the clients who patronize the RIJ’s advisor-readers may not have much to fear. However, anyone advising younger investors should alert them to the possibility that the implicit rate of return on their payroll tax contributions is sooner or later going to decline.
Of more concern to older Americans may be the parlous state of the finances of Medicare and Medicaid. Cuts in coverage and increases in co-insurance and copayments are not simply remote possibilities. The part of the payroll tax that finances Medicare could also increase. There may be no strategy that advisors could offer their clients to deal with the consequences of political risk, but to be forewarned is at least to be (a little) forearmed.
Other risks. Surveys of retirement confidence by both the Employee Benefit Research Institute (EBRI) and the Society of Actuaries (SOA) reveal a disquieting tendency for older Americans to be uncertain of their ability to deal with unforeseen financial contingencies. Those include not just the big ticket items we have been reviewing, but even comparatively small contingencies, like an unexpected car repair bill.
A recent survey by the Federal Reserve Board found that this is a problem for all ages. Some 40% of survey participants would be hard pressed to meet an unexpected expenditure of $400. The habit of living from paycheck to paycheck is not confined to the poor, however, as the experience of many middle-income federal workers affected by the recent partial shutdown attests.
Regardless of their clients’ income levels, advisors should impress on them the need for a contingency reserve and the importance of saving. Higher rates of saving would allow older Americans to take advantage of formal insurance mechanisms (such as private LTC insurance) and would prevent comparatively minor contingencies from having major financial consequences. Finally, and not to belabor the point: no investment strategy, however brilliant, can make up for an inadequate saving rate.
George A. (Sandy) Mackenzie is a Washington, DC-based economist. After more than 25 years as a staff member of the International Monetary Fund, Mackenzie began to specialize in the economics and finances of retirement. From 2013 – 2018, he was the first editor of the Journal of Retirement. He is the author of Annuity Markets and Pension Reform (Cambridge, 2006) and The Decline of the Traditional Pension: A Comparative Study of Threats to Retirement Security (Cambridge 2015).
© 2019 RIJ Publishing LLC. All rights reserved.

The variable annuity (VA) with a lifetime income rider is a versatile product category that suits our times. It deals with several major risks—market risk, longevity risk, and perhaps even inflation risk—in ways that seem to satisfy the needs of many retirees, distributors and issuers.
With the help of dynamic hedging programs and risk management strategies, it also appears to deliver profit margins that can meet the requirements of life insurers. Certain regulators and Wall Street analysts with memories of the 2008 equity market crash—and its immense cost to many VA issuers—remain wary, however.
One relatively minor but interesting rider design pushes the limits of the flexibility of the VA. These are guaranteed lifetime withdrawal benefits (GLWBs) where the annual payout rate (the maximum income the contract owner may withdraw each year without reducing the guarantee) falls if the account value falls to zero during the owner’s lifetime. Any combination of withdrawals, fees or market depreciation can zero out the account.
Both Pacific Life and Lincoln Financial announced updated versions of these riders in February. RIJ reported on Lincoln’s product two weeks ago. This week we’re looking at the Pacific Life version, a slightly more generous version of a contract that the insurer introduced in 2016.
The idea of reducing the size of the income stream could make sense for retirees who plan to spend more during their initial “go-go” years than during their more advanced “slow-go” and “no go” years. But it also seems somewhat counter-intuitive.
Annuities, in the purest sense, transfer longevity risk from individuals or couples onto life insurance companies. Pooling and the law of large numbers equip insurers to handle that risk. The rider featured here appears to throw a chunk of longevity risk back at the retiree and even suggests a potential conflict of interest for the issuer.
Enhanced Income Select
The Pacific Life rider, Enhanced Income Select, allows contract owners to withdraw up to 8% a year of their contract value (which locks in as the minimum basis for future payouts, barring positive market adjustments or excess withdrawals later on) if they start taking income at age 70 or later. But if the account value drops to zero, the annual withdrawal rate falls back to 3% for the remainder of the contract.
“We have sold this product since May 2016, but we just raised the withdrawal percentages,” Steve Goldberg, associate vice president for annuity product management at Pacific Life, told RIJ this week. “There are three age bands. We raised the withdrawal percentages by 50 basis points each.”
For individuals ages 59½ to 64 the withdrawal rate is now 5.6%. It’s 7.6% for those ages 65 to 69 and 8% for those age 70 or older. “We were able to do that partly because Treasury rates are going up, and it’s cheaper to hedge [the risks],” Goldberg told RIJ in an interview.
Pacific Life designed this product for people age 70 or over who want immediate income at a high initial rate and who may have other sources of income to rely on in case the balance drops to zero and the payout rate drops to 3%. There’s no annual deferral bonus, so clients have no incentive to postpone the income stream. [I’m assuming here that readers know how the benefit base differs the account value, and how the guaranteed payout rate differs from the growth rate of the underlying assets.]
“It’s a rider that’s designed for those looking for higher income earlier,” Goldberg said. “Many people are afraid of running out of money, but it can be more fulfilling for them to have higher income while they are young and active. If the account does run out of money, we assume that the contract owners and their advisors have a plan for that. Also, clients don’t have to take 8%. They can take 6%. There are a lot of options.”
Fees are an important factor here, and Goldberg said that Pacific Life has tried to keep them low. The current rider fee is 1.05% per year for single lives and 1.40% for joint contracts. The so-called mortality and expense risk fee depends on the length of the surrender period: 0.95% for a five-year period, 1.25% for a three-year period and 1.35% for no surrender period.
There’s also a 0.25% annual administration fee. The contract comes with a standard return of premium (adjusted for fees and withdrawals) death benefit. Investment options are restricted [see box] but Goldberg said there are several that cost 59 basis points per year. If a contract owner selects those investments, the all-in annual costs for a three-year joint life version of the rider would be 3.49% of the benefit base per year.
Potential conflict?
But there’s the rub. If a healthy couple’s income stream starts when the younger spouse is 70 years old, and 11.49% of initial account value is coming out every year via withdrawals and fees, the potential for the account balance to drop to 3% before the surviving spouse dies seems fairly large.
By that time, the surviving spouse would also have lost the lesser of the pair’s two Social Security benefits. In addition, late-life medical expenses might have started to mount. The pinch seems even sharper if you consider the fact that the fees, which helps reduce the issuer’s risk, help trigger the markdown to 3%, which also reduces the issuer’s risk.
The Pacific Life rider also shares interest rate risk with the contract owner. The minimum rider fee is 70 basis points a year for a single life and 90 basis points for a joint life contract. If 10-year Treasury rates reach 4% a year, the rider fee will be capped at 1.50% per year. If rates fall below 2%, the fee for single life contracts will be capped at 2.25%. If rates are 2% to 3.99%, the rider fee will be capped at 2%. Joint life rider fees are 50 basis points higher in all three cases.
If retirees looking to annuities for income certainty, peace of mind in retirement, and fewer potential surprises as they get older, then this product appears not to fit the bill. On the other hand, Goldberg told RIJ that Pacific Life’s market research shows a demand for it.
For the target market for this product—retired clients of advisors who take commissions—a single-premium immediate annuity (SPIA) would probably not be proposed. At age 70, this type of VA rider would produce more initial income than a SPIA purchased with an identical premium, but the SPIA would provide much more longevity insurance.
If retirees look to annuities for income certainty, peace of mind, and protection from unpleasant surprises as they age, then this product may not fit the bill. Historically, advisors, unlike issuers, welcomed the idea of zeroing out the account value on a living benefit rider. It meant that their clients had “won” the longevity bet. With this type of rider, only issuers will feel good about the reduction in income (or not as bad as if they were still paying out 8%). Clients, however, may complain to their advisors about it.
(I could be wrong about rate-reduction riders. I’ve been wrong before. When index-linked variable annuities came out in 2011, I doubted that investors would want to absorb unlimited downside risk beyond the buffer zone. But those products have been successful.)
Pacific Life’s market research evidently shows a demand for Enhanced Income Select, however. “Our research is partly advisor-based, and partly based on our experience with selling a SPIA that offers an adjustment option that allows the payment to go up or down in the future. Depending on the situation, many advisors liked that feature. Every situation is different of course,” Goldberg said, adding that product-line extension is now the name of the game in annuities for both mutual and publicly held life insurers. “Everybody is changing. All of the carriers are trying to diversify their product mixes.”
An advisor who follows VA riders closely gave us a reality-check about this design. Its value “depends on the client’s situation,” he told RIJ. “If the clients have outsized expenses for a finite period and then expect relief from the sale of a vacation house, for instance, they might not need the higher income at age 80. But it has limited use. It would be very important to remind the client about the feature and provide detailed disclosure up front. This is just one more complexity that can be misrepresented or misunderstood.”
© 2019 RIJ Publishing LLC. All rights reserved.
If David Macchia didn’t have a native talent for selling insurance, and for selling ways to sell annuities, he might have been a professor or minister. The owner of Boston-based Wealth2k likes to teach. He believes in what he teaches, so he can be very persuasive.
For almost two decades, Wealth2k has been promoting a proprietary retirement income planning product called the Income for Life Model, or IFLM. It’s a web-based, turn-key, multi-media marketing/planning package for advisors. It shows them how to use the “time-segmentation” or “bucketing” method to generate income for retirees.
There’s no Nobel Prize-winning academic research proving that time-segmentation method works better than other decumulation strategies. But it fuses behavioral finance, the equity premium, and asset liability matching in a logical way. Most importantly for annuity sellers, it provides an open-architecture framework for cobbling together almost any combination of annuities and investments.
Now Macchia has become, like John Lennon, a paperback writer. If you’ve ever heard Macchia speak, you’ll probably recognize his voice coming through the text of his new book. Called Lucky Retiree, it teaches people about retirement risks and time-segmentation while selling IFLM.
The choice of the title is a good one. Insurance is always about risk mitigation, but risk is a negative word. The word “lucky” is its glass-half-full counter-part. Pro forma, Lucky Retiree methodically identifies the risks that retirees face: timing risk, longevity risk, market risk, inflation risk, etc. Commendably, Macchia also introduces the important concept of “constrained retirees” (whose assets are just shy of their income needs and who are a prime source of annuity prospects) and “flooring” (the principle of generating enough guaranteed monthly income to cover necessary, as opposed to discretionary, expenses in retirement).
After defining the challenge, the book offers time-segmentation as the solution. In a case study, Macchia describes Sue, a 65-year-old newly-retired telecom company manager with a small pension from her long-term employer. She declares that she absolutely must have an income no less than $6,000 a month in retirement. Her investments, worth $925,000, must provide $2,700 to top off the $3,300 per month she receives from Social Security and a pension.
Many if not most advisors might tell Sue to spend 4% of $900,000 per year, thus netting $36,000 a year or $3,000 a month. But, in this instance, her advisor, James, takes her at her word that she values protection over growth. So, using IFLM, James sets up a seven-segment bucketing plan for her instead:
Segment I: $157,973 in cash equivalents for years 1 through 5.
Segment II: $164,037 in a short-term bond fund, five-year fixed deferred annuity or structured CD for income in years 6 through 10.
Segment III: $70,201 in a 50% stocks/50% bonds portfolio for years 11 through 15.
Segment IV: $65,616 in a 60% stocks/40% bonds portfolio for years 16 through 20.
Segment V: $52,763 in a 70% stocks/30% bonds portfolio for years 21 through 25.
Segment VI: $115,968 invested in a risky-enough unspecified portfolio that aims for a 9% average return over 25 years, aiming for a balance of about $1 million at age 92.
Segment VII: About $300,000 invested in an annuity with an income start date at the beginning in year 11, providing at least $2,000 a month for life.
As each bucket of assets matures—and, ideally, has grown at the expected rate—its purpose changes from accumulation to distribution. The investments are liquidated and turned into cash equivalents that will provide worry-free income for the next five-year segment.
This is an extremely conservative plan. It puts about a third of Sue’s money in cash equivalents or short-term bonds, a third in an variable annuity, and only about $200,000 in stocks. An investment-driven advisor would probably, for better or worse, have put up to two-thirds of her money ($600,000+) in stocks.
But, given Sue’s preference for safety, this might be the very plan she’d buy. The advisor can assure her, as a closing comment, that she’s covered both ways. If her investments pay off, she’ll be a rich 92-year-old. But even if none of her risky investments appreciate, she’ll always receive enough monthly income to cover her basic expenses.
“No matter to what level the cash in these segments grows, the monthly income that will be created by each segment will be safe income that Sue can count on,” Macchia writes. That statement can be made (I infer this, because Macchia doesn’t make it explicit) because Sue paid $300,000 for a deferred indexed (FIA) or deferred variable annuity (VA) with a living benefit rider in year 1. The annuity pays her $2,000 a month for life starting in year 11. (The book provides few details, but Macchia might have been thinking of a income rider with a 6% payout at age 75 and a deferral bonus that could lift the benefit base to at least $400,000 over 10 years.)
This, in short, is how you sell annuities: Within the context of a larger plan that addresses the key concerns of the client while minimizing the mention of “annuities.” Macchia handles the topic of annuities gingerly, sparely, without much detail, and mainly towards the end of the book. If James, the advisor, had told Sue initially that she should buy a VA with a living benefit with a third of her savings, she probably would have bolted.
Over the course of his narrative, Macchia has demonstrated the proper, and perhaps necessary, progression from teaching to persuading to selling that advisors can (must?) take when trying to lead people to blend investments and annuities in a retirement income plan. The persuasion part gives me pause, but no one ever said that selling these products was easy.
© 2019 RIJ Publishing LLC. All rights reserved.
After experiencing a record outflow in December 2018, bond funds have rebounded in 2019. Taxable and municipal bond funds alone had net inflows of $39 billion in January, according to Morningstar. Of that amount, passive taxable bond funds received a record $27.6 billion in the first month of 2019.
The tilt to fixed income continued in February. Bond mutual funds received an estimated $28.1 billion through February 26. The category was on track for its second-largest monthly inflow in five years, according to a release from TrimTabs Investment Research.
“Retail investors remain skeptical of the ferocious stock market rally early this year,” said David Santschi, director of liquidity research for TrimTabs, which is based in Los Angeles. “While bond mutual funds are drawing big inflows, all equity mutual funds have lost an estimated $14.9 billion in February.”
U.S. equity funds and sector equity funds had a combined outflow of $12.1 billion in January, in a month when all long-term funds had net inflows of $39.1 billion. Almost equal amounts flowed in and out of active U.S. equity funds during January. Passive U.S. equity funds had an outflow of $3.8 billion.
January was the first time since March 2018 that open-end funds enjoyed stronger inflows than ETFs. The $34.1 billion advantage in flows was the greatest since March 2014. Over the 12 months ending January 31, open-end funds had $184 billion in outflows versus ETFs’ $240 billion in inflows. Active long-term funds lost $325 billion while passive long-term funds gained $391 billion.
Because of January’s strong equity returns, managed portfolios, such as target-date funds, with fixed allocations to individual funds may have been forced to trim their U.S. equity funds, Morningstar analysts Kevin McDevitt and Michael Schramm commented.
On the one hand, two S&P500 funds—Fidelity’s and Vanguard’s—were among the ten biggest gainers in the month. But two S&P500 ETFs—SPDR S&P500 and iShares Core S&P500—were among the ten biggest losers of flow in January.
One consistent story-line has been investors’ endless pilgrimage to Vanguard funds. You could attribute that to Vanguard’s low costs and passive investing, but those can be found elsewhere. Vanguard’s brand strength, which reflects trust, may be the driving factor there.
Highlights from Morningstar’s fund flow report for January included:
Morningstar estimates net flow for mutual funds by computing the change in assets not explained by the performance of the fund, and net flow for U.S. ETFs shares outstanding and reported net assets.
© 2019 RIJ Publishing LLC. All rights reserved.
Mega teams—those with $500 million or more in assets under management (AUM)— make up just 11% of advisor practices, but they service nearly two-thirds of total advisor-managed assets, according to global research and consulting firm, Cerulli Associates.
These teams are concentrated in wirehouses and hybrid registered investment advisors (RIAs), but their influence is steadily growing beyond those channels and throughout the industry. The asset growth of independent RIA mega firms over the past five years (2012-2017) has surpassed that of their smaller peers in the channel. Similarly, among wirehouse practices, mega teams have expanded their collective AUM by 19% over the past five years, while all other AUM tiers ceded assets.
Cerulli anticipates that mega teams will continue to win opportunities for both organic (e.g., client referrals) and inorganic growth (e.g., acquisitions, tuck-in advisors) as advisors seek to reap the advantages of teaming. Currently, more than half (54%) of all advisors operate in a team structure.
“Teaming allows advisors to build specialized roles and responsibilities, thereby delivering broader and deeper advice to clients with more complex financial needs,” said Marina Shtyrkov, a research analyst at Cerulli, in a release.
Teaming also enriches the end-client experience because it helps advisors pool resources, integrate next-generation advisors, and support one another’s client relationships. Nearly three-quarters (73%) of advisors believe that teaming improves the client experience.
“As advisors begin to think more holistically about the nonfinancial, intangible impact they can have on their clients, they will increasingly compete on the quality of their client experience, and mega teams are well positioned to compete in this experience-centric model,” Shtyrkov said.
For asset managers, mega teams represent attractive distribution opportunities. They commonly retain investment decisions and use diverse products and services. At the same time, they are blurring traditional channel lines, causing managers to reassess advisor coverage. Asset managers need to understand the main point of influence and assess advisor personas to ensure success with this segment.
Also included in Cerulli’s latest report, The Cerulli Report—U.S. Advisor Metrics 2018: Reinventing the Client Experience, are detailed analyses of advisor market sizing, attributes, client relationships, broker/dealer support, investment decisions and product use, and practice challenges and growth opportunities.
© 2019 RIJ Publishing LLC. All rights reserved.
Envestnet Insurance Exchange, which integrates insurance products into the Envestnet wealth management platform, will soon provide advisors with access to products from six major insurance carriers, it was announced this week.
“Envestnet is working to onboard advisors to the pilot program and plans a broad-market release of the Insurance Exchange in June 2019,” said an Envestnet release from Bill Crager, chief executive of Envestnet Wealth Solutions.
The carriers, Allianz Life, Brighthouse Financial, Global Atlantic Financial Group, Jackson National Life Insurance Company, Nationwide and Prudential Financial, will offer variable, structured, fixed and indexed annuities to advisors through the Envestnet Insurance Exchange.
Envestnet Insurance Exchange is powered by Fiduciary Exchange, LLC (FIDx), whose software integrates the brokerage, insurance and advisory ecosystems. The partnership was initially announced at the Envestnet Advisor Summit in May 2018.
Since then, Envestnet and FIDx have added prominent carriers and annuity products. FIDx’s technology unites insurance carriers and wealth management platform, allowing advisors to bring annuities into clients’ portfolios, either for long-term investing, tax deferral, guaranteed income or principal protection. Through Envestnet Insurance Exchange, advisors and their clients will benefit from the following:
Envestnet Insurance Exchange will be available through the sponsor and advisor portals on the Envestnet platform.
© 2019 RIJ Publishing LLC. All rights reserved.
Nick Lane has assumed his previously announced position as president of AXA Equitable Life with responsibilities for the company’s Retirement, Wealth Management and Protection Solutions businesses as well as its Marketing and Digital functions, according to a release this week from AXA Equitable Life.
Lane reports to AXA Equitable Holdings, Inc., president and CEO Mark Pearson, and joins the firm’s management Committee. Most recently, Lane served as CEO and President of AXA Japan, where he was responsible for a business with $5.4 billion in annual revenue and led a team of 9,000 employees and distributors.
Lane joined AXA in 2005 and held a variety of leadership roles. He launched fee-based versions of the company’s flagship variable annuity products to meet evolving financial advisor and customer needs.
Lane also led global strategy for AXA Group, oversaw its asset management business and served on the boards of AllianceBernstein, AXA Investment Managers, AXA Private Equity and AXA Real Estate Management.
Prior to joining the company, Lane was a leader in the sales and marketing practice of the global management consulting firm McKinsey & Co. He received an MBA from Harvard Business School and a bachelor of arts from Princeton University. Lane also served as a Captain in the U.S. Marine Corps.
Strong demand for life insurance and annuities, coupled with strong investment income, enabled MassMutual to achieve record revenue of $32.5 billion for 2018, a 24% increase over 2017, the company reported this week. Total adjusted capital also remained at an all-time high.
Total sales by MassMutual’s advisor network was $30.8 billion, up 20% over 2017. The company also announced or completed several strategic transactions in 2018. The statutory surplus was $15.6 billion at year-end. Total adjusted capital was a record $19.9 billion, or more than double the amount 10 years ago.
The company approved an estimated $1.72 billion dividend payout to eligible participating policyowners for 2019, its all-time highest payout and the 151st consecutive year it has paid a dividend.
MassMutual proves nearly $715 billion worth of insurance coverage, and was the top writer of whole life insurance for the third consecutive year. The company paid more than $5.3 billion in insurance and annuity benefits to its policyowners and customers.
MassMutual’s net gain from operations before policyowner dividends and taxes was $1.86 billion, up slightly over 2017. That is the company’s primary earnings measure for a mutual company.
After factoring in policyowner dividends and other items, the company realized a statutory net loss related to its sale of the majority interest of MassMutual Japan to Nippon Life last year. Excluding this one-time impact, the company would have realized a statutory profit of approximately $500 million.
MassMutual also took several steps in 2018 to bolster its international insurance and asset management businesses. The ownership structure for some of these companies evolved from wholly-owned operating subsidiaries to mutually beneficial partnerships around the globe.
The sale of MassMutual Asia to Yunfeng Financial Group and several Asia-based investors was an example of this strategy.
MassMutual expects to reap similar advantages from the merger of Oppenheimer Funds, Inc., the company’s retail asset management affiliate, and Invesco Ltd., which will create one of the world’s largest asset managers.
Expected to close in 2019, the transaction will give MassMutual the largest ownership position in the combined firm – approximately 15.5% – along with expanded global scale, diversity of offerings and additional capital.
In an effort to encourage individuals to build financial knowledge, Principal Financial Group has introduced a voice-activated financial wellness and retirement readiness education tool.
When individuals enable the “Principal Flash Briefing” skill and say, “Hey Alexa, what’s my Flash Briefing?” they’ll hear quick retirement planning and financial tips. Listeners will then be directed to Principal.com/Alexa for information from their financial wellness platform, Principal Milestones.
When consulted, Alexa will give tips like, “10%. What’s so special about that number? Saving at least 10% of your income plus other contributions toward retirement could help you get closer to setting you up for the retirement you want.
“And if that seems overwhelming right now, consider ticking up your contribution by 1% each year to get closer to your goal. It’s never too early, or too late, to master your money.”
eMoney, a leading provider of wealth management solutions, today launched Foundational Planning, the newest planning solution available on the eMoney platform. Foundational Planning is designed to help advisors introduce planning to clients and scale planning across their organizations through a single platform.
Foundational Planning starts with a streamlined data gathering process using step-by-step workflows and modular planning focused on retirement, education and spending goals that, when combined, build a holistic plan. It also provides an interactive and engaging client experience with side-by-side scenario planning, including Monte Carlo-based results.
As client relationships mature and their needs change, advisors can seamlessly transition to using an even more comprehensive planning solution built on the same engine that powers eMoney’s Advanced Planning tools, eliminating the need for multiple planning technologies.
Planning continues to be a differentiator for today’s most forward-thinking, tech-savvy and nimble advisors, otherwise known as FlexGen Advisors. According to the 2018 FlexGen Advisor Research Study, these advisors cite planning as a viable way to differentiate their practice (91%) versus their peers (69%) and more frequently provide clients with an interactive experience (82%) than their peers (47%). And they are seeing results. FlexGen Advisors reported, on average, a 24% annual increase in AUM in compared to their peers who saw a 14% increase.
Brad Arends, co-founder and CEO of intellicents, a financial services firm dedicated to helping the “other 99% of Americans,” will be one of the first eMoney clients to use Foundational Planning.
For more information about Foundational Planning or to sign up for demo, visit https://info.emoneyadvisor.com/foundational-planning.
Retirement Clearinghouse, the North Carolina-based company that markets an “auto-portability” process for forwarding abandoned 401(k) accounts to the participant’s next plan after a job change, announced that Ricki G. Ingalls, Ph.D., has joined its team as Chief Operating Officer.
Ingalls was previously an associate professor, and chair of the Department of Computer Information Systems and Quantitative Methods, at Texas State University’s McCoy College of Business Administration.
Ingalls was also an associate professor in Oklahoma State University’s School of Industrial Engineering and Management, and president of Entero Technologies, LLC, where he developed algorithms and process improvements for clients such as Brivo Systems, Frito-Lay, and Royal Dutch Shell.
Earlier in his career, he was senior manager of Global Integrated Logistics at Compaq Computer Corp.
Ingalls received his Ph.D. in Management Science from the University of Texas at Austin. He also holds a master of science in Industrial Engineering from Texas A&M University, and a bachelor of science in mathematics from East Texas Baptist College.
2019 RIJ Publishing LLC. All rights reserved.
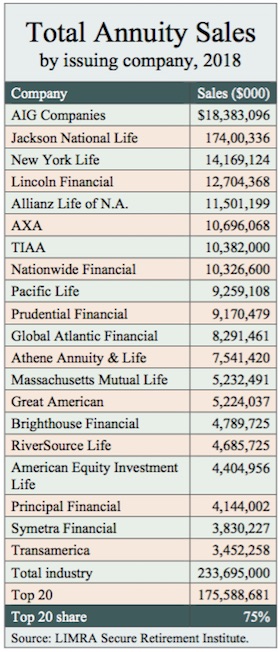
Rising supply, competitive yields, compelling commissions, deregulation (post-fiduciary rule), flight to safety from equity market volatility, and rising demand from retiring baby boomers for safe lifetime income are among the many possible explanations for record-breaking sales of fixed annuity products last quarter.
Fourth quarter 2018 indexed annuity sales set an all-time quarterly record at $19.5 billion, a 40% increase, compared with fourth quarter 2017 results, according to a quarterly annuity report from LIMRA Secure Retirement Institute (SRI).
For the year, fixed indexed annuity sales rose 27% to $69.6 billion, compared with the prior year. This exceeded the previous annual fixed indexed annuity sales record by $10 billion.
“Total fixed annuities had a record-breaking fourth quarter, achieving the highest level of sales for fixed annuities in a quarter—ever,” said Todd Giesing, director, Annuity Research, LIMRA SRI, in a release this week.
“This jump in quarterly sales can be attributed to higher interest rates and increased equity market volatility. This is the fourth consecutive year where annual fixed annuity sales surpassed $100 billion. This is the first time it has occurred since LIMRA SRI began tracking sales.”
At 4.10%, 5-year fixed deferred annuities with a minimum investment of $10,000 currently offer yields that are about 80 basis points higher than current annual yields for certificates of deposits, according to a cursory scrape of data from nerdwallet.com and blueprintincome.com. On a $1,000,000 investment, the difference in yield after five years would be about $40,000.
Total annuity sales were $232.1 billion for 2018, up 14% from 2017 results, according to LIMRA Secure Retirement quarterly annuity retail sales survey. Sales were $62.1 billion in the final quarter of 2018, up 22% over 2017.
Driven by fixed annuity products, the fourth quarter of 2018 saw the highest quarterly total annuity sales since the first quarter of 2009, and the first time annuity sales have exceeded $60 billion since the fourth quarter of 2015.
“Individual annuity sales for 2018 finished the year strong, particularly sales of fixed annuity products,” Giesing said. “Fixed annuity sales accounted for nearly 60% of overall individual annuity sales, a significant change from just five years ago.”
Total fixed annuity sales increased 47% in the fourth quarter, to $37.4 billion. For the year, fixed annuity sales rose 25% to $132 billion. That’s an all-time high for fixed annuity sales.
Fixed rate deferred annuities (book value and market value-adjusted) sales increased 74% in the fourth quarter to $12.9 billion. Full year fixed-rate deferred annuity sales for 2018 were $44.2 billion, 29% higher than 2017 results. This is the first time annual fixed-rate deferred sales have exceeded $40 billion since 2009.
Fixed immediate annuity sales rose 29% in the fourth quarter to $2.7 billion, which represents the highest quarterly sales recorded for immediate income annuities. For the year, income annuity sales increased 17%, to $9.7 billion.
Sales of deferred income annuities (DIA) increased 20% in the fourth quarter, to $655 million. For 2018, DIA sales were 4% higher than 2017 results, reaching $2.3 billion.
U.S. variable annuity (VA) sales were $24.7 billion in the fourth quarter, down 3% compared with prior year results. Total VA sales for 2018 were $100.1 billion, a two-percent increase over 2017 results. Fixed annuity sales have exceeded VA sales in 10 of the last 12 quarters.
Registered indexed-linked annuity sales (RILAs) topped $3 billion this quarter, an increase of more than 10%. For the year, RILA sales will near $11 billion and represent more than 10% of total VA sales.
The fourth quarter 2018 Annuities Industry Estimates can be found in LIMRA’s Data Bank. To view variable, fixed and total annuity sales over the past 10 years, please visit Annuity Sales 2008-2017. Top 20 annuity rankings will be available in mid-March.
© 2019 RIJ Publishing LLC. All rights reserved.
Older and retired Americans must confront a series of risks that could upend or jeopardize their retirement security. This article offers a Cook’s tour of these risks: Longevity risk, financial risk, health care cost risk, long-term care (LTC) cost risk, political risks and the risk of miscellaneous contingencies.
Longevity risk is the risk entailed by uncertain lifespans. Whatever our life expectancy—how long on average we think we will live—we confront this risk. It underlies or aggravates other risks, especially financial and LTC cost risk.
Financial risk comes “with the territory” of investing; especially these days, an adequate return on average to a portfolio requires taking it.
Sequence of returns risk is an aspect of financial risk, as is interest risk, which arises when maturing assets must be reinvested at lower than expected rates of interest. (Another type of interest risk occurs when rates rise and existing bonds are marked down in value.)
Health care cost risk arises because of our inability to predict our susceptibility to illness, especially serious illness. It is mitigated for Americans aged 65 years and older by Medicare and by policies that supplement Medicare, but not eliminated.
Long-term care cost risk depends in part on longevity—we are more likely to need it in advanced old age—and on our generally unknown genetic endowment and the state of our health in advancing years.
Political risk arises when we rely on Social Security for a significant part of our retirement income. In fact, the financial positions of both Social Security and Medicare/Medicaid are not sustainable, and we do not know what changes Congress may make to the current structure of benefits or the payroll taxes that finance them.
Non-routine expenditures other than health care and LTC expenditure are also not always predictable. Many Americans, young and old, are hard-pressed to deal with even comparatively minor unforeseen but necessary outlays.
Finally, and for completeness’ sake, we should acknowledge that the elderly face risks that may not have direct financial consequences: the risk of isolation and loneliness come to mind.
Longevity risk and financial risk are linked—you can’t have one without the other. Longevity risk plays a role with the other risks as well. Nonetheless, it is useful to isolate the effects of longevity risk in financial decision-making before we address more basic financial risks.
Leaving aside the hedge against longevity risk that Social Security and defined benefit pensions can provide, longevity risk poses a basic question for the investor: how long must someone’s retirement savings last? The answer: we don’t know. We may not be very healthy, or may have short-lived forebears, but that doesn’t mean we are doomed to die young or that longevity will become predictable.
A basic rule in such circumstances is to be prudent. For example, a 65-year-old retiree with a life expectancy of 20 years might assume that he or she will live for 30 or 35 more years. Retirees should make a conservative assumption about the average rate of return on their investments, and then calculate the amount of money that they can spend each year without running out.
It’s not necessary to assume a constant level of expenditure each year. Some studies suggest that annual spending declines over time, as people engage in less travel and certain other activity-related expenditures. Other studies find that rising out-of-pocket health care costs can push expenditures up with age.
There’s a problem with this approach: the retiree is likely to die before the assumed 30- to 35-year planning period ends. A partial solution to the problem is to redo the calculation every few years: for example, if the retiree reaches age 70 in relatively good health, the calculation might be redone using a maximum planning period of 27 years instead of 30 or 35. Nonetheless, money is still likely to be “left on the table” by those who don’t live to the end of the planning period.
This raises the question of annuitization. Annuities are longevity insurance, so why not address longevity risk directly by buying one from an insurance company? The private annuity market has never held much appeal for older Americans, however. Economists for the most part think annuities are a good form of protection against longevity risk and refer to the anemic market for them as the “annuity puzzle.”
For retirees whose working incomes have been modest, Social Security will offer an indexed life annuity that replaces a large share of that income. This will not be the case for most of the clients of the advisors who read this publication, however.
The large upfront cost of an immediate annuity (IA) is probably a deterrent for many potential investors. One possible solution is to purchase a standard investment that can cover expenses during, say, the first 20 years of retirement, and a deferred income annuity (DIA) that starts paying at age 85 (assuming retirement at age 65). This combination is certainly less expensive than an immediate annuity starting at retirement, but an IA can provide significantly higher income over the first 20 years of retirement (conditional on survival).
Longevity risk also affects how LTC cost risk will affect a retiree. The risk of needing care in a nursing home or an assisted living facility obviously increases with age. We’ll return to this issue when we address LTC care risk.
Next week: Other retirement risks you and your clients should anticipate.
George A. (Sandy) Mackenzie a Washington-based economist. After more than 25 years as a staff member of the International Monetary Fund, Mackenzie began to specialize in the economics and finances of retirement. From 2013 – 2018, he was the first editor of the Journal of Retirement. He is the author of Annuity Markets and Pension Reform (Cambridge, 2006) and The Decline of the Traditional Pension: A Comparative Study of Threats to Retirement Security (Cambridge 2015).
© 2019 RIJ Publishing LLC. All rights reserved.
The Milliman Public Pension Funding Index deficit rose to $1.693 trillion as of December 31, 2018, up from $1.387 trillion at the end of September 2018.
“Public pensions took a huge hit in the fourth quarter of 2018,” a Milliman release said. “For plans in which benefits paid out exceed contributions coming in, this is difficult news, as investment returns are critical to slow the outflow of funding.”
In 2018 Q4, public plans experienced a $306 billion loss in funding, largely due to a quarterly investment return of -6.39% in aggregate. This was the largest quarterly funding decrease since the PPFI began in September 2016.
Estimated investment returns for plans in Q4 ranged from a low of -10.27% to a high of -2.18%. As a result, the funding ratio of the Milliman PPFI dropped from 72.9% at the end of September to 67.2% as of December 31.
The total pension liability (TPL) continues to grow. It stood at an estimated $5.164 trillion at the end of Q4, up from $5.123 trillion at the end of Q3. Nine plans dropped below the 90% funded mark during the quarter; there are now just eight plans above this mark, down from 17 at the end of Q3.
The Milliman 100 Public Pension Funding Index can be seen at http://www.milliman.com/ppfi/. To receive regular updates of Milliman’s pension funding analysis, email the firm at [email protected].
Milliman has conducted an annual study of the 100 largest defined benefit plans sponsored by government jurisdictions in the U.S since 2012. The Milliman 100 Public Pension Funding Index projects the funded status for pension plans included in our study, reflecting the impact of actual market returns, utilizing the actual reported asset values, liabilities, and asset allocations of the pension plans.
The results of the Milliman 100 Public Pension Funding Index are based on the pension plan financial reporting information disclosed in the plan sponsors’ Comprehensive Annual Financial Reports, which reflect measurement dates ranging from June 30, 2016, to December 31, 2017. This information was summarized as part of the Milliman 2018 Public Pension Funding Study, which was published on January 15, 2019.
© 2019 RIJ Publishing LLC. All rights reserved.
When I dropped off a sack of dirty clothes and linen at the laundry this morning, I met the owner of the shop, Aviram, an Israeli of about 40. He has brown hair, blue eyes, and a beard, curly and slightly more Hellenic than Hasidic. A small knot gathered the hair on top of his head. He runs the business with his mother, a petite woman with white hair who, at that moment, was pressing a shirt.
“Yes, we have a lot of taxes. Too much, I think,” said Aviram, who has a gentle but confident manner. He lived on Staten Island for six years, but for some reason he speaks English with a slight British accent. “I’ve been to Philadelphia too. I saw the bell,” he said, half-smiling. Like me, he’d been a stranger in a strange land.
When I told him that I was visiting Israel to study the retirement/pension system (see last week’s cover story), he confirmed that more than half of most Israelis’ take-home pay goes to income taxes and social insurance taxes, which include taxes for the basic state pension and health care, as well as mandatory contributions to a personal pension and an unemployment fund.
“Would you like a coffee?” he asked.
Regarding pensions, he mentioned a grandfather with dementia, and one’s risk of forfeiting a pension through early death. He conceded, however, that you could lock in payments for 20 years and thereby protect one’s heirs. Day care for children is free to working parents in Israel, he said. I told him that, in the US, the cost of day care can be a heavy burden for young couples.
The subject easily drifted to Israeli politics and to Bibi Netanyahu. For Aviram, the four-term right-wing prime minister represents the unyielding and dogmatic view that groups of humans will always separate into a successful 20% and a not so successful 80%, just as unhomogenized milk separates into cream and whey.
A smarter, better leader than Netanyahu would be Dan Ariely, Aviram said. I was surprised that to hear that. Ariely is an Israeli psychologist who teaches at Duke University and famously blogs about behavioral economics. He’s written several books, including the best-selling, Predictably Irrational (HarperCollins 2008).
The 2008 financial crisis, which occurred as Israel was beginning its transition from a voluntary to a mandatory defined contribution system of retirement savings, was very tough on Israeli families, Aviram told me. As in America, the crash reduced the savings of many older people who had just retired and didn’t have pensions.
Suddenly underfunded, they turned to their children for financial help. But, in a country where housing costs are high—despite apartment construction projects wherever you look—real estate prices, many young couples expect help with their first mortgages from their parents. The combination of circumstances has evidently made life difficult for families.
As we talked, customers arrived and left. A tall Haredi Jew in a black suit and black broad-brimmed hat stopped in with laundry and instructions. He left, and two men with close-cropped hair came up. The older one, evidently the father, spoke in Russian to Aviram, who doesn’t speak Russian. “They’re from Uzbekistan. The Hebrew word for it is Bukhara,” Aviram said. [Bukhara is a region and city in Uzbekistan.] “They come to Israel more for the economy than the religion.” By way of saying goodbye, the older man went to each us in turn, smiling and clasping our right hands with both of his.
Aviram again offered me refreshment. “Would you like a sandwich? We’re making some in the back. Are you sure?”
The fee for washing, drying and folding five kilograms (11 pounds) of laundry was 50 shekels or about $14. I’m out-sourcing my laundry because I haven’t yet figured out how to operate my cousin’s apartment-sized washer and dryer. Aviram’s assistant, who was busy folding someone else’s clothes, told me to come back in five hours. My laundry, including three pressed items, would be ready then.
© RIJ Publishing LLC. All rights reserved.
Allianz Life Insurance Company of North America this week announced its 2018 financial results, with assets under management rising to $138 billion and total premium reaching $12.7 billion, 16% higher than 2017.
Allianz Life’s operating profit topped $1 billion for the third year in a row. Though in line with expectations, it was down slightly from the record $1.18 billion in 2017 due to market volatility. The company paid $2.8 billion in life insurance and annuity benefits to policyholders and contract owners in 2018, up 7% from 2017.
Life insurance premium hit a record high in 2018, rising 7% to $101 million. Fixed index annuity (FIA) sales reached $9.2 billion, up 23% over the previous year. Allianz Life continues to be a top seller of FIAs in the United States. Index variable annuities (IVA) premium were $2.11 billion in 2018, down slightly from 2017.
More than 7% of Allianz SE global operating profit in 2018 was generated by its Allianz Life subsidiary (and more than 20% of Allianz SE global operating profit in the life/health sector).
Allianz Life retained all of its ratings in 2018. Current ratings include:
AIG reported a net loss of $622 million, or $0.70 per share, for the fourth quarter of 2018, compared to a net loss of $6.7 billion, or $7.33 per share, in the prior-year quarter.
Adjusted after-tax loss was $559 million, or $0.63 per share, for the fourth quarter of 2018, compared to adjusted after-tax income of $526 million, or $0.57 per diluted share, in the prior-year quarter.
“Throughout 2018, significant foundational work was undertaken to remediate AIG’s core underwriting capabilities,” said Brian Duperreault, AIG’s president and CEO, in a release. We moved quickly to reduce risk and volatility, as well as implement strategies that we believe will accelerate our progress in 2019.”
(All comparisons are against the fourth quarter of 2017, unless otherwise indicated.)
Fourth quarter net investment income from our insurance companies, including the Legacy insurance portfolios, decreased 18.1% from the prior-year quarter to $2.8 billion.
The fourth quarter was impacted by net losses on alternative investments as well as investments in equity securities resulting from elevated volatility in the credit markets and unfavorable performance in the equity markets. For the full year, net investment income from our insurance companies, including the Legacy insurance portfolios, totaled $12.7 billion.
Fourth quarter adjusted pre-tax income of $623 million reflected the impact of declining equity markets and widening credit spreads in all businesses, against a backdrop of attractive new business margins, and solid growth in premiums and deposits in Individual Retirement, Group Retirement and Life Insurance as well as several opportunistic Institutional Markets transactions.
GOE increased primarily due to new business acquisition, international expansion, and investments in core businesses. The fourth quarter of 2018 adjusted return on equity was 9.8%.
In Individual Retirement, adjusted pre-tax income reflected lower net investment income due to lower base spreads and yield enhancements and lower fee income driven by unfavorable credit and equity market performance. Net flows excluding Retail Mutual Funds were positive and reflected strong sales.
In Group Retirement, adjusted pre-tax income reflected lower fee income, lower base spread and yield enhancements driven by unfavorable credit and equity market performance and continued investments made in the business. Group Retirement net flows reflected higher sales offset by higher surrenders due to the loss of large plan accounts, as well as higher individual surrenders.
In Life Insurance, adjusted pre-tax income reflected higher net investment income due to business growth and higher alternative investments returns. Mortality was favorable to pricing expectations.
In Institutional Markets, adjusted pre-tax income reflected investments in technology and infrastructure and reserve refinements, partially offset by growth in the portfolio, which drove higher net investment income.
© 2019 RIJ Publishing LLC. All rights reserved.
This mountain of meta-data naturally creates opportunities for monetization. Seeking Alpha can identify the most sought-after authors and articles, segment the most valuable, and charge extra for access to them. Content is currency for Seeking Alpha, as long as the editors (and their algorithms) keep making smart decisions about which content readers will be willing to pay for.
Here are CEO Eli Hoffmann’s descriptions of the three products that Seeking Alpha has created in recent years for readers who want more than the basic access to stories and alerts about their favorite securities or topics.
Essential
“The first product is Seeking Alpha Essential. That costs $20 a month. You get four key value propositions: Access to all our content, qualitative stock ratings from our network of contributors, author tracking—you can track specific contributors as well as stocks—and powerful tools, such as unique charts that we’ve created for readers. We were the first to chart yield-on-cost. It shows you how much, since you purchased a particular dividend stock, the yield has gone up or down. There are some unique visualizations,” Hoffmann told RIJ.
PRO Plus
“The next is PRO Plus, which is targeted to the high net worth individual or the professional investor,” he said. “It costs $200 a month. PRO Plus gives you access to everything in Essential plus exclusive access to the ‘Single Best Idea’ of the day.” Every business day, the subscriber receives an article of two or three thousand words that the editors consider especially valuable. It’s a curated stock-tip, essentially.
PRO Plus subscribers can also access a filtering tool; institutional investors, for instance, can pre-select only institutional content and screen out the stories meant for retail investors. “The institutional investors are not yield-chasers or dividend investors,” Hoffmann said. The writer who contributes the idea that become the day’s ‘Single Best Idea’ earns $1,000. That bounty incentivizes all of the contributors to produce better and better content.
Investor Marketplace
The third and final product is the Investor Marketplace, where investment experts can launch private communities for the Seeking Alpha followers. “If I write about chip stocks, for instance and I have a large following, I can come to Seeking Alpha and say, ‘I have an engaged audience, I will share my entry and exit points from the market, I will share my entire portfolio, with weightings, and we can live chat while things are actually happening in the market.’ We provide them with a marketing funnel,” Hoffmann said.
“Whoever sets up a marketplace can make it whatever they want it to be. They could say, ‘If you’re an accredited investor, you can join my community for $50 or $100 or $1,000 a year.’ We have about 160 analysts, with 160 private communities. It’s a terrific opportunity for smart analysts. The analysts get a free funnel. The members get free contributions from the analyst, and a community chat room.”
Seeking Alpha doesn’t just wait for the contributors to request a personal Marketplace; it clocks the traffic of every one of them and urges high-traffic writers to start their own exclusive pods. “They charge a minimum of $20,” Hoffmann told RIJ. “We do the payment processing, the customer service, the password resets and a dashboard that tells them who their clients are, what they’re reading, and which articles are converting readers to community members. We have a four-member team dedicated to our Marketplace Contributors.”
Collectively, those 160 analysts take in about $8 million a year. Of that, Seeking Alpha receives 25%. It’s a small part of the company’s overall business today, but one where Hoffmann sees vast potential.
© 2019 RIJ Publishing LLC. All rights reserved.