Archives: Articles

IssueM Articles

The ‘Securing a Strong Retirement Act of 2020’

Retirement policy has been one of the few topics, aside from tax cuts, that Democrats and Republicans can agree on. Congress passed the SECURE Act in 2019. Now red and blue House members have collaborated on a sequel: The Securing a Strong Retirement Act of 2020, or as some are calling it, SECURE 2.0.

The newest proposal, announced this week, builds on last year’s SECURE (Setting Every Community Up for Retirement Enhancement) Act in removing regulatory snags and stumbling blocks that have vexed life insurers, asset managers and retirement plan providers for years. Both bills reflect many specific requests from the retirement industry and its attorneys.

At first glance, the new bill lacks the potentially game-changing elements in the SECURE Act, which opened the gate for the creation of giant 401(k) plans that many unaffiliated companies could join, and took steps to reduce the legal liabilities of employers who offer annuities as investment options in their plans.

Among other things, SECURE 2.0 would:

  • Require 401(k), 403(b) and SIMPLE plans to automatically enroll newly eligible participants and begin auto-escalated contributions at 3% or more. (My emphasis.)
  • Raise the initial age for required minimum distributions (RMDs) from tax-favored savings plans to age 75. (The SECURE Act had raised it to age 72 from 70-1/2.)
  • Exempt defined contribution plan participants and IRA owners from the lifetime RMD rules if they have balances of no more than $100,000 (indexed) at the end of the year before they reach age 75. [“That’s a permanent lifetime exemption from RMDs, as long as they make no new transfers into their accounts after the measurement date—the year before they turn 75,” J. Mark Iwry, a former Treasury official who worked on similar changes proposed during the Obama administration, told RIJ this week.]
  • Liberalize the rules around QLACs (qualified longevity annuity contracts) to raise the contribution limit to $200,000 and remove the 25% (of total tax-deferred savings) on contributions. QLACs are deferred income annuities purchased with pre-tax money; income payments must start by age 85.
  • Increase the tax credit for administrative costs of small businesses that are starting pension plans. The bill would also make employers joining an existing multiple employer plan (MEP) or pooled employer plans (PEPs) eligible for the credit for three years.
  • Amend the “Saver’s Credit” to create a single credit rate of 50% (currently there is a tiered structure of 10%, 20% and 50% credits), and raise the maximum per-person credit to $1,500 from $1,000.
  • Allow 403(b) custodial accounts to invest in collective investment trusts (CITs), as 401(k) participants can.
  • Index the current limit on extra IRA contributions ($1,000) for people over 50 to inflation, starting in 2022.
  • Increase the limit on IRA contributions for those 60 and older to $10,000 ($5,000 for SIMPLE plans), starting with contributions for tax year 2020.
  • Allow 403(b) plans to participate in multiple employer plans, or MEPs, and exempt them from the “one bad apple” rule.
  • Permit employers make matching contributions under a 401(k) plan, 403(b) plan, or SIMPLE IRA with respect to “qualified student loan payments.”
  • Allow employers to make small immediate incentives, like gift cards in small amounts, to encourage employees to contribute to retirement plans.
  • Eliminate certain rules that inhibit the use of life annuities in qualified plans and IRAs, such as rules blocking annuity contracts with inflation adjustments, return of premium death benefits, or period-certain guarantees). 
  • Amend the Employee Retirement Income Security Act of 1974 to allow providers of defined contribution plans to deliver one annual benefit statement on paper and three quarterly statements electronically.

The most surprising provision in this new bill might be the requirement that workplace retirement plan sponsors auto-enroll newly eligible employees into a plan and begin automatic contributions of up to 10% of pay. (Employees may still opt-out of their plans.) This almost sounds like a mandate—which are frequently unpopular.

The QLAC relief is welcome. It adds much-needed flexibility to these deferred income annuities, which have been underused in their current form. Under the existing rules, the tax breaks were too meager to spark much interest among the retirees who could best afford to take advantage of them. 

In SECURE 1.0, I thought Congress may have missed an opportunity in not connecting the provisions that lower barriers to annuities in plans with the provisions that enable the creation of multiple employer plans, or MEPs or pooled employer plans (PEPs). Offering annuities through MEPs seems promising: There would be greater economies of scale, and the sponsors of MEPs or PEPs will likely be more financially sophisticated than traditional plan sponsors (i.e., employers).

The tweaks in these two acts of Congress may facilitate healthy change in the retirement world, but I can think of changes that life insurers, plan participants and retirees might welcome more: A less repressive interest rate environment, significant mandatory employer contributions to defined contribution accounts (as in Australia, for instance); and, most of all, a resolution of the suspense over the future of Social Security benefits.

Tweaks to the defined contribution system are welcome, but Social Security remains the most important source of retirement income for the majority of Americans. If Congress can collaborate on retirement legislation, maybe they can collaborate on eliminating the technical shortfall in funding that Social Security faces.

(c) 2020 RIJ Publishing LLC. All rights reserved.

Visualizing Retirement Portfolio Survival

The viability (survival) of a retirement portfolio is a function of the withdrawal rate each year and the performance of the portfolio in that same year. For retirees, a key concern is a bad sequence of portfolio returns within the first five to six years after they begin taking withdrawals. Other important variables include the asset allocation of the portfolio (the driver of performance) and the total portfolio cost (the expense ratios of the underlying investments plus the adviser’s management fee).

In this study, I find that retirees face little danger of portfolio failure after the first five years or after 25 years, assuming:

  • Withdrawals starting at age 72, when distributions from qualified savings must begin [Note: Proposed federal legislation would raise the starting age to 75]
  • A withdrawal rate based on the IRS RMD (required minimum distribution) Uniform Lifetime Table for qualified savings accounts
  • A diversified portfolio (see below) with a starting value of $1 million
  • Total fees of 1% per year

In the process, I also find that percentage-based withdrawal strategies (such as the RMD rules) are superior to withdrawals of fixed dollar amounts adjusted upward each year for inflation.

The study employs an Excel-based tool that allows a retiree (or pre-retiree) to visualize the dynamics of retirement portfolio durability (survival), based on the nominal performance of the financial markets over 70 rolling 25-year periods from 1926 to 2019. The impact of taxes was not considered.

I’ve used this spreadsheet tool in my research for many years. The tool accommodates many different sets of assumptions—about withdrawal rates, asset allocations, retirement ages, life expectancies and portfolio balances—based on each client’s circumstances. Because it relies on past performance and on average annual withdrawals, it can’t be used to make firm predictions. But by helping people visualize the range of possible outcomes that stem from a particular withdrawal strategy, it can help foster a client’s confidence in the future and have a calming influence during market downturns.

Core asset classes since 1926

There are four core asset classes that we can measure back to 1926: US bonds, US large cap stock, US small cap stock, and cash. These asset classes represent the building blocks of a retirement portfolio.

Over the 94-year period from 1926 to 2019:

  • US bonds produced an average annualized return of 5.28% (based on the Ibbotson US Intermediate Government Bond Index from 1926-1975 and the Barclay’s Capital Aggregate Bond Index from 1976-2019)
  • Large cap US stock (S&P 500 Index) produced an average annualized return of 10.20%
  • Small cap US stock produced an average annualized return of 11.23% (as measured by the Ibbotson Small Company Stock Index from 1926-1978 and the Russell 2000 Index from 1979-2019) over the 94-year period.
  • The performance of cash (90-day US Treasury Bills) was 3.38%

Other asset classes were not included because they lacked at least a 94-year performance history.

As shown in Figure 1, there is a strong case for optimism among retirees using the RMD strategy, starting at age 72. Given the $1 million starting balance (as shown by the dotted red line in the graph), the average portfolio balance after five years of RMD-based withdrawals was $1.245 million (as shown by the dotted black line) and after the full 25 years of withdrawals the average portfolio balance was $1.429 million (as shown by the blue vertical bars). In short, if the retiree withdraws only the amount of money specified by the RMD (and no more) a diversified retirement portfolio stands a good chance of growing over time. 

Figure 1.  94-Year Analysis of a Four Asset Retirement Portfolio

The graph visualizes the experience of 70 different retirees, each starting his or her retirement one year after the last.  The first person retired in 1926 at the age of 72 and withdrew money (based on the current RMD divisors) for 25 years. At the age of 97 (in the year 1950) that retiree’s portfolio balance was about $750,000 (as shown by the leftmost vertical blue bar).

The next person retired in 1927 and experienced a different sequence of returns. Her ending account balance 25 years later (1951) is shown by the second blue bar (about $780,000).  The 70th person retired in 1995 with an ending account balance in 2019 of roughly $800,000.

Among these 70 hypothetical retirees, the average annual withdrawal over their respective 25-year withdrawal periods (up to the age of 97) was $106,104 (see Table 1). The average ending account balance after 25 years was $1,429,371—or more than $400,000 larger than their starting balance (in nominal terms).

Note the three summary statistics in the upper left corner of Figure 1. The first is called “Take Five.” It represents the frequency at which the portfolio balance after five years of annual withdrawals exceeded  the starting balance. Based on our assumptions, this occurred 82.9% of the time. The relationship between the dotted black line and the dotted red line allows retirees to see that their portfolios can in many cases grow over the course of retirement.

The second statistic is “Hang in There.” It represents the percentage of time the portfolio balance after 25 years exceeded the account balance at five years. The relationship between the horizontal dotted black line and the vertical blue horizontal bars visualizes this fact. In two cases, the portfolio was “underwater” (below the starting value of $1 million) after 5 years, but rebounded to finish well above $1 million after 25 years.  These long-term views help protect clients from the effects of “recency bias” (extrapolating a recent trend into the future) and helps them avoid panic-based decisions after a market hiccup. 

Said differently, a rough initial sequence of returns does not necessarily presage that the portfolio will die an early death. So, the client can hang in there.  This statistic shows that, even after a poor five-year performance, a retirement portfolio is likely to rebound more than half the time. The portfolio glass is actually more than half-full. Sadly, many retirees operate with a fear-based “glass half empty” mindset when it comes to the durability of their portfolios. This analysis help change pessimism to optimism.

The third statistic in Figure 1 is “Growing the Nest Egg.” It refers to the percentage of time that the ending account balance exceeded the starting balance after 25 years on a nominal basis. Based on our assumptions, this occurred nearly 73% of the time over the 70 rolling 25-year periods in this analysis.  That’s another reason for the retiree to feel optimistic about the future. 

Does optimism fade at some point?

So far, we have only examined a portfolio that uses the annual RMD withdrawal starting at age 72 (and no withdrawals in excess of the RMD). What if a person starts withdrawing from a portfolio that is not subject to the RMD, and is uncertain how much to withdraw each year? Below is a summary of the outcomes 25 years later, based on a variety of annual withdrawal rates from the same portfolio described above. As in Table 1, the results shown in Table 2 are based on 70 rolling 25-year periods from 1926-2019.

Table 2.  Withdrawing a fixed percentage of the portfolio balance at the end of each year


As you can see, the higher the withdrawal rate, the greater the chance that income would decline from one year to the next, and the greater the drop in income when a decline occurs. But, again, this analysis can be encouraging for the client. The drop in income never exceeds five percent and, because we adjust income downward after a down year in the market, the portfolio never fails in the long run.

Table 3.  Withdrawing an inflation-adjusted amount each year

Table 3 offers scenarios where the annual withdrawal percentage is raised to keep pace with increasing expectations for inflation. For this more aggressive withdrawal strategy, the results are not as encouraging. A retirement portfolio is much more likely to experience long-range failure when a fixed, inflation-adjusted withdrawal strategy replaces a percentage-based withdrawal strategy.

The spreadsheet I’ve introduced is a powerful teaching tool. It allows an advisor to engage a client in a conversation that involves a variety of “what-if” scenarios that can be visualized within seconds. To schedule a demonstration of the spreadsheet please contact the author via email at [email protected].

© 2020 Craig Israelsen. Used by permission of the author.

Now Divesting: AIG, Equitable and Great American

Three major publicly held annuity issuers have announced major restructuring moves—a signal that COVID-19 and low interest rates are adding fuel to a life/annuity industry shakeup that began soon after the 2008 financial crisis and has only accelerated since.

Here’s what happened this week:

  • AIG announced that it would spin off its life and retirement division, the source of about one-third of its $49 billion in annual revenues, as a separate company.
  • Great American Life and its parent, American Financial Group, announced a reinsurance deal that would send $5.7 billion in fixed annuity contracts to Global Atlantic Financial. This will free-up hundreds of millions in capital for Great American.
  • Equitable said it would reinsure $12bn in old expensive, variable annuity contracts with income benefits through Venerable Holdings and release about $1.2bn for Equitable.

These deals are allowing established annuity issuers to improve their balance sheets by transferring business they don’t want to reinsurers or a new breed of “insurance solutions” providers who do want it. It’s also unlocking hundreds of millions of dollars of reserve capital that Equitable and Great American can apply to more profitable business lines, new ventures or share buybacks.

“The long-dated liabilities associated with many life insurance and annuity contracts are under pressure from declining investment returns, while other businesses (property/casualty insurance, group businesses, international operations) are now viewed more favorably by institutional investors in publicly traded stock,” said ALIRT, the insurance research firm, in a report issued Wednesday.

Venerable to reinsure Equitable’s AXA-era variable annuities

Equitable Holdings (formerly part of AXA, the French financial giant) agreed to a deal where Venerable Holdings, Inc., will reinsure legacy “Accumulator” variable annuity policies sold between 2006-2008 backed by approximately $12 billion of general account assets.

“The transaction accelerates the Company’s strategic actions to de-risk its balance sheet and shift towards less capital-intensive businesses,” Equitable said in a release this week. AllianceBernstein will be the preferred investment manager for the assets.

As part of the transaction, which is expected to close in the second quarter of 2021, Venerable will buy Equitable’s runoff variable annuity reinsurance entity, Corporate Solutions Life Reinsurance Company. 

Source: Equitable.

The transaction will generate “approximately $1.2 billion of value for Equitable Holdings on a Statutory basis, which includes an expected $800 million capital release, a positive ceding commission and consideration for Corporate Solutions Life Re totaling approximately $300 million subject to adjustment, and approximately $100 million in tax benefits, according to an Equitable release. Equitable called it a first-ever deal to reinsure a block of variable annuity business. 

Equitable’s board has approved share repurchases of $500 million in 2021, subject to the close of the Venerable deal. Voya Investment Management will continue to be the preferred asset manager for Venerable’s existing book of business.

As part of the transaction, Equitable Holdings is discussing taking a 9.9% equity stake in Venerable’s parent, VA Capital Company LLC, including a board seat. Equitable will continue to administer the variable annuity contracts for the contract owners.

Commonwealth to reinsure Great American fixed annuities

In another multi-billion dollar deal, Great American Life’s parent, American Financial Group, Inc., agreed to a deal where Commonwealth Annuity and Life Insurance Co. will reinsure $5.1 billion worth of fixed indexed annuities and $600 million worth of fixed annuities issued by Great American, taking on both the liabilities and the underlying assets.

The blocks represent about 15% of Great American’s in-force annuity business. Commonwealth is a unit of Global Atlantic Financial Group, which is being acquired by private equity giant KKR.

The deal will improve the profitability of the $34 billion in annuity reserves that Great American is keeping. “The assets transferred under the agreement have a lower average yield than AFG’s overall annuity portfolio yield, and the policies ceded have an overall cost of funds that is higher than that of AFG’s retained business,” a press release said. “AFG expects to earn an increase in the net interest spread on its retained $34 billion of annuity reserves.” 

The deal will also release capital that was backing the blocks. According to the release,  “As a result of the assets and reserves transferred in this transaction, this agreement is expected to free up between $300 million and $325 million of Great American’s statutory capital in the fourth quarter of 2020. The transaction is expected to create $375 million to $400 million of additional excess capital for AFG.”

AIG to spin off its Life & Retirement division

Last Monday, American International Group, Inc. (AIG) announced its intention to separate its Life & Retirement business from AIG in order to “create value for shareholders and benefit all stakeholders,” according to an AIG release.

AIG also announced that Peter Zaffino, AIG’s current President, will become AIG’s Chief Executive officer in March 2021 (succeeding Brian Duperreault).

Like Equitable and Great American, AIG has engaged in reinsurance transactions. According to ALIRT, in 2018, the AIG life insurers entered into a reinsurance agreement with Fortitude Re (previously an affiliated company) to reinsure certain closed blocks of life, health, and annuity business.

AIG has sold the vast majority of Fortitude Re and retains a small (3.5%) ownership stake in the company. The reinsurance transactions were executed on a modified coinsurance basis, and as a result the AIG U.S. life insurers (AGL, USLNY, and VALIC) retain the legal control of the policy liabilities and the assets that are in support of those liabilities.

AM Best commented on Tuesday that the Long-Term Issuer Credit Rating (Long-Term ICR) of “bbb” of American International Group, Inc. (AIG) (headquartered in New York, NY) remains unchanged following its announcement to pursue a separation of its life and retirement business.

“Historically, the consolidated group has benefited from the operational profitability and diversification brought by AIG L&R,” AM Best said in a release. “However, AM Best notes the significant changes in underwriting, volatility reduction actions taken through reinsurance purchases and product portfolio repositioning that have been implemented at AIG PC over the last few years, all of which have improved AIG PC’s operational profile.

AM Best also has commented that the Financial Strength Rating (FSR) of A (Excellent) and the Long-Term ICRs of “a” of AIG’s property/casualty insurance subsidiaries (collectively referred to as AIG PC) remain unchanged. Concurrently, AM Best has commented that the FSR of A (Excellent) and the Long-Term ICR of “a” for the members of the AIG Life & Retirement Group (AIG L&R) also remain unchanged.  The outlook of these Credit Ratings (ratings) is stable.

(c) 2020 RIJ Publishing LLC. All rights reserved.

Annuity sales survive COVID-19, but trail 2019: LIMRA SRI

Total annuity sales were $54.8 billion in the third quarter of 2020, up 13% from the second quarter 2020 but 8% lower than prior year results, according to preliminary results from the Secure Retirement Institute (SRI) US Individual Annuity Sales Survey.

“Annuity manufacturers and distributors have largely overcome the operational hurdles caused by COVID-19 and social distancing measures, which has helped improve sales of most product lines, compared with second quarter results,” said Todd Giesing, senior annuity research director, SRI. “However, extremely low interest rates and continued market uncertainty are keeping many investors on the sidelines. As a result, the annuity market remains below 2019 sales levels.”

The bright spot continues to be registered index-linked annuities, or RILAs.  They saw their 23rd consecutive quarter-over-quarter sales growth, rising 33% to $6.4 billion. Year-to-date, RILA sales were $15.8 billion, up 26% from 2019 results. 

“In this economic environment, RILA products are very attractive to investors seeking downside protection with greater growth potential,” Giesing said in release. “In addition, we are seeing more carriers enter the RILA market, also spurring RILA growth.” 

Source: LIMRA Secure Retirement Institute, October 28, 2020. $ in billions.

While total variable annuity (VA) sales dropped 10% in the third quarter of 2020 (from 3Q2019) to $23.9 billion, this was 7% higher than second quarter results. In the first nine months of 2020, VA sales were $70.7 billion, down 6% from the first three quarters of 2019. SRI expects VA sales to remain steady in the fourth quarter and to reach $89-$94 billion by the end of 2020.

Total fixed annuity sales were $30.9 billion in the third quarter, 11% higher than second quarter but 6% below prior year’s results. In the first nine months of 2020, fixed annuity sales dropped 19% to $88.5 billion. Fixed annuities represented 56% of the total U.S. annuity market.

Fixed indexed annuity (FIA) sales continued to falter in the third quarter. FIA sales fell 29% to $13.2 billion. Year-to-date, FIA sales totaled $41.4 billion, falling 27% compared with 2019. Fixed-rate deferred annuity sales were $14.6 billion, up 47% from third quarter 2019. Year-to-date, fixed-rate deferred annuity sales totaled $37.2 billion, 2% lower than prior year results.  

“Fixed-rate deferred annuities recorded the second highest sales since the Great Recession. For investors seeking a safe place to put their money during this period of increased volatility, there isn’t another product that can compete with fixed-rate deferred crediting rates, which are, on average, 50 basis points higher than CDs,” the release said. 

“That said, demand for this product declined as the quarter unfolded,” Giesing added. “We expect fixed-rate deferred annuity sales will drop to $10-$12 billion in the fourth quarter but overall sales should be level with or exceed 2019 sales results, despite the challenging interest rate environment.”

Historically-low interest rates continue to undercut income annuity sales. Single premium immediate annuities (SPIAs) were $1.2 billion in the third quarter, 14% below second quarter results and 48% below third quarter 2019. This is the lowest quarterly level of SPIA sales in 16 years. Year-to-date, SPIA sales were $4.5 billion, down 42% compared with sales results from the first nine months of 2019.

Deferred income annuity sales (DIA) fell 31% in the third quarter to $410 million. Year-to-date, DIA sales were $1.23 billion, dropping 37% from prior year results. “Income is expensive under current market conditions. Investors are likely waiting for interest rates to improve before purchasing an income annuity,” said Giesing.

Preliminary second quarter 2020 annuities industry estimates are based on monthly reporting, representing 88% of the total market. A summary of the results can be found in LIMRA’s Fact Tank.

The top 20 rankings of total, variable and fixed annuity writers for the first half of 2020 will be available around mid-November, following the last of the earnings calls for the participating carriers.

© 2020 RIJ Publishing LLC.

What Trump’s Tax Returns Reveal

The New York Times account of President Trump’s tax returns reveals far more than his personal ability to avoid taxes. They show how the tax law can make it easy for the very wealthy to avoid taxation. And they reveal more than deficiencies in the tax law.

Bankruptcy laws allow wealthy investors to shift losses to others even while they retain gains elsewhere, bank lending practices favor the rich, and for the last three decades monetary has subsidized highly leveraged wealthy investors by driving borrowing costs ever lower and creating a huge wealth bubble that has saved even the most inefficient of investors.

Whether the president engaged in questionable or even illegal tax practices is only a small part of this story. But by focusing on his personal behavior, Congress may miss an opportunity to address the broader issues of fairness and equity and economic growth. Poor tax and economic policy can spur inefficient investment and concentrate opportunity on too few people.

One way the very rich avoid tax is through the discretionary nature of the individual income tax for investors. That is, the income from appreciated property (capital gains income) is not included in taxable income until the underlying asset is sold, a discretionary step taken by the investor.

In the early 1980s I calculated that less than one-third of the net income from capital showed up on tax returns. Studies comparing income declared on individual income tax returns with wealth reported in estate tax returns implied that taxpayers reported a rate of return often hovering around two percent, when the value of stocks and other assets rose by an average of around 10% per year. Close to one-third of wealthy people in each of the years examined declared a return on their income tax returns of less than one percent on their wealth.

While owners of corporations often do indirectly pay corporate income tax, large real estate investors typically use pass-through business and have long been close to exempt from both corporate and individual taxation. In the heyday of the tax shelter era of the 1980s, when real estate investors were making money while shielding other income with huge losses, members of the Senate Finance Committee wondered aloud whether Treasury would collect more revenue if the tax law simply exempted the investments from tax.

Further, if property is held until death, no income tax ever is owed on any accrued but unrealized gains. While gains can be deferred or excluded from tax at death, property owners can immediately deduct almost all expenses on their tax returns.

Interest costs are among the most important of those deductible costs, and the nominal interest costs written off are often a multiple of the real costs of borrowing. For example, if annual inflation is two percent and annual borrowing costs are four percent, the taxpayer deducts twice the real expense of the borrowing. The most highly leveraged investors receive the most benefits.

Investors in real estate can also take advantage of “like-kind” exchanges that allow them to swap real estate properties with another owner and defer the recognition of any capital gains income from the investment.

In this “Heads-I-Win, Tails-You-Lose” world, owners can declare bankruptcy of one company that is performing poorly while maintaining ownership of others that may be thriving. Earn $5 million on an investment in one company, lose $6 million in another; declare company bankruptcy in the second case, and the owner can come out ahead, while others bear the cost.

Bank lending practices, such as the Deutsche Bank loans to Trump, provide a third source of protection. Employees and officers of large financial institutions can make big money even for bad investments. They can earn promotions and bonuses by boosting the institution’s cash flow, at least until everything blows up. And, of course, those bonuses and promotions usually can’t be recaptured.

Finally, by creating real interest rates on short term debt that are close to zero, monetary policy can make the real cost of borrowing also close to zero or even negative after the taxpayer deducts nominal interest costs in excess or real interest payments. As one result, the ratio of household wealth to income rose remarkably from the early 1990s to today, generating at least an additional $25 trillion of nominal wealth over and above a normal growth rate. Recent efforts by the Federal Reserve to buy up all sorts of debt to keep the financial system functioning has further protected wealthholders even in the midst of the current COVID-19 crisis.

As noted above, all these policies have contributed significantly to increases in wealth inequality while they protected even the most inefficient investors. Trump’s tax returns may be just the tip of the iceberg, only one piece of visible evidence on a set of economic policies that may continue to lead to years of sluggish growth.

This column originally appeared on TaxVox on October 19, 2020.

Honorable Mention

SEC to air October 26 public hearing on ‘Reg BI’ 

Commission (SEC) has announced the agenda and panelists for its October 26, 2020, roundtable, where Commission staff and FINRA will discuss initial observations on Regulation Best Interest and Form CRS implementation.

The event will be webcast to the public. No registration or pre-registration is required.  The roundtable will be publicly viewable on Monday, October 26 at 1:00 p.m. ET on SEC.gov.  It will also be recorded and archived to enable viewing at a later date.

Panelists at the roundtable will discuss initial observations on the implementation of Regulation Best Interest and Form CRS. Separately, market participants and other members of the public may continue to send interpretive questions to the Commission’s Inter-Divisional Standards of Conduct Implementation Committee at [email protected].

Agenda and schedule
Monday, October 26, 2020 1:00 – 3:00 p.m. ET
Webcast on SEC.gov

1:00 p.m. Opening Remarks

  • Jay Clayton, Chairman, SEC

1:15 p.m. Panel One Regulation Best Interest – Issues and Observations

  • John Polise, Associate Director, Broker-Dealer and Exchange Examination Program (BDX), Office of Compliance Inspections and Examinations (OCIE)
  • Lourdes Gonzalez, Assistant Chief Counsel for Sales Practices, Division of Trading and Markets
  • Rina Hussain, Assistant Director, BDX, OCIE
  • Bill St. Louis, Senior Vice President, Member Supervision, FINRA

2:00 p.m. Panel Two: Form CRS – Issues and Observations

  • Jim Reese, Chief Risk and Strategy Officer, OCIE
  • Melissa Gainor, Assistant Director, Division of Investment Management
  • Alicia Goldin, Senior Special Counsel, Division of Trading and Markets
  • Jim Wrona, Vice President & Associate General Counsel, FINRA

2:45 p.m. Concluding Remarks

  • Peter Driscoll, Director, Office of Compliance Inspections and Examinations

Plan participants want lifetime income options: Lincoln Financial

A new consumer survey by Lincoln Financial Group suggests that employees prefer employers that offer guaranteed income options in their retirement plan, with nearly two-thirds calling it a “wow factor” when considering a job offer. More than seven in 10 employees say all employers would ideal offer an in-plan guaranteed income investment option, the survey showed.

Lincoln Financial recently introduced PathBuilder, a lifetime income benefit rider that can be attached to a target-date fund or other QDIA (qualified default investment alternative) in a qualified retirement plan. The SECURE Act of 2019 smoothed the way for annuities in qualified plans by limiting an employer’s liability for its choice of an annuity provider.

From 2016-2019, the number of plans offering in-plan guaranteed income investment options declined, despite many recordkeepers offering these solutions. Following the passage of the SECURE Act nearly 10 months ago, however, it is now easier for plan sponsors to offer a plan design that includes the option for participants to generate guaranteed retirement income,” Lincoln said in a release this week.

In Lincoln’s survey, seven in 10 respondents said they would use a guaranteed income-producing investment if offered. The same percentage said these solutions would help them budget in retirement and feel more prepared for retirement. More than half of respondents preferred to be automatically enrolled in an in-plan guaranteed investment option.

“In planning for retirement, the ultimate outcome is income,” said Jamie Ohl, Executive Vice President, President, Retirement Plan Services, Head of Life & Annuity Operations, Lincoln Financial Group, in the release.

While 87% of Baby Boomers look to Social Security for retirement income and 41% expect income from pension plans, only 21% of Millennials, the largest generation in the workforce, expect a pension and only half expect Social Security benefits, the release added.

In a custom target-date portfolio with a PathBuilder rider, the “account balances will automatically transition over time, to an investment that can provide lifetime income. Participants can then choose to take this as a regular check that will last throughout their retirement to help ensure their basic expenses are covered,” Lincoln said.

All data in this release, unless otherwise noted, is based on research done by Lincoln Financial Group, using the Qualtrics survey platform, with responses gathered from 1043 U.S. Adults from Sept. 3, 2020 – Sept. 14, 2020. The sample included quotas to be representative of the total U.S. adult population. 

Pandemic creates anxiety about Social Security: Wells Fargo

COVID-19 has raised fresh concerns about Americans’ retirement preparations, with some saying the pandemic has permanently impacted their ability to save for retirement, according to the 2020 Wells Fargo Retirement study conducted by The Harris Poll in August, which examines the attitudes and savings of working adults and retirees.

Fifty-eight percent of workers impacted by the pandemic say they now don’t know if they have enough saved to retire because of COVID-19, compared to 37% of all workers. Moreover, among workers impacted by COVID-19, 70% say they are worried about how to make sure they don’t run out of money in retirement, 61% say they are much more afraid of life in retirement, and 61% say the pandemic took the joy out of looking forward to retirement.

Working men report median retirement savings of $120,000, which compares to $60,000 for working women, according to the study. Yet for those impacted by COVID-19, men report median retirement savings of $60,000, which compares to $21,000 for women.

Women and Younger Generations

Barely half of working women (51%) say they are saving enough for retirement, or that they are confident they will have enough savings to live comfortably in retirement (51%). Women impacted by COVID-19 have saved less than half for retirement than men and are much more pessimistic about their financial lives.

In addition, women impacted by COVID-19 are less likely to have access to an employer-sponsored retirement savings plan (59%), and are less likely to participate (77%).

Fifty-two percent of Generation Z workers say they don’t know if they’ll be able to save enough to retire because of COVID-19. Half say they are much more afraid of life in retirement due to COVID-19, and 52% say the pandemic took the joy out of looking forward to retirement.

Pandemic underscores importance of social insurance

Nearly all workers and retirees say that Social Security and Medicare play or will play a significant role in their retirement — a reality underscored by the pandemic. According to the study, 71% of workers, 81% of those negatively impacted by COVID-19, and 85% of retirees say that COVID-19 reinforced how important Social Security and Medicare will be or are for their retirement.

Overall, workers expect that Social Security will make up approximately one-third of their monthly budget (30% median) in retirement. And even among wealthy workers, Social Security and Medicare factor significantly into their golden year plans — high-net-worth workers (with >$1 million in household investable assets) expect Social Security to cover 20% (median) of their monthly expenses.

The dependence by many on the programs also drives anxiety: The vast majority of the study’s respondents harbor concerns that the programs will not be available when they need them and worry that the government won’t protect them.

According to the study:

  • 90% of workers would feel betrayed if the money they paid into Social Security is lost and not available when they retire.
  • 76% of workers are concerned Social Security will be raided to pay down government debt.
  • 72% of workers are afraid that Social Security won’t be available when they retire.
  • 67% of workers have no idea what out-of-pocket healthcare costs will be in retirement.
  • 45% of workers are optimistic that Congress will make changes to secure the future of Social Security.
  • 23% of workers are willing to accept less from Social Security to help pay down the national debt.
  • 76% of workers and 81% of retirees say retirement should be a top priority for the presidential candidates
  • 88% of workers and 91% of retirees say Congress needs to make it easier for workers to access tax-friendly retirement plans.
Glass half full

A majority of workers say they are very or somewhat satisfied with their current life (79%), in control of their financial life (79%), are able to pay for monthly expenses (95%), and feel confident they are able to manage their finances (86%). Sixty-nine percent of workers and 73% of retirees feel in control and/or happy about their financial situation.

In addition, 92% of workers and 91% of retirees say they can positively affect their financial situation, and 90% of workers and 88% of retirees say they can positively affect how their debt situation progresses. And 83% of workers say they could pay for a financial emergency of $1,000 without having to borrow money from friends or family. Slightly more than half — 54% of workers and 50% of retirees — say they have a detailed financial plan, and just 27% of workers and 29% of retirees have a financial advisor.

Empower marks year of extraordinary growth

With its sixth anniversary approaching, Empower Retirement, the nation’s second-largest retirement services provider, is announcing record sales growth and new client commitments totaling some $110 billion.

Empower announced some $4.3 billion in strategic acquisitions in the 92 days from June 29 to Sept. 28. In the last year, the company has taken in approximately $110 billion in new client commitments, which include new 401(k), 457(b) and 403(b) defined contribution plans of all sizes covering corporate, government and not-for-profit employers.

The $110 billion represents funded and committed sales from the 12-month period that ended Sept. 30. In the large and mega market (plans with more than $50 million in assets), Empower has signed 64 new clients, 130 new public plan clients, 15 not-for-profit clients, and over 3,200 advisor-sold clients with less than $50 million in assets.

In September, Empower announced the acquisition of the retirement businesses of MassMutual and Fifth Third in transactions that, when closed, will amount to an estimated 2.5 million new participants on the Empower recordkeeping platform. The transactions are expected to close later in 2020 pending regulatory approval.

The MassMutual retirement plan business comprises 26,000 workplace savings plans through which approximately 2.5 million participants have saved $167 billion in assets. Following the close of the transaction (pending regulatory approval) and combined with new organic sales, Empower will have nearly 13 million participants on its platform and more than $800 billion administered in approximately 67,000 workplace savings plans.

Empower was created by bringing together the retirement companies of Great-West Financial, Putnam Investments and JP Morgan Retirement Plan Services.

Financial Times announces top 401 retirement plan advisers of 2020

The Financial Times has published its sixth annual list of the FT 401 Top Retirement Plan Advisers. The ranking of top advisers to 401(k) plans and other defined contribution (DC) retirement programs was developed in collaboration with Ignites Research, an FT subsidiary that provides business intelligence on the investment management industry. 

The list represents an elite group of professionals, with the average FT 401 adviser managing $2.01bn in DC plan assets, up 22% from last year. The advisers in the FT 401 are true retirement specialists: DC plans account for an average of 86% of the FT 401 advisers’ overall client assets.

The pandemic and related market volatility in 2020 spurred employers to rely on the guidance of elite plan advisers like the members of the FT 401. Most plan sponsors did not panic: the average FT 401 adviser estimated that 81 per cent of plan clients didn’t make major changes to their plans.  

Another consequence of 2020’s dramatic events has been the embrace of virtual meetings, which has enabled plan advisers to hold more remote meetings with individual plan participants (both in groups and one-on-one). An overwhelming 94% of FT 401 advisers expect to continue doing more remote meetings with investors even after the pandemic fades.

“The widespread uncertainty this year has spurred more workplaces to offer ‘financial wellness’ programs that aim to educate employees about saving for retirement, managing debt, and other basics of personal finance. Some 79% of FT 401 advisors now offer online classes to DC plan participants, up from 72 %t the prior year. A more productive focus on financial literacy could be one of the legacies of 2020,” said Loren Fox, Director of Ignites Research and head of the FT 401 ranking.

Top advisers hail from 41 states across the country, plus Washington D.C. The largest number of advisers reside in California (47) followed by Texas (36) and Massachusetts (27). 

© 2020 RIJ Publishing LLC. All rights reserved.


Nationwide wants five pieces of the in-plan annuity market

Nationwide Financial announced this week that, starting in late 2020, it will introduce or begin marketing the first of at least five annuity products to sponsors of qualified retirement plan markets.

The first in-plan product will be a fixed indexed annuity for safe accumulation, said Eric Stevenson, president of Nationwide Retirement Plans since July 2019. Lifetime income riders and possibly deferred income annuities will follow.

Eric Stevenson

“We’ll take money starting in December. That’s when we have our marketing launch. It’s a fixed indexed annuity inside a retirement plan, and we believe that it’s the first product of its kind in the [institutional] market,” Stevenson told RIJ this week. “Typically, if you buy a retail annuity, you’ll pay a commission and have a CDSC [i.e., a penalty for early surrender]. But this will be inside the plan.” As a result, he said, costs will be much lower than in retail products.

According to PlanSponsor magazine, Nationwide is the ninth largest provider of retirement plans in the US by number of plans administered (about 34,500), with about $145 billion in participant assets. It is the top provider of governmental retirement plans (457 plans). It ranks 12th in numbers of participants, with about 2.74 million. Its business is concentrated in plans with under $10 million in assets (35%) and more than $200 million in assets (43%).

As of mid-2020, Nationwide was the tenth largest issuer of retail annuities, with first-half sales of $3.9 billion. That included $1.99 billion in fixed annuity sales (10th) and $1.9 billion in variable annuity sales (9th), according to LIMRA Secure Retirement Institute.

“In-plan annuities” are not new. Life insurers have been pitching lifetime income riders on target date funds for several years, but with little penetration. But the SECURE Act, which became effective at the start of 2020, is expected to encourage the adoption of annuities by plan sponsors as investment alternatives for participants.

The SECURE Act gives plan sponsors a specific method for choosing an annuity provider which, if followed, will reduce their risk of being sued for choosing a provider who, years or decades into the future, fails to meet its obligations to policyholders. It also allows participants to take their annuities with them if they change jobs.

Stevenson positions the FIA, whose gains are tied to equity indices through the purchase of options on the index, as a potentially higher-yielding replacement for low-yielding stable value funds in retirement plans. The value of the FIA would be reset once a year, but allocations to the fund would be fully liquid, according to the rules of the plan.

That product, to be introduced later this year, is an accumulation product. Regarding the in-plan income solutions that Nationwide expects to introduce next year, they will be income riders on target date funds. Stevenson didn’t say who the TDF provider might be; the top issuers of TDFs are Fidelity, Vanguard and T. Rowe Price, but Nationwide and other fund companies also offer them.

“We may use our own [TDFs], but we’re looking to work with partners,” he told RIJ.

TDFs are funds-of-funds whose asset allocations gradually become more conservative as an investor nears retirement. TDFs are also qualified default investment alternatives. That is, if new employees don’t actively choose to participate in a plan, the employer can auto-enroll them into it and allocate their contributions to a TDF.

“There are a number of ways to solve for income,” Stevenson told RIJ. “This is a new space. We’re not pretending to know what the right answer is. We’ll work with plan sponsors, advisers and 401(k) consultants to make sure we provide the right solution for each plan.”

Nationwide is one of three insurance companies that offer lifetime income riders to participants in the United Technologies 401(k) plan. Each month, the  three insurers bid against each other for the right to wrap their income riders around participant contributions to an AllianceBernstein TDF.  The low bidder gets most of that month’s business while the other two split what’s left. Stevenson said that Nationwide is also looking at offering a deferred income annuity as an in-plan option.

Other annuity issuers are expected to capitalize on the opportunity provided by the SECURE Act. Last July, Lincoln Financial announced its PathBuilder  annuity. The annual cost of the income option is 0.9% of the guaranteed income base (which may be higher than the actual account value, since it is protected against loss). At age 65, the payout rate for a married couple would be 4.5% of the income base per year, according to a PathBuilder brochure.

Stevenson said his target customers will be plan sponsors and their advisers or consultants. Although the SECURE Act also allows for the creation of Pooled Plan Providers (PPPs) and Pooled Employer Plans (PEPs)—single retirement plans that many companies can join—Stevenson did not expect Nationwide to market its in-plan annuities to PPPs or other sponsors of PEPs.

While it’s clear that annuity issuers want greater access to participants in 401(k) and other qualified retirement plans, participant demand for in-plan annuities is unproven. Industry-sponsored surveys show that 401(k) participants, like most Americans, want a source of safe income in retirement. But whether that will translate into allocations to annuities in retirement plans remains to be seen. 

The Fed’s low interest rate policy also forces annuity issuers to charge more for their guarantees because they earn less on their own investments. A lifetime income rider on a TDF, as noted above, can place 90 basis points (0.90%) of drag on the growth of the investments that are protected by the rider. Meanwhile, plan sponsors feel pressure (from class action lawsuits) to minimize the fees of their retirement plans. The SECURE Act is expected to add a tailwind to the adoption of in-plan annuities, but low rates could present a headwind.

© 2020 RIJ Publishing LLC. All rights reserved.

The future of longevity risk transfer deals

Reduced returns and longevity risk are making it challenging for employers to offer defined benefit pensions. Nevertheless, in some countries with large defined benefit pension plan sectors, sponsors are transferring these obligations and their associated investment and longevity risks, to life (re)insurers via buy-outs, buy-ins, and longevity swaps (Figure 1).

Little Institutional Investor Interest in Longevity Risk Transfer Markets

Thus far, (re)insurers have been hanging on to most of these risks themselves. This is in sharp contrast to catastrophe (CAT) risks, which (re)insurers are increasingly transferring to capital markets (Figure 2). Such transfers have taken the form of CAT bonds and collateralized reinsurance products. Meanwhile, there has been no longevity bond issuance, and there have been only a few, albeit large, longevity swap transactions.


The largest longevity risk transfer markets in operation today are in the United Kingdom and the United States (Figure 1). In both cases, growth has been driven by the introduction of stricter pension disclosure standards, along with stricter regulations mandating risk-based guarantee schemes (2004 U.K. Pensions Act and 2006 U.S. Pension Protection Act).

Most pension longevity risk transfer today is achieved with buy-outs and buy-ins. Buy-outs transfer all the pension fund’s liabilities in return for an up-front premium, which in some cases is paid from an “in-kind” transfer of the pension fund’s assets (Daniel, 2016). In a buy-in, the sponsor retains the pension assets and liabilities, but it then receives periodic payments from an insurer in return for an up-front premium, to cover promises made to pension participants.

Longevity swaps transfer only longevity risk, and the premiums are spread over the life of the contract based on the difference between actual and expected benefit payments. This vehicle is typically combined with a liability-driven investing asset allocation approach, one which matches the expected cash flow profile to that of the pension benefit payments (plus an inflation swap if the plan offers indexed benefits; Citi, 2016).

Longevity risk might seem to be an attractive asset class for institutional investors, as it is likely to be largely uncorrelated with other risk factors in their portfolios. In 2012 and 2013, Dutch insurer Aegon successfully executed two such swaps totaling €13.4 billion targeted at institutional investors (Whittaker 2012; Osborn 2013). Nevertheless, there have apparently been no similar transactions since then.

What Can Longevity Risk Transfer Markets Learn from Catastrophe Risk Transfer Markets?

(Re)insurers are using CAT risk transfer markets to finance and diversify their coverage of low-probability high-severity event risk. They are attractive to (re)insurers because most market-based CAT risk transactions are fully collateralized against peak exposures, so if there is such an event, they pay out more quickly than reinsurance. They are attractive to institutional investors, most of whom invest via specialist funds because of the attractive yields.

Collateralized reinsurance, CAT bonds, and sidecars comprise over 90% of alternative CAT risk transfers (Aon, 2020). Here investors make an up-front investment which collateralizes the peak risk coverage. In exchange for assuming the risk of principal loss, they pay interest/premia until redeemed at maturity, unless a loss event occurs, in which case some or all of the collateral is released to the (re)insurer. The differences between the types of transactions are mainly legal and structural.

If one looks to CAT risk transfer markets for how to ignite capital markets interest in longevity risk, the keys would seem to be short maturities and full collateralization to minimize credit risk. Yet there remains a tension between investor preferences for short-term instruments and the long-term nature of longevity risk exposures.

Academic Studies Suggest Ways of Broadening Longevity RIsk Transfer Market

MacMinn and Zhu (2018) suggest that value-based products with shorter terms could be more attractive to cedents than cash-flow based risk transfer. These could be facilitated by agreements between market participants regarding which mortality models to use for the design, and how to price each longevity-linked deal. More publicly-available granular data (e.g., disaggregated by geographic area, gender, socio-economic status, cause of death, and occupation) would also help.

There may also be tensions between (re)insurers’ preferences for indemnity transactions to minimize basis risk, versus investors’ preferences for standardized index-based transactions. (Re)insurers favor risk transfer products where indemnity triggers base event-contingent payments on actual losses, making them close substitutes for reinsurance contracts.

Still other investors prefer index-based, modeled, and parametric indices which mitigate moral hazard risks but expose reinsured parties to the basis risk that the coverage may not exactly match actual losses. Nevertheless, Michaelson and Mulholland (2014) and Cairns and El Boukfaoui (2019) provide some promising ways to bridge this gap. Biffis and Blake (2014) have proposed that an optimal format would entail a CAT bond-like tranched principal-at-risk instrument.

Will Longevity Risk Transfer Products Remain Niche Players?

It should be noted, however, that some analysts suggest that activating investor interest in longevity risk transfer markets is an intractable problem, because by hedging the risk, (re)insurers lose a valuable balance sheet put option (MacMinn and Brockett, 2017). Moreover, Zelenko (2014) suggests that markets may be held back by the moral hazard problem related to the perceived likelihood that the government would bail out (re)insurers and/or annuitants hit by systematic longevity risk events. The next decade will help resolve the differing perspectives.

Reprinted with permission of the author and the Pension Research Council, on whose website this blogpost appeared.

AIG brings FIA (with income rider) to market in New York

AIG Life & Retirement, a unit of American International Group, Inc., has launched the Power Index Premier NY Index Annuity with Lifetime Income Builder, a fixed index annuity (FIA) with an income rider developed exclusively for the state of New York. It is the first FIA with a guaranteed lifetime payout to be marketed in New York.

“There are two main differences in a product for New York. For the living benefit, you can’t charge an explicit fee, and the income must be based on the account value and not on a secondary ‘benefit base,’” said Bryan Pinsky, senior vice president of Individual Retirement Pricing and Product Development at AIG, in an interview.

“We now have a full suite of annuities in New York,” he added. “We have a fixed annuity for the conservative investor, the fixed indexed annuity, and, for more aggressive investors, the variable annuity. We’re still the only company with a fixed-rate annuity with a living benefit in New York.”

Payouts are age-based, but contract owners can increase their payout percentages by delaying income. For instance, a 65-year-old policyholder can receive a 5.15% payout. That percentage rises by 0.15% for every year that income is delayed. Someone who is 65 at purchase would receive a payout rate of 5.9% if he or she delayed income for five years. In addition, the account value can’t go down and grows by at least 1% every year.

Like other fixed annuities, Power Index Premier NY offers tax deferral, protection of principal against losses in down markets, and crediting methods linked to equity market indexes. The AIG annuity offers exposure to the performance of three equity indices—the S&P 500, Russell 2000 and MSCI EAFE.

As of October 13, 2020, the cap rates on offer for purchase premiums of $100,000 or more in contracts with no living benefit rider are 4%, 3.75% and 3.75% for the S&P 500 Index, Russell 2000 Index and MSCI EAFE Index, respectively. For contracts starting with less than $100,000, the caps are 0.75 percentage points lower. The crediting method is annual point-to-point, with gains locked in at every anniversary of the contract. For rate sheet, click here.

Adding an income benefit carries no explicit fee, but its cost appears in the form of a lower cap on gains. The cap on gains on the S&P 500 Index is 3% (2.50% for premiums under $100,000). For both the MSCI EAFE Index and the Russell 2000 Index, the cap on annual gains is 2.75% (2.25% for premiums under $100,000).

Like all FIAs, Power Index Premier NY does not directly invest client premium in indices. Instead, it uses a portion of the earnings of its general fund to buy options on the performance of an equity index. There is no market risk to principal, and contract value will not decline due to market fluctuations.

Power Index Premier NY is part of AIG’s Power Series of Index Annuities, which are issued by the United States Life Insurance Company in the City of New York (US Life), a subsidiary of AIG. Guarantees are backed by the claim-paying ability of US Life.

(c) 2020 RIJ Publishing LLC. All rights reserved.
Drama in Des Moines

Having spurned a takeover bid from insurance giants Athene Holding and MassMutual a few weeks ago, tiny American Equity Investment Life Holding Company, a leading issuer of fixed index annuities (FIAs), announced a deal this week with Brookfield Asset Management, Inc. [For related story, click here.]

Brookfield will reinsure $5 billion of its existing FIA liabilities and up to $5 billion more in the future. It will also acquire a 19.9% ownership interest in the common shares of American Equity. American Equity will use the Brookfield equity investment and cash on hand to buy back up to $500 million of its common shares, thus offsetting the dilution created by issuing new shares to Brookfield. The repurchases will begin after the third-quarter earnings report. 

This deal, combined with its partnerships with Agam Capital and Varde Partners (see below), gives American Equity all the elements it needs—a life insurer to issue fixed index annuities, an offshore reinsurer for capital arbitrage, and a private equity specialist for “liability origination”—necessary for it to practice the “Bermuda Triangle” strategy, as rivals Athene and Fidelity & Guaranty Life do.

In a release, American Equity said the deal will allow it and its stakeholders “to benefit from exposure to differentiated alternative asset strategies with long-term, contractual cash flows and deploy significant capital into proprietary Brookfield investments.” 

MassMutual and Athene sent a letter to American Equity on Sept. 8, offering to buy the company for $36 a share in a deal valued at $3 billion, according to the Des Moines Register. Brookfield offered $37. After the Wall Street Journal reported the deal on October 1, the stock price rose about 50%. The price dropped suddenly to about $26 on October 19, after the deal was cancelled. Athene, like American Equity, is based in Des Moines, Iowa.

American Equity said this week:

“After careful review with the assistance of its financial and legal advisors, American Equity’s Board unanimously determined that Athene and MassMutual’s unsolicited, non-binding proposal made public by Athene on October 1, 2020 is opportunistic, significantly undervalues the Company, and is not in the best interests of American Equity and its shareholders and other stakeholders.”

These events add a new episode to the story of annuities over the past five years. Private equity firms have been buying or partnering with fixed annuity issuers. The deals are mutually beneficial. On the one hand, they give insurers access to the private equity firms’ investment skills at a time when low interest rates make it hard for issuers to keep promises made when rates were higher.

For their part, private equity and asset management firms get access to multi-billion blocks of fixed annuity liabilities. They can re-invest some of the general account assets underlying those liabilities in high-yield asset-backed securities. They can also sell blocks of annuity business to captive reinsurers in foreign havens like Bermuda that have lower reserve requirements. According to AM Best, the ratings agency, the reinsurance deal with Brookfield will free up as much as $350 million in regulator capital for American Equity.

American Equity, Agam and Varde

Founded in 1995, American Equity has fewer than 700 employees. But it has been a leading seller of FIAs in the independent agent channel for almost two decades. It also has some $53 billion in policyholder funds under management. Those funds stand to be better invested by American Equity’s recently added asset management partners—Agam Capital Management, Varde Partners and now Brookfield.

Brookfield’s equity investment in American Equity will take place in two stages: an initial purchase of a 9.9% equity interest at $37.00 per share (promptly following Hart-Scott-Rodino approval), and a second purchase of a 10.0% equity interest, at the greater value of $37.00 per share or adjusted book value per share (excluding AOCI and the net impact of fair value accounting for derivatives and embedded derivatives).

The second equity investment is subject to finalization of certain reinsurance agreement terms, receipt of applicable regulatory approvals and other closing conditions. It is expected to close in the first half of 2021.

Brookfield agreed not to transfer any common shares purchased in the equity investment for a period of two years after the applicable closing of the investment, as well as to customary standstill restrictions until the five-year anniversary of the initial equity investment. Brookfield will also receive one seat on American Equity’s Board of Directors following the initial equity investment.

In the release, Anant Bhalla, president and CEO of American Equity, said: “This partnership accelerates the transformation of our business toward a ROA model from our historical focus on ROE, unlocks new investment opportunities, and enables us to deliver significant value to our shareholders and policyholders.”

According to the release, the transaction:

  • Provides access to Brookfield’s higher-returning alternative asset strategies, which may generate sustained returns in a low interest rate environment.
  • Provides access to permanent capital and supports new products, including IncomeShield.
  • Accelerates the transformation of American Equity’s business model from return on equity (ROE) toward return on assets (ROA) and releases capital available for share repurchases, organic growth, and strategic initiatives.
  • Builds on AEL’s partnership with Värde Partners and Agam Capital Management, LLC.

Regarding the buyback of $500 million in shares, the specific timing of repurchases and the exact number of common shares to be purchased will depend upon market conditions and other factors, the release said. Under the repurchase program, repurchases can be made using a variety of methods, including open market purchases.

J.P. Morgan and Morgan Stanley & Co. LLC are serving as financial advisors to American Equity. Ardea Partners is serving as exclusive financial advisor to American Equity in the Brookfield transaction. Skadden, Arps, Slate, Meagher & Flom LLP is acting as legal counsel to American Equity.

Brookfield Asset Management is a global alternative asset manager with approximately US$550 billion of assets under management across real estate, infrastructure, renewable power, private equity and credit. It owns and operates long-life assets and businesses, and offers alternative investment products to public and private pension plans, endowments and foundations, sovereign wealth funds, financial institutions, insurance companies and private wealth investors.

Following the transaction, AM Best said that the Financial Strength Rating of A- (Excellent) and the Long-Term Issuer Credit Ratings (Long-Term ICR) of “a-” of the members of American Equity Investment Group (Iowa) remain unchanged following its announcement that Brookfield Asset Management Inc. will acquire a minority interest in American Equity Investment Life Holding Company (AEILHC) (West Des Moines, IA). Concurrently, AM Best has commented that the Long Term ICR of “bbb-” of AEILHC and its existing Long-Term Issue Credit Ratings also remain unchanged. The outlook of these Credit Ratings is stable.

(c) 2020 RIJ Publishing LLC. All rights reserved.
Honorable Mention

Protective’s new fee-based VA available at RetireOne

RetireOne and Protective Life have teamed up to bring a new, low-cost advisory variable annuity to market. The Protective Investors Benefit Variable Annuity has a mortality and expense risk fee of only 30 basis points and low-cost subaccounts from Vanguard and DFA.   

“After acquiring Great-West Life last year, our goal was to capitalize on competitive positioning in the advisory marketplace by delivering solutions that offer tremendous value for investors and the RIA firms who serve them,” said Aaron Seurkamp, President, Retirement Division at Protective Life, in a release. 

“As financial advisors aim to reduce fees to improve portfolio performance, Protective endeavored to lower mortality and expense charges, and strip out unnecessary costs like fund facilitation fees and surrender penalties. The result is an efficient accumulation solution ideal for lowering the costs of expensive client annuities and extending tax deferral to investors who’ve maxed out their 401(k) and IRA plans,” the release said.

[Annual mortality and expense (M&E) risk charges, despite the name, typically represent an insurer’s gradual recovery of the upfront commission it paid to advisers on B-share variable annuities, as well as covering unexpected changes in mortality rates. The M&E fee for no-commission annuities is therefore substantially lower.]

Serving over 900 RIAs and fee-based advisors since 2011, RetireOne is an independent platform for fee-based insurance solutions. Through the fiduciary platform, RIAs can access products from multiple ‘A’ rated companies at no additional cost to them or their clients. RetireOne currently services over $1 billion of retirement savings and income investments. 

Protective Life Corporation produces, a subsidiary of Dai-ichi Life Holdings, Inc., distributes and administers insurance and investment products throughout the U.S. As of June 30, 2020, Protective had assets of approximately $123 billion. 

U.S. could save trillions in health care costs in coming decades: McKinsey

A new report from McKinsey & Co.’s Center for Societal Benefit through Healthcare, “How Prioritizing Health is a Prescription for US Prosperity,” shows how much room for improvement there is in the U.S. in terms of preventing and treating chronic health conditions that create drag on the non-health care segments of the economy.

“We estimate that each year, poor health costs the US economy about $3.2 trillion from premature deaths and the lost productive potential associated with diseases,” the report said. “The five diseases with the biggest economic impact are, in order, musculoskeletal disorders (e.g., arthritis, osteoporosis, and carpal tunnel syndrome), mental disorders, neurological disorders, substance use disorders, and diabetes and kidney disease.”

Better health would give people the freedom to spend their leisure time on what they want to do most, McKinsey believes. This includes older people, many of whom may choose to give back to society in other ways after retirement. “In fact, through volunteering alone, we estimate that having a larger population of healthier people aged 65 and up could add $9 billion to $13 billion in societal value in 2040,” the report said.

Vanguard adds new manager to its International Value Fund

Vanguard has added Sprucegrove Investment Management Ltd. to its roster of active managers. Effective October 12, 2020, Sprucegrove will manage the 35% of the Vanguard International Value Fund previously overseen by Edinburgh Partners Limited.  

A Toronto-based boutique firm managing $13.8 billion, Sprucegrove will join Lazard Asset Management LLC and ARGA Investment Management, LP, in overseeing the $9.8 billion Vanguard fund. Arjun Kumar, CFA, and Shirley Woo, CFA, will co-manage Sprucegrove’s portion of the Fund. The Vanguard International Value Fund invests in companies from developed and emerging markets around the world that its advisers view as temporarily undervalued by the markets. 

As a result of Vanguard’s performance-based fee arrangements, the Fund’s expense ratio is expected to increase one (1) basis point to 0.38%. The average asset-weighted expense ratio for foreign large value funds is 0.98%, according to Lipper. Vanguard, though best known for index funds, is also one of the largest providers of actively managed funds in the world, with more than $1.6 trillion in active assets.

© 2020 RIJ Publishing LLC. All rights reserved.

The Five Most Important Retirement Income Decisions

It’s been well documented that many older workers approaching retirement have only modest retirement savings. As a result, middle-income pre-retirees can’t afford to make big mistakes regarding how to deploy their retirement savings and build a retirement income portfolio.

Pre-retirees will need to make critical decisions that help them squeeze the most retirement income from their financial resources over a potentially long retirement. Studies have shown that they often feel uncertain about these decisions; economic turmoil, such as the downturn caused by the pandemic of 2020, only serves to increase their uncertainty.

Steve Vernon

Two recently published research reports prepared by the Stanford Center on Longevity (SCL), in collaboration with the Society of Actuaries (SOA) provide valuable insights into these decisions. These reports identify and analyze a straightforward retirement income-generating strategy that can work effectively for most middle-income retirees and can be implemented using virtually any traditional IRA or 401(k) plan.

It’s called the Spend Safely in Retirement Strategy, or the “Spend Safely Strategy” for short. One of these reports—Viability of the Spend Safely in Retirement Strategy—develops a decision framework that pre-retirees can use to make critical retirement decisions, including how to build their portfolio of retirement income. From this decision framework, here are the five most important decisions regarding retirement income that most middle-income pre-retirees should address:

  1. When and how to retire (whether to work part time for a period of time)
  2. When to start Social Security benefits
  3. How to deploy retirement savings to generate retirement income
  4. Which living expenses to reduce in order to live on less income in retirement 
  5. Whether to deploy home equity by realizing capital gains and reinvesting the proceeds to generate
    retirement income, or by purchasing a reverse mortgage
Decision #1: When and How to Retire

Figure 1 below shows a graph from the Viability of the Spend Safely in Retirement Strategy report that projects total retirement income in the initial year of retirement at various retirement ages for a hypothetical 62-year-old married couple. Their household earnings are $100,000 per year, and they have $350,000 in retirement savings. This assumed savings amount is higher than the average and median savings levels accumulated by current older workers.

The analysis considers five scenarios:

  • Both members of the couple retire completely at age 62, and both immediately begin Social Security benefits and drawing down retirement savings.
  • Both keep working part time until their Social Security Full Retirement Age (66 and 6 months for this couple), then both start Social Security and drawing down their retirement savings. “Working part time” is defined here as earning enough to pay for their current living expenses but not continuing to contribute to their retirement savings.
  • Both continue working full time until their Social Security Full Retirement Age, then both start Social Security and drawing down their retirement savings. In this scenario, the hypothetical couple continues to contribute 10% of their pay to retirement savings.
  • Both keep working part time until age 70, then both start Social Security benefits and drawing down retirement savings.
  • Both continue working full time until age 70, then both start Social Security benefits and drawing down retirement savings.

Note that this couple’s projected total annual retirement income almost doubles when they delay retirement, from $37,585 when retiring at age 62 to $70,755 when retiring at age 70.  Although this specific example was for a married couple with assumed levels of earnings and savings, this example illustrates concepts that most likely will apply to many situations, including that of single retirees.

Note also that the amounts above represent the retirement income this couple can expect in the initial year of retirement. In future years, their Social Security income will increase due to cost-of-living adjustments, whereas the income from savings drawdown will depend on future investment earnings. In other words, the blue bars represent the portion of total retirement income that’s risk-protected, and the red bars represent the portion that’s subject to investment, inflation, and longevity risks.

For the example in Figure 1, the annual amount of retirement income generated by savings was calculated by assuming the retired couple would withdraw amounts equal to the IRS required minimum distribution (RMD) rates. The same methodology was used to calculate their retirement income before the age the actual RMD rules are required (currently age 70, changing to age 72 in 2021). There are also other viable methods of generating retirement income; these will produce different amounts of retirement income in the initial year of retirement and throughout retirement.

With Scenario 2 in Figure 1, both members of the couple deploy a downshifting strategy, working just enough from age 62 to age 66-1/2 to cover their current living expenses, which allows both Social Security and savings to grow.

Under Scenario 3, both members of the couple continue working full time and contributing to savings. Note that there isn’t a significant difference in the eventual retirement income between these two scenarios: $51,526 vs. $53,031. This result illustrates that most of the advantage of continuing to work results from the delay of starting Social Security and taking withdrawals from savings. Continuing to contribute to savings, while definitely helpful, adds relatively less to the eventual retirement income. Scenario 4 compares downshifting from age 62 to 70 with Scenario 5, working full time until age 70, with similar results.

These analyses show the potential advantage of a downshifting strategy for older workers who don’t want to or can’t continue working full time, but who haven’t saved enough for complete retirement.

Decision #2: When to Start Social Security Benefits

Social Security benefits provide the most risk protection of all sources of retirement income, protecting against longevity risk, inflation risk, investment risk, and cognitive risk. When a middle-income worker optimizes their Social Security benefits through a careful delay strategy, typically a very large percentage—often two-thirds, three-quarters, or more—of their total retirement income is risk-protected. Comparing the relative sizes of the blue and red bars in Figure 1 illustrates these outcomes.

As a result, it makes sense to maximize this valuable source of retirement income. To help with this goal, pre-retirees can use one of several online programs that help analyze the optimal age at which to start Social Security benefits.

Decision #3: How to Deploy Retirement Savings to Generate Retirement Income

The baseline Spend Safely Strategy uses the IRS required minimum distribution rates to calculate the annual income that’s generated from retirement savings. This strategy has a number of straightforward refinements and adjustments that can customize the baseline strategy to reflect specific goals and circumstances that retirees might have.

For example, retirees might choose to use a Social Security bridge strategy to increase the amount of their retirement income, as well as the portion of their total retirement income that Social Security will deliver and is risk protected. A Social Security bridge strategy uses retirement savings as a temporary substitute for the estimated income a retiree will ultimately receive from Social Security until they actually start their Social Security benefits. It can enable a worker to retire before the optimal age at which to start Social Security benefits.

Let’s see how a Social Security bridge strategy could increase the total retirement income in Scenario 3, where the couple works full-time until age 66-1/2. In this example, the husband of the couple would use a bridge strategy to delay Social Security until age 70. In this case, the total annual retirement income would increase from $53,031 to $57,637, without changing the retirement date.

Another refinement addresses retirees who might feel more comfortable with additional guaranteed, lifetime retirement income to supplement their Social Security income. In this case, they can use a portion of their savings to purchase a cost-effective single premium immediate annuity (SPIA) through an annuity bidding service.

To continue the current example for Scenario 3, if the married couple adopted a Social Security bridge strategy and, with remaining funds, purchased a SPIA with a 100% joint and survivor annuity, their total annual retirement income would further increase from $57,637 to $63,892 (using annuity purchase rates from ImmediateAnnuities.com in mid-June 2020). This amount is more than $10,000 higher than the base retirement income amount for Scenario 3.

While these two refinements have significantly increased total retirement income, they also reduce the amount of wealth that retirees can access if their circumstances change. Pre-retirees should consider this result carefully when deciding how much savings to devote to a Social Security bridge payment or to purchasing an annuity.

Other retirees may want to invest substantially in stocks for the potential to grow their retirement income. Since a large portion of their retirement income is already risk protected by Social Security, they might feel comfortable assuming some calculated investment risk. The SCL/SOA research report, Viability of the Spend Safely in Retirement Strategy, contains historical analyses that illustrate this basic retirement investing dilemma: Most of the time, but not always, retirees can potentially increase their retirement income by investing in stocks.

Decision #4: Which Living Expenses Can Be Reduced to Fit Decreased Income in Retirement

Conventional retirement planning wisdom advocates that retirees need a retirement income that replaces 70% to 80% of their pre-retirement income to continue their standard of living in retirement. Yet most older workers haven’t accumulated sufficient savings to achieve this goal.

Figure 2 shows that the hypothetical couple described earlier won’t approach these goals unless they both work until age 70.

Remember that this hypothetical couple has more retirement savings than most American workers their age. As a result, most older workers face a tough choice: work longer than they planned, reduce their standard of living, or do some combination of the two. To help matters, they can also explore alternative methods to generate retirement income from their savings, as illustrated by the previous example.

If a retiree needs to reduce living costs, housing often represents the largest target for most people. By relocating, retirees might also achieve other goals, such as moving to a home or neighborhood that will be more supportive in their later years.

Decision #5: Whether to Deploy Home Equity

Most retirees have more wealth in their homes compared to their retirement savings. If retirees’ Social Security benefits and income generated by savings aren’t sufficient to pay for their living expenses in retirement, they may need to explore ways to deploy their home equity. One straightforward method is to sell their home, realize a capital gain, downsize to a less expensive home, and then deploy the net proceeds to generate retirement income.

Another possibility is to use home equity to purchase a reverse mortgage. The SCL/SOA report, Optimizing Retirement Income by Integrating Retirement Plans, IRAs, and Home Equity, analyzes and compares three different methods to use a reverse mortgage to enhance retirement security. Any solution to deploy home equity is highly dependent on a retiree’s financial circumstances, preferences for housing, and willingness to incur the costs of a reverse mortgage.

Pre-retirees and retirees need help

The analyses and insights presented in this article can help older workers make the five important retirement income decisions noted earlier. There are several other important decisions that don’t involve retirement income; they’re beyond the scope of this essay.

Ideally, pre-retirees would address these decisions as they transition into retirement. However, the decisions have high stakes for retirees’ financial security for the rest of their potentially long lives. And these issues are complex, making many of the decisions presented here beyond the skills of most pre-retirees and retirees. They’re going to need help.

Employers can help their older plan participants by offering retirement income options in their defined contribution plans, delivering communication materials about retirement income strategies, and offering part-time positions to older workers to enable them to downshift and delay starting Social Security benefits and drawing down retirement savings. Parts Two, Three, and Four in this series explore these ideas further.

Financial institutions and advisers can incorporate these analyses and insights into their products and services as well. Building financial security for long retirements is a serious challenge, and we all have roles that we can play to help.

Steve Vernon, FSA, is a Research Scholar, Stanford Center on Longevity, and co-author of the SOA-sponsored research report “Viability of the Spend Safely in Retirement Strategy,” which forms the foundation for the ideas in this series of essays. Vernon is also the author of a consumer-facing book based on this research: “Don’t Go Broke in Retirement: A Simple Plan to Build Lifetime Retirement Income.” He can be reached at [email protected].

A Look at Biden’s Social Security Plan

With the presidential election looming, the candidates’ views on Social Security and how to “fix it” are important to those who follow retirement policy. The president has made non-specific promises to maintain the program. Former vice president Joe Biden has specific proposals.

In a recent report, the Urban Institute, a progressive Washington think tank has reviewed the Biden plan. According to the report, an incoming Democratic administration would raise benefits for almost everybody and collect more taxes from those earning more than $400,000.

That is, someone with an income of $500,000 would pay $12,400 more in payroll taxes. Eighty-seven percent of the additional payroll taxes generated by Biden’s plan in 2065 would be paid by Americans in the top one percent of the income distribution, the report said. 

Surprisingly, the Biden plan doesn’t fully address the Social Security funding gap.“Our projections indicate that Biden’s plan would close about a quarter of Social Security’s 75-year deficit and extend the life of the trust funds by five years,” the report said. “Additional revenue sources would be needed in the future for Social Security to pay the full benefits scheduled under Biden’s plan.”

Overall, the Biden plan reflects the thinking of those, including the Social Security Administration’s own chief actuary and experts like Alicia Munnell of the Center for Retirement Research at Boston College, who have maintained for years that there’s no “crisis” in Social Security that would require radical change, such as partial privatization. 

Resistant to the neoliberal thinking that favors privatization—since the 1970s, some economists have argued that payroll taxes shrink private savings and investment—Social Security advocates have said that an increase in the payroll tax by a few percentage points or the level of income covered by it, plus a few tweaks to benefits, would enable the program to pay all promised benefits for the foreseeable future without violating existing funding rules.  

Here are the specifics of the Biden plan, according to the Urban Institute: 

  • Levy the current 12.4% payroll tax on earnings above $400,000 as well as on earnings up to $137,000 (in 2020). Income between $137,000 and $400,000 would not be taxed until, as a result of inflation-related increases, the FICA wage limit reaches $400,000. After that, all earnings up to $400,000 would be taxed. 
  • Replace Social Security’s existing minimum benefit, which is too low to help many beneficiaries, with a meaningful minimum benefit equal to 125% of the Federal Poverty Level for a single adult, or $15,950 annually in 2020.
  • Index the minimum benefit to the average national wage, which generally grows faster than inflation. Beneficiaries must have completed 30 years of covered employment to qualify for the full minimum, but beneficiaries with at least 10 years of covered employment could qualify for a prorated share of the minimum.
  • Enhance benefits by tying Social Security cost-of-living adjustments (COLAs) to changes in the consumer price index for the elderly (CPI-E) instead of changes in the Consumer Price Index for Urban Wage Earners and Clerical Workers (CPI-W).
  • Extend Social Security earnings credits to workers who care for children younger than age 12 and for family members with disabilities. For every month that caregivers provide at least 80 hours of care, Social Security would credit them with earnings equal to half the average national monthly wage in addition to their earnings from covered employment that month. The plan would reduce a caregiver’s credit by 50 cents for every $1 he or she earns up to the average wage, which was $50,322 in 2017.   
  • Allow widows and widowers of Social Security recipients, if they wish, to collect 75% of the total benefit received by the household before their deceased spouse died, as long as the new payment isn’t higher than the benefit that a two-earner couple with average career earnings would receive. Under current law, benefits may drop by as much as 50% when one spouse in a two-earner couple dies. 
  • Provide a bonus equal to 5% of the average benefit to beneficiaries who had collected payments for 20 years; the bonus would phase in, beginning with a 1% boost for beneficiaries who had collected for 16 years.
  • Repeal Social Security’s Windfall Elimination Provision and Government Pension Offset, which reduces Social Security benefits for workers receiving significant government pensions from jobs not covered by Social Security and their spouses and survivors.
  • Increase 2065 median annual Social Security benefits 14%, to $20,700 (in 2018 inflation-adjusted dollars)
  • Boost median benefits 27% for beneficiaries in the bottom fifth of the lifetime earnings distribution compared with only 14% for beneficiaries in the top three-fifths of the lifetime earnings distribution. Higher earners would nonetheless see the largest absolute dollar increases in their benefits.

How would these proposal affect Social Security’s finances? According to Urban Institute calculations:

  • By 2040, Social Security would collect 7% more revenue in 2021, 12% more revenue in 2040, and 16% more in 2065.
  • Biden’s plan would increase total projected federal and state income and payroll tax collections 2.4% in 2065
  • Total income and payroll taxes collected from taxpayers with incomes between $500,000 and $1 million (in 2018 inflation-adjusted dollars) would increase 4.1%.
  • Benefits scheduled under Biden’s plan would increase Social Security’s spending to 18.7% of taxable payroll in 2065, or nine percent more than scheduled under current law.

President Trump has announced no specific Social Security plan. According to the Urban institute, in an August 2020 news conference, he suggested eliminating the Social Security payroll tax and financing benefits through transfers from the federal government’s general fund. Trump did not specify how the federal government would pay for those transfers, especially given the government’s expected $3 trillion deficit this year. 

(c) 2020 RIJ Publishing LLC. All rights reserved.

Pace of portfolio construction outsourcing will slow: Cerulli

As advisors seek to re-assert control over client portfolios in times of market volatility, the growing trend of advisors outsourcing portfolio construction is likely to slow in the short term, according to the latest Cerulli Edge—U.S. Advisor Edition

Many advisors outsource portfolio construction to scale their businesses. During the past five years, the percentage of “in-sourcers” (advisors who either construct an individual portfolio for each client or construct models at their practice and then make changes on a client-by-client basis), has fallen by an estimated seven percent.

In some channels, such as national and regional broker/dealers (B/Ds) and independent registered investment advisors (RIAs), the percentage of in-sourcers has fallen by 20% and 18%, respectively. “Outsourcing can deliver better, more consistent investment outcomes for clients of these practices,” said Matt Belnap, senior analyst at Cerulli, in a release.

But the pandemic may interrupt the shift toward outsourcing. According to Cerulli research, nearly two-thirds (62%) of respondents indicate no meaningful change in advisor discretion post-pandemic, while a significant minority (29%) report that advisors are seeking greater discretion over client accounts. Only 9% indicate that advisors were more willing to outsource a few months into the pandemic.

In times of market uncertainty, advisors seek to retain control of investment decisions. “It’s easier for the advisor to make portfolio changes, and show the client that they are doing something, than to explain why the home office or model provider is taking a ‘wait and see’ approach and that the advisor has limited ability to alter the portfolio in times of crisis,” Belnap said.

Over the long term, however, Cerulli expects outsourcing to continue, and that advisors and clients can benefit from this trend. “Constructing practice-level portfolios, or a personalized portfolio for each client, takes massive amounts of time for activities such as investment research and manager due diligence. Advisors who can move beyond portfolio construction and security selection as their main value proposition can use this time to grow and scale their practice, more efficiently servicing clients they already have, and attracting new ones,” the release said.

Product decisions will increasingly be made outside of the practice, Cerulli believes. According to the release, “In light of this trend, firms should allocate their resources and distribution focus accordingly.” 

(c) 2020 RIJ Publishing LLC. All rights reserved.

Job loss has cost millions their health insurance: EBRI

As many as 7.7 million workers lost jobs with employer-sponsored insurance (ESI) during the COVID-19 pandemic, according to a new study from the Employee Benefit Research Institute (EBRI). An additional 6.9 million dependents lost insurance benefits as well. Manufacturing workers were most affected by loss of jobs with ESI.

The study, How Many Americans Have Lost Jobs with Employer Health Coverage During the Pandemic?,” was sponsored by The W.E. Upjohn Institute for Employment Research, and The Commonwealth Fund.

In response to the COVID-19 pandemic, most states imposed lockdown orders that closed many workplaces and dramatically slowed U.S. economic activity in the spring of 2020. The result was a massive increase in unemployment, which peaked in April at 14.7%. During the 15 weeks from mid-March to the end of June, Americans filed nearly 49 million new claims for unemployment benefits.

“The strong link between employment and health insurance coverage has important implications for Americans’ insurance coverage and access to health care, as ESI is the most common form of health insurance in the United States,” EBRI said in a release. “The manufacturing sector is disproportionately impacted because more of those jobs come with ESI, compared with retail, or accommodation and food service workers.”

“Workers ages 35 to 44 and 45 to 54 bore the brunt of ESI-covered job losses, in large part because workers in these age groups were the most likely to be covering spouses and other dependents,” said Paul Fronstin, Director of EBRI’s Health Research and Education Program, in a release. “The adverse effects of the pandemic recession also fell disproportionately on women. Although women made up 47% of pre-pandemic employment, they accounted for 55% of total job losses.”

(c) 2020 RIJ Publishing LLC. All rights reserved.

Jim Otar’s Swan Song on Retirement Income

Jim Otar, the Ontario-based adviser-emeritus and author, has turned his attention in retirement to writing rom-com screenplays. But he has just self-published his career capstone, “Advanced Retirement Income Planning.” It’s available for $4.99 on Amazon in a Kindle edition.

I first encountered Otar via his homepage, retirementoptimizer.com, more than 10 years ago. Here was a math-minded Canadian engineer who, dissatisfied with the existing literature on retirement planning, decided to create his own—and has become modestly famous for it within this niche.

This excerpt from one of his webpages describes his journey in his own words:

Jim and Rita Otar

“I started investing in 1977. I wrote my first book (‘Commission-Free Investing’) in 1996 about Canadian DRIPs and SPPs, to share my personal strategies and experiences about this form of low-cost investing (before the invention of ETFs). I also started writing articles regularly for a local personal financial planning magazine called Canadian MoneySaver and met many great people at their onshore and offshore conferences.

In 1999, my wife asked me a very simple question: “Do we have enough money for retirement?” I replied, “Let me check.” Nothing happened for a few weeks. That is because I could not find much about mathematics of retirement. Most experts then were recommending investing all in stocks. All have been touting the ‘miracle’ of asset allocation. So, when she asked me a second time if we have enough savings for retirement, I realized that I had to come up with an answer.

Otar soon found a career as adviser to clients and even to his peers. He has given hundreds of workshops and presentations to advisers on income planning. He has published more than 100 articles and several books, including his 525-page magnum opus, Unveiling the Retirement Myth.” He won the CFP Board Award in 2001 and 2002 for his articles. He contributed a chapter to Harold Evensky and Deena Katz’ indispensable 2006 book, “Retirement Income Redesigned.”

We first featured Otar’s work in Retirement Income Journal in 2009. We wrote at the time that he was born

“near Istanbul, Turkey, the son of an accountant who raised a few sheep, fruit trees and vegetables. In the forward to his new book he describes his first experiment with finance: growing cabbage as a cash crop. An early frost wiped out his entire investment in seedlings and manure.

He immigrated to Canada at 20, and earned undergraduate and graduate degrees in mechanical engineering at the University of Toronto. “In 1982, I went into a marine equipment business, and worked in it until 1994, when I went into the financial business. I started looking after my own investments. Then my friends and family wanted advice. I ended up getting my CFP in 2000.

“I also used to do technical analysis, and got my most recent designation, Chartered Market Technician. I did ‘cross over.’ I did ‘bottom out.’ We just followed the signals. Every technician has different signals.”

Of Otar’s contributions to the art and science of income planning, I have to say that his “zone theory” is my favorite. He segments clients into one of three categories: Green, Gray (or Yellow) and Red.

Green clients are overfunded for retirement, red clients are underfunded, and those in the middle need to get creative—by working longer, cutting expenses or buying life annuities—or they may run out of savings too soon. Even wealthy retirees can squander their way into the Red zone, Otar observed, and even people with modest savings can figure out how to migrate up to the Green zone. It depends in part on their expenses, which he divides into essential, basic and discretionary.

More importantly perhaps, Otar developed the idea that he calls “aftcasting.” This was his alternative to more conventional methods of back-testing or stress-testing hypothetical investment portfolios and withdrawal rate assumptions against the markets’ historical performance.

“An aftcast uses the actual market history to show what would have happened in the past without any predictive claim for the future,” he writes in the new book. “An aftcast starts its calculation by picking a specific year in history, say 1900, at the current age of the client. Using the actual historical returns, it calculates the portfolio value over time. Once this is done, the calculation moves on to 1901 as the starting year. It repeats these calculations for all available years in its historic data base.”

This technique reflects the impact that actual sequences of events—phases of the business cycle, changes in securities prices and inflation—would have had on the performance of a portfolio, based on the year the portfolio was created in. It captures the feedback effects and correlations that created the environments that determined past portfolio performance.

At less than 100 pages, “Advanced Retirement Income Planning is a concise version of “Unveiling the Retirement Myth.” It contains all of Otar’s most important insights regarding such matters as the impact of luck, sequence-of-returns risk, and the signals that markets give when they are about to change direction. (He still can’t resist technical analysis.) I’ll stop the spoilers here and let you discover “Advanced Retirement Income Planning” for yourself. Otar’s books and articles are essential for any adviser who wants to improve his or her retirement income planning skills—and might even be useful for the ambitious amateur.

© 2020 RIJ Publishing LLC. All rights reserved.
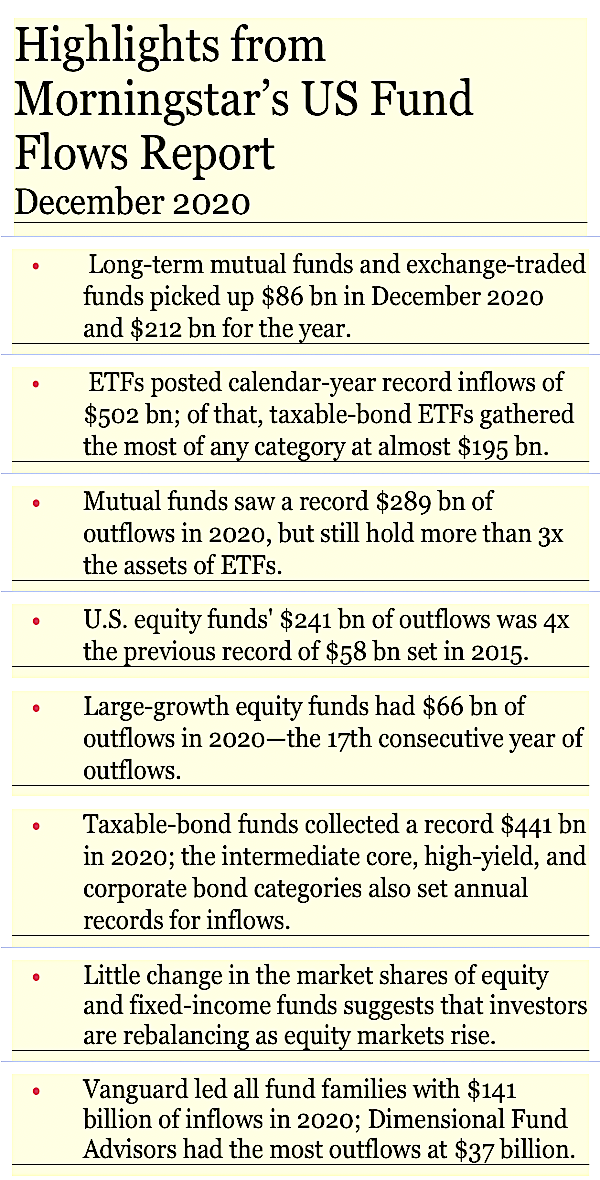
The top 1%’s share of U.S income (and more)

The “top 1%” receive 18% of U.S. income: CBO

There’s been a lot written in recent years about economic inequality—about the disproportionate neo-Gilded Age wealth of the “top 1%” as well as the top-heavy tax burden and the bottom-heavy government means-tested transfer payments to the poor.

This month, the Congressional Budget Office (CBO) offered a report, “The Distribution of Household Income, 2017,” based on the most recent complete data from tax returns. It showed changes in the division of income among Americans and in sources of income over the 39 years from 1979 to 2017.

The roughly 128 million households (~315 million people) in the United States received about $14.1 trillion in annual income in 2017, the CBO reported. (“Income” was defined as household income before means-tested transfers and federal taxes.) The highest-earning Americans derived their incomes primarily from business income or capital gains over that period, while the lowest-earning Americans benefited from rising transfer payments through Medicaid, SNAP and other means-tested programs.

The wealth is concentrated in the top quintile (20%), which received almost 50% of all the annual income in the U.S. The bottom half of the top quintile (the 81st to 90th percentiles) had an average income of about $165,600, or about $4.2 trillion or 30% of the total.

The average income among the 1.28 million households in the top 1% of the distribution was about $2.0 million for a total of $2.6 trillion or about 18% of all pre-tax, pre-transfer income. The average income among the approximately 11,000 households in the top 0.01 percent of the distribution was about $48.5 million.

Incomes within the top 1% varied widely: Average income before transfers and taxes among the approximately 11,000 households in the top 0.01% was $48.5 million in 2017, compared with $5.7 million among households in the 99.9th to 99.99th percentiles and $1.1 million among those in the 99th to 99.9th percentiles.

Business income and capital income (including capital gains) were, on average, a much larger percentage of income for the top 1% of the distribution than in lower income groups. Among households in the top 0.01%, capital income was an average of 66% of income before transfers and taxes in 2017.

Total billionaire wealth reached $10.2 trillion at the end of July 2020, touching a new high after the year’s V-shaped rebound in asset prices, according to a separate report by UBS and PwC (Price Waterhouse Cooper). This level surpasses the previous peak of $8.9 trillion, reached at the end of 2017. There are now 2,189 billionaires, up from 2,158 in 2017. (The report didn’t provide total world wealth, or the percentage of it represented by billionaire wealth.)

Among the poorest 25 million households, labor accounted for about 60% of all income before transfers and taxes in the quintile. With the top 20% taking home 50% of all income, the bottom 80% of American households shared the remaining 50% (about $7 trillion or $70,000 each on average).

In 2017, the average federal tax rate also varied widely by income group. Among all households it was about 21%, CBO estimates. Among households in the lowest quintile, the average rate was about 1%; in the middle quintile it was about 14%; and in the highest quintile it was about 26%. The average federal tax rate among households in the top 1 percent of the income distribution in 2017 was about 32%.

Of the five components of income before transfers and taxes, business income expanded fastest, growing more than sevenfold over the 39-year period, the report said. As a share of income among households in the top 1%, business income rose from 11% in 1979 to 23% in 2017. Meanwhile, average capital income (including capital gains) grew at a slower pace than other forms of income.

The most neglected retirement income solution

With mortgage rates extremely low and millions of under-saved retirees holding trillions of dollars in home equity, the U.S. market for “reverse mortgages” (or as the British say, “equity release” products) should be much more active than it is. A new research paper, “The Market for Reverse Mortgages among Older Americans,” by Christopher Mayer of Columbia and Stephanie Moulton of Ohio State University tries to solve this puzzle.

The two economists discovered that many retirees are in fact tapping their home equity in retirement. But they’re doing it much more often through refinancing and home equity lines of credit than by purchasing a reverse mortgage (aka Home Equity Conversion Mortgage, or HECM).

“Many seniors do, in fact utilize home equity in order to fund their retirement,” Mayer and Moulton write. “Yet they choose products that require monthly payments lasting decades into retirement and rising as a share of (declining) income as they age.”

In 2018, only 33,000 originated reverse mortgages were recorded, versus 609,000 originated equity extraction loans such as HELOCs (home equity lines of credit), cash-out refinancing, first liens not for refinance or purchase, and second liens. Another 688,000 older Americans originated a mortgage for home purchase or a refinancing. In many cases, people who were turned down for these loans could have qualified for HECMs.

The authors looked into reasons for the underutilitization of reverse mortgages and found four potential reasons: higher costs, bequest motives, product reputation, and regulatory barriers. The last two reasons, they write, play a role “in discouraging the participation of mainstream financial institutions which might be able to bring distribution efficiencies, lower costs, and retirement advice that incorporates home equity into financial plans.”

The high cost of money-back guarantees for IRAs in Germany

As defined benefit pensions disappear, experiments with creating individualized retirement income solutions are taking place all over the world. The results can provide potential solutions (or cautionary tales) for retirement policymakers in the U.S.

So it is with the German Reister plans, which are individual retirements accounts (IRAs) with tax benefits and accumulation guarantees. If, at retirement, the account value is lower than the sum of payments into the IRA, the provider—usually an insurance company—must cover the shortfall with its own equity capital.

Olivia Mitchell, director of the Pension Research Council at the Wharton School, and her German co-authors, Raimond Maurer, Vanya Horner and Daniel Liebler of Goethe University, studied Reister plans. In a recent paper, “Implications of Money-Back Guarantees for Individual Retirement Accounts: Protection Then and Now,”they write:

“these guarantees altered participant consumption, saving, and investment behavior during higher interest rate times, but their impacts are even larger in the present low-return environment.

“Importantly, we conclude that abandoning these guarantees could enhance old-age consumption for over 80% of retirees, particularly lower earners, without harming consumption during the accumulation phase.”

In 2018, 45 million German employees were entitled to contribute to tax-qualified Riester IRAs in 2018 and 16.6 million people did so. The German government pays a yearly subsidy of up to €175 plus €300 per child younger than age 25 into each worker’s IRA. To qualify for the full subsidy, the sum of employee contributions plus subsidies must equal 4% of pre-tax labor income (to a cap of €2,100).

During the decumulation phase, payouts can start at age 62, not more than 30% of accumulated assets may be withdrawn as a lump sum, and any remaining assets must be annuitized by age 85. IRA providers devote a share of savers’ IRA balances at age 67 to buy a deferred annuity paying benefits to the retiree from age 85 until death.

“Swap lines” and global financial stability

Economic history buffs, take notice. A new paper by one of America’s premier economic historians and macroeconomists, Michael Bordo of Rutgers University, explains the method (and history) behind the madness (a miracle, in a way) of the Federal Reserve’s monetary response to the financial crisis triggered by COVID-19 starting last March.

After a historical review that extends back to the classical pre-World War One gold standard, and proceeds through the collapse of the famous Bretton Wood monetary system in 1971, Bordo concludes that the Fed rescued the global economy this year in part with a safety net of “swap lines” with other countries’ central banks.

A “swap line” in this case refers to an arrangement whereby a foreign country that needs dollars—to pay for oil imports, for instance, or to service dollar-denominated debt—can trade its own currency for dollars from the Federal Reserve. The Fed accepts foreign currency as collateral for short-term loans of dollars during financial crises, when everybody is competing for dollars and dollar-denominated assets.

“In the face of a global financial crisis as in 2007-2008 and 2020, central banks have learned to effectively cooperate to prevent a liquidity panic using the swap network to pursue the well-known tenets of Bagehot’s rules,” Bordo writes. [A reference to Walter Bagehot, the British journalist who in 1873 wrote Lombard Street, the classic analysis of central banking.]

“The international swap network can be viewed as a step in the direction of a global financial safety net,” he says, “Whether it is possible to return to the world before the Great Financial Crisis of small central bank balance sheets, normalized interest rates and the policy rate as the instrument is an open question.”

© 2020 RIJ Publishing LLC. All rights reserved.