Archives: Articles

IssueM Articles

How Equitable Invented the Structured Annuity

In 2008, the Great Financial Crisis hit Equitable (then AXA Equitable) hard. It had been a big competitor in the pre-crisis variable annuity “arms race,” where life insurers outdid each other with generous deferral bonuses on guaranteed lifetime withdrawal benefit riders.

When the stock market crashed and interest rates dropped, the assets that supported those guarantees lost value. Some VA issuers had to pony up lots of fresh capital. Equitable’s French parent (much like ING-USA’s Dutch parent) wanted to reduce its exposure to VAs.

So Equitable developed new products (while also offering to buy back some of its most costly VA contracts). The first new contract was its Retirement Cornerstone Series of VAs. The Cornerstone product had two investment sleeves, one risky and the other not. The value of the non-risky sleeve supported the income rider, and the client decided how to allocate between the two sleeves.

Then, though Equitable wasn’t a manufacturer of fixed indexed annuities, and its AllianceBernstein sibling didn’t create structured notes, Equitable’s in-house Innovation Hub, established after the financial crisis, invented the indexed variable annuity. Basically a structured note in an annuity wrapper, it used options to define the contract owner’s upside potential and level of downside protection. Though the contract owner would have the ability to convert the IVA value to a lifetime annuity if so desired, the product was intended mainly for accumulation.

Thus was Structured Capital Strategies (SCS) born. Thriving through the teen years of the 21st century, this product sparked what today is a healthy and growing $20 billion-a-year business. SCS has led this market in sales every year ($1.227 billion in the first quarter of 2020).

Equitable recently added a new feature to the SCS product suite, called Dual Direction. If the S&P 500 Index has lost up to 10% by the end of a five-year term, the client receives the equivalent percentage, up to and including 10%. If the market grows, the client can experience up to 100% of the upside gain over the five-year period.

Recently, RIJ spoke with Robin M. Raju, head of individual retirement at Equitable. When we asked Raju for the SCS “genesis” story, here’s what he told us:

Robin M. Raju

“Coming out of the [2008] crisis, it was clear that the variable annuity with living benefits was not economically sustainable. We wanted to get out of competing to offer the highest guaranteed roll-up rates. That’s when we switched to our Cornerstone product, which lent itself to a rising interest rate environment. We also did what we always do: We went out and started talking to our clients.

“We’re fortunate to have access to a force of 5,000 affiliated advisers. This was back in 2008 or 2009. Everyone was holding cash on the sidelines. We asked people, what type of product would you like to see in terms protecting retirement income. We also asked, what has changed for you? What are the needs of clients now? We found that people still wanted exposure to the equity markets. They also wanted some downside protection.

“Then we consulted with our internal think tank, the Innovation Hub. We have a good derivatives team, so we brought the problem to the team, and asked, Can this be solved with options in the financial markets? They said it could.

“What the client’s money earns in the general account—that money would fund part of the upside. With the Dual Direction enhancement that we introduced this year, we buy a call and a put at-the-money [i.e., options to buy or sell at the current price]. We also sell an out-of-the-money put to reintroduce the downside exposure beyond -10% (i.e., create the buffer), and buy and sell an out-of-the-money call to set the upside cap and finance the structure.

“Today, in our S&P 500 Index version, we can provide protection as far down as -10%, and still give the client 100% of the upside. [See today’s lead story for a description of the options strategy for more conventional IVAs.]

“Working with our affiliated advisors, we were able to sharpen the marketing story. It had to be simple, and not about all the bells and whistles of the product. So when we went to third-party distributors, we had a good story, and it was not about rates. It was about protection.

“This is a great product for these times, which are a lot like 2009-2010. There’s so much money sitting in cash, and this is better than cash. But it takes time to educate, to achieve growth, and to drive more growth. Two-thirds of our current sales probably come from third-party distributors, and about one-third from our affiliated force. We love the competition from other life insurers because it increases the overall size of the pie.

“To make this more transparent to the client, we created an app. It’s a simple app that advisers can use with clients or clients can use on their own. We update the cap rates every two weeks [on new contracts], and that reflects the market conditions. If volatility goes up, it produces higher upside participation. We’ve seen periods of high and low volatility since 2010, and the value proposition has held up well. The client benefit is always there.”

© 2020 RIJ Publishing LLC. All rights reserved.

Demand for income-generating products is underestimated: CANNEX

A survey conducted in mid-February captured the level of surprise among advisers and clients at the sharp economic downturn this spring. Only 6% of advisers and only 11% of client thought a downturn was very likely, according to the sixth annual Guaranteed Lifetime Income Survey (GLIS), published this week.

The GLIS studies, produced by Greenwald & Associates and CANNEX, have consistently shown that guaranteed lifetime income products become more attractive during market downturns and volatility. This year’s survey showed that 71% of clients said a guaranteed lifetime income product was a highly valuable addition to Social Security, up from 67% a year ago.

A summary of this year’s survey results can be found here.

“COVID-19 has upended lives, the economy, and financial markets in ways that are likely to drive demand for guaranteed lifetime income in retirement,” said Tamiko Toland, head of Annuity Research at CANNEX, a provider of annuity data and analytics.

The surveys have also shown that advisers consistently underestimate their clients’ interest in guaranteed lifetime income products, such as annuities. Only 14% of advisors believe their average client is “highly interested” in guaranteed lifetime income (GLI), but 42% of consumers say they are highly interested or already own a GLI product, according to the survey.

About three in five clients said advisors should include guaranteed lifetime income products in a retirement income strategy, the survey showed. Eight in ten believe advisors should present two or three options for producing income in retirement.

Regarding the SECURE Act, which was intended to encourage 401(k) plan advisers to offer annuities to their participants, three in ten advisors said they expected the availability of annuities in 401(k) plans to increase the amount of annuities they sell and 35% said it will make clients more receptive to annuities.

Estimates of monthly retirement income in employer sponsored retirement plans, mandated by the SECURE Act, are more helpful for retirement planning than savings goals or estimates of retirement expenses, consumers and advisers believe, according to the survey.

The GLIS covered 1,000 Americans ages 55 to 75 with $100,000 in investable assets or more, and 302 financial advisors with at least $15 million in assets under management.

The survey was conducted in mid-February, a month before the COVID-19 market crash.

Among clients, 11% considered a market downturn very or extremely likely in 2020 and 29% considered a downturn at least somewhat likely. A third (35%) of surveyed clients considered a downturn very or extremely likely within 5 years.

© 2020 RIJ Publishing LLC. All rights reserved.

These Hedges (Probably) Won’t Clip You

A 53-year-old actuary decided four years ago to buy a indexed variable annuity, or IVA. He wasn’t old enough yet for the “retirement red zone,” when a badly timed loss can be hard to recover from. He wanted higher yields, but was afraid to go longer into stocks.

After doing a small mountain of due diligence, he decided to move $50,000 from certificates of deposit into an AXA Equitable (now Equitable) Structured Capital Strategies IVA.

“My money was in savings or CDs, earning between 1% and 2.5%, and I wanted to earn more without too much risk,” he told RIJ recently. “So on June 15, 2016, I took $50,000 and bought a contract with a five-year ‘lock'” or term.

At the time, the S&P500 Index was between 2,000 and 2,100. The Russell 2000 Index was about 1,150. Within the contract, he put $12,500 each into these four crediting strategies:

  • -10% buffer, S&P 500 Index, 86% cap
  • -10% buffer, Russell 2000 Index, 67% cap
  • -20% buffer, S&P 500 Index, 38% cap
  • -20% buffer, Russell 2000 Index, 39% cap

To translate: If the S&P 500 Index rises over the next five years, he receives all of the gain up to 38% or 86% (depending on the buffer). If the Russell 2000 has a net gain, he receives up to 39% or 67%. If the index is down after five years, he loses nothing unless it has fallen more than 10% (or 20%, with the bigger buffer). Note that the larger caps come with smaller buffers.

For example, if the S&P 500 Index were up by 50% after five years, his investment earns 50% with the -10% buffer and 38% with the -20% buffer. If either of the indexes were down 25% after five years, his actual loss would be either 15% or 5%, depending on whether the -10% or -20% buffer applied.

“As long as the markets didn’t have a bad five-year run,” he said, “I knew I wasn’t going to lose any money.” Before we tell you exactly how he’s fared so far, here’s some background.

A member of the IVA target market, from a photo in an Equitable brochure.

How IVAs get priced

Indexed variable annuities, as a product category, have existed for only about 10 years. Only 11 life insurers in the U.S. manufacture them. Five carriers—Equitable, Brighthouse Financial, Allianz Life, Lincoln Financial, and CUNA Mutual—account for about 95% of annual sales. Sales topped $13 billion in 2018 and $17 billion in 2019. LIMRA SRI expects sales of $20 billion in 2020. The products are typically sold by commission-earning, securities-licensed advisers at independent broker-dealers and banks.

A kind of Goldilocks product for our perplexing, Fed-dominated times, IVAs are nonetheless complicated. Few people know much about options, and IVAs involve combinations of options on equity indexes or ETFs (exchange-traded funds). And while most advisers have a seat-of-the-pants sense that equity and bond returns will fluctuate around their long-term averages, they have no feel for the direction of IVA returns. Will these geese lay golden eggs or rotten ones?

Let’s walk through one of the purchases made by the actuary mentioned above. He assigned 25% of his $50,000 pool of money to a crediting method where he would receive all of the S&P 500 Index gains over five years up to a cumulative gain of 86%, or (if the index dropped over five years) would absorb any net loss beyond the first 10%.

‘Call spreads’ set the caps

How are the caps and buffers of these crediting methods achieved? By the life insurer’s purchase of a package of options from an investment bank. The IVA packages are priced according to current interest rates, volatility levels of the chosen index (according to the VIX Index), as well as the length of the term and the depth of the buffer that the client chooses. The prices of the options fluctuate over time, and caps on new business are adjusted as often as every two weeks.

Different combinations of options are possible, but here’s a common one:

  • To set the buffer, the insurer sells an out-of-the money put. A “put” is the right to sell at a certain “strike price.” “Out of the money” means the strike price is below the current index level. If the strike price is 10% below the current price, the client is exposed to net losses beyond that.
  • To set the cap, the insurer buys a call spread. He sells an out-of-the-money call (the right to buy the index at a strike price higher than current market price) and simultaneously buys an at-the-money call (the right to buy the index at today’s price). The strike price of the out-of-the-money call will be the cap on gains.

Here’s how Tim Hill, an actuary at Milliman, described the buffer:

“Suppose the index is down 5%. The 10% out-of-the-money (OTM) put I sold expires with no value,” he told RIJ. “I don’t have to pay anything and I take nothing from the customer account value. Suppose the index is down 15%. The 10% OTM put expires with a value of 5% (15% – 10%), so I take 5% from the customer’s account value. Suppose the index is down 25%. The 10% OTM put expires with a value of 15% (25% – 10%), so I take 15% from the customer’s account value.”

The insurer buys these options with its “hedge budget.” Where does this money come from? Part of it comes from the income generated by the client’s premium in the insurer’s general fund, minus the insurer’s expenses and profit. Part comes from selling the above-mentioned out-of-the-money put and out-of-the-money call. Those transactions generate revenue because the client is selling part of his downside protection (provided by the underlying bond investments in the insurer’s general account) and part of his upside potential (provided by the at-the-money call).

“We sell an out-of-the-money put in response to the customer’s choice of buffer and get cash up front for that,” Stephen Turer of Lincoln Financial told RIJ. “We take that cash and our investment yield and together, that’s the gross option budget. Then we buy the at-the-money call to set the cap.”

The hedge budget and the options prices are affected by many factors, including the insurer’s expenses, the sales commissions paid to advisers at broker-dealers or banks, its profit requirements, its sales appetite at any particular moment, as well as the level of market volatility and prevailing interest rates.

“We’ve heard from the investment banks, anecdotally, that options prices are a little smaller for structured products, especially when volatility is high. That can allow for fairly generous caps because the market is already pricing-in the volatility,” said a product manager at an insurance company who spoke on condition of anonymity.

IVAs are said to be well suited to the present environment, where volatility levels are high—which drives up the revenue from selling the put—and market interest rates are low—which reduces the yield of competing bonds, CDs or fixed annuities.

“This product works well in this environment of low rates and high volatility,” Lincoln’s Turer said. “A put option gets more valuable [for the seller] when rates go down, and a call gets a little more expensive [for the buyer]. When rates go down, it usually means that expected growth goes down, so the call option gets cheaper and downside protection gets more expensive.

“So the customer gets great value by sharing the downside risk,” he added. “That’s the cool part of it. The customers are sharing the risk, but on their own terms [by picking the level of exposure]. The IVA looks better right now than a fixed indexed annuity. It’s better than some of the other places you could put your money. It’s a great story.”

Our actuary’s experience

Last December 7, a Wall Street Journal columnist wrote warily (and slightly misleadingly) about IVAs. He focused on the buffer concept, and found its protections against loss too skimpy and unclear to the investor. (He didn’t specify that IVAs are not equity investments; they are, as described above, bond investments spiced with options on the performance of equity indexes.)

IVA owners can lose money, of course. Suppose someone’s crediting term ended on March 23, 2020, when the S&P 500 closed about a third below its mid-February peak. That investor would have locked in a 13% or 23% loss, depending on whether he had a -10% or a -20% buffer. The buffer would have prevented him from bearing the entire loss; but the contract may have prevented him from participating in the V-shaped rebound that has since followed.

The actuary mentioned at the beginning of this story, who works for a life insurance company (but not one that writes an IVA) seems pleased so far with his gamble on an IVA.

On the day we spoke, the S&P 500 Index was at 3,194 and the Russell 2000 was at 1,507. They were up 55% and 31% in the four years since he bought them as an alternative to CDs. “If the price stays at this level for the next year it means I made much more than if I were still sitting in savings,” he told RIJ.

“I’m getting the full upside on three out of four of my crediting strategies,” he said. Only his S&P 500 Index strategy with a -20% buffer has failed to deliver the entire index return; he gets 38% instead of 55%. “Buyers should also beware of this: I’m getting only 38% and 86% of the S&P 500 Index without dividends. Over the past 30 years, according to my calculations, the index without dividends has returned about 75% of the total return, with dividends.

“I think I understood exactly what I was buying,” he added, noting that no one should buy this type of product without understanding it. “If it turns out that I misunderstood what I was buying, I’ll be writing to you in a year—and totally blasting the salespeople by name.”

© 2020 RIJ Publishing LLC. All rights reserved.


Is Employer-Sponsorship of Plans Suboptimal?

Olivia Mitchell, a professor at the Wharton School and executive director of Wharton’s Pension Research Council, knows a lot about retirement systems. If she doesn’t know something, she can call any of the defined contribution or defined benefit experts she knows, from Philadelphia to Frankfurt and Singapore to Sydney.

In a recent article, “Building Better Retirement Systems in the Wake of the Global Pandemic,” she suggests that we need to rethink the idea of having employers sponsor retirement plans—and forcing them to deal with all the associated regulations and financial ramifications.

“Tying workers’ pensions (and in some countries, health insurance) to an employment relationship is quite risky when firms go out of business and worker mobility results,” she writes. “Therefore, in the wake of the pandemic, retirement and health insurance coverage are likely to be delinked from employer-provided plans in many countries, instead of continuing what was once termed ‘industrial feudalism’ under which workers were discouraged from leaving their firms for fear of losing their benefits.”

Olivia Mitchell

In an interview this week, we asked Mitchell what a non-employer plan might look like? “A multiple employer system could be one model,” she told RIJ, “but it would only allow portability for employees across firms in each system. A state-run system could be of interest, but only insofar as employees remain employed in that state.”

In her paper, she mentions tontines, as well as Singapore’s mandatory deferred income annuity, and shares the policy recommendations that she and other pension experts have made:

  • Generate and make available better data about mortality and morbidity patterns. These could help insurers price longevity risk around the world.
  • Develop guidelines for measuring and forecasting social security and pension assets and liabilities, as well as the assessment of long term care needs for the aging population.
  • Encourage delayed retirement, “delicately where possible.” One study has shown that older people might claim their social security benefits later and work longer if they could receive a partial lump sum when they finally claimed, in exchange for the deferral.
  • Create a centralized database that helps mobile workers track their pension accounts as they move across employers.
  • Improve the “gig economy,” since it gives older people flexible, part-time, and on-demand work opportunities. Though pension, health, and other employee benefits have traditionally not been provided to gig workers, that situation has begun to change.

Asked which of the systems she admires most, of those she’s seen around the world, she said, “As to which is the best: that’s a hard call. Each country has a different first pillar social security, tax, and social insurance system, so the pension platforms and designs in each must be integrated with these institutions as well. So what works in Australia might not work in the US, without some major redesign.”

It turns out that her type of defined contribution plan is the one she participates in.

“My favorite U.S. platform is the national educational retirement system that covers many of us in higher education,” she said. “Typically employees have a choice of a handful of money managers who are vetted/selected by the fiduciaries of each employer, but the pension accounts are fully portable across all university/research/medical system affiliates, with a national purview.

“TIAA/CREF was the first mover here, followed by many other fund managers across the land. The participating employers’ payroll systems are usually the conduits for the contributions to the custodian who allocates the funds to the requisite accounts,” Mitchell added. “It allows for national labor mobility, flexibility over contributions, and the potential for annuitization.”

© 2020 RIJ Publishing LLC. All rights reserved.

Honorable Mention

Hear the ‘Stones on iHeartRadio, courtesy of Alliance for Lifetime Income

As the sole sponsor of the 2020 Rolling Stones “No Filter” tour, which was postponed due to COVID-19, the Alliance for Lifetime Income, which educates the public about annuities, has created an alternate way to experience the Stones.

Fans can listen to Rolling Stones music via the “iHeartRadio Stones No Filter Radio Tour.”

The six-city on-air tour on iHeartRadio’s Rock and Classic Rock stations will showcase an hour-long special of Rolling Stones music hits, interviews with the band, live recordings from past concerts, and an interview with the Rolling Stones tour production director, Dale “Opie” Skjerseth.

The events will be broadcast on local stations in Charlotte, Dallas, Detroit, Minneapolis, Pittsburgh and St. Louis, as well live-streamed on www.iheart.com and the iHeartRadio app. The series will be aired live on Friday nights from 9:00-10:00PM local time for six consecutive weeks, starting June 26. All six cities were part of the original 2020 “No Filter” U.S. tour, planned for May 8–July 9.

The stations hosting the radio concerts are as follows:

  • June 26 – St. Louis – KLOU 103.3
  • July 3 – Detroit – WLLZ 106.7
  • July 10 – Minneapolis – KQQL 107.9 (KOOL 108)
  • July 17 – Charlotte – WRFX 99.7
  • July 24 – Dallas – KZPS 92.5
  • July 31 – Pittsburgh – WDVE 102.5

iHeartRadio is also committing financial support on behalf of the Alliance to Feeding America food banks in the six tour cities.

The Alliance is a non-profit consumer education organization. It raises awareness and educates Americans about the need for protected lifetime income to cover basic expenses in retirement.

2020 was the second consecutive year that the Alliance was the sole sponsor of the Rolling Stones U.S. tour. In 2019, the Alliance said it reached 1.5 million concertgoers and 24 million social media followers with its education efforts.

Higher reserve requirements hurt life/annuity companies in 1Q2020

The U.S. life/annuity (L/A) industry posted a $23.1 billion net income loss in the first quarter of 2020, driven mainly by a 51% increase in expenses over the same prior-year period.

These preliminary financial results are detailed in a new Best’s Special Report, titled, “First Look – Three Month 2020 Life/Annuity Financial Results,” and the data is derived from companies’ three-month 2020 interim period statutory statements that were received by June 2, representing an estimated 91% of total industry premiums and annuity considerations.

According to the report, the L/A industry saw a $23.7 billion increase in total income to $230.4 billion for the period. However, a $94.1 billion increase in total expenses, mainly due to a combined $57.3 billion year-over-year increase in aggregate reserves for life and accident and health contracts at Prudential, Brighthouse, Jackson National, AXA Equitable and Transamerica, negated the rise in total income.

The growth in expenses led to the L/A industry reporting a net pretax operating loss of $50.1 billion, its first since 2008. A tax benefit of $8.5 billion and a $22.0 billion increase in net realized capital gains reduced the impact, resulting in the total industry net loss of $23.1 billion. Despite the net loss, capital and surplus for the industry remained flat from the end of 2019 at $405.4 billion, aided by a $17.9 billion change in unrealized gains and a $6.9 billion increase in asset valuation reserve.

AIG adds factor-based global index to its indexed annuity contracts

AIG Life & Retirement, a division of American International Group, Inc., will begin offering the new AQR DynamiQ Allocation Index as a crediting strategy option in AIG’s Power Protector Series of Index Annuities, according to an AIG release this week.

The multi-style index has been designed by AQR Indices, LLC, a subsidiary of AQR Capital Management, LLC. It is the first AQR index built for use in an indexed annuity, the release said.

The AQR DynamiQ Allocation Index dynamically allocates across global equity and fixed income markets. The index uses AQR’s style-based (factor) methodology to identify assets for a variety of market environments.

The AQR DynamiQ Allocation Index is not available for direct investment, only to help determine the interest earned in the index annuity. Assets allocated to the index annuity are protected against market downturns, so consumers never lose principal or any interest earned due to market volatility.

AQR’s index methodology is based on research into styles, or factors, that drive an asset’s performance, the AIG release said. The AQR DynamiQ Allocation Index is designed to boost performance potential while managing downside risk by combining five styles:

  • Value (cheap assets)
  • Momentum (assets that show positive long-term performance)
  • Carry (higher-yielding fixed income assets)
  • Defensive (higher quality, lower risk equities)
  • Trend (assets that show positive short-term performance)

These styles are dynamically allocated across asset classes and geographic regions on a monthly basis based on a systematic, rules-based process that seeks to take advantage of changing market conditions, the release said.

The AQR DynamiQ Allocation Index is available exclusively in the Power Protector Series of Index Annuities, which is issued by American General Life Insurance Company and distributed primarily through independent marketing organizations.

TruChoice advisers get access to Envestnet Insurance Exchange

TruChoice Financial Group, LLC, a distributor of insurance products to investment advisors, registered representatives, and insurance agents, has arranged for its advisers to use the Envestnet Insurance Exchange, allowing them to hold annuities and insurance alongside managed accounts.

To implement the partnership, TruChoice will work with Fiduciary Exchange LLC (FIDx), the fintech that powers the Exchange. TruChoice advisers can now generate proposals, do research, open insurance policies, manage in-force transactions, and create client reports without leaving the Envestnet platform.

The Envestnet Insurance Exchange connects the brokerage, insurance, and advisory ecosystems, and provides management of annuity solutions from pre- to post-issuance. Investment advisors and registered representatives utilizing TruChoice can seamlessly plan, research, generate proposals, open policies, manage in-force transactions, and create client reports within the Envestnet platform.

Minneapolis-based TruChoice was established in early 2018 as an umbrella for its four founding firms—American Financial, Ann Arbor Annuity Exchange, GamePlan Financial Marketing, and The Annuity Store. These four organizations wholesale fixed-income annuities, life insurance, and long-term care insurance. In 2018, their advisers sold over $2.85 billion in fixed-income annuity business and $25 million in life insurance business.

The Envestnet Insurance Exchange supports a wide range of commission- and fee-based annuities from AIG Life & Retirement, Allianz Life, Brighthouse Financial, Global Atlantic Financial Group, Jackson National Life Insurance Co., Nationwide, Prudential Financial, and Transamerica.

Troubled muni bonds weigh on insurers: AM Best

Given the severe medium-term impacts on the municipal bond markets driven by the pandemic, according to a new AM Best special report.

The significant decline in revenue of states and cities during the COVID-19 pandemic likely will affect municipal bondholders, according to a recent Best’s Special Report, “Severe Test for the Municipal Bond Market.”

The report describes insurers’ muni exposures as “significant.” “U.S. insurance companies with more significant exposures, particularly revenue bonds for the more vulnerable sectors such as transportation and retail, are more likely to feel the negative market effects,” a release from A.M. Best said.

More than two-thirds of the municipal bonds held by insurers are from New York, New Jersey, Illinois, Massachusetts, California, and others hit hard the pandemic.

Of the three major insurance segments, property/casualty insurers have the greatest municipal bond exposure, although it has decreased by 20% since 2016, when the Tax Cuts and Jobs Act made the tax-exempt status of this asset class less advantageous.

Nevertheless, the segment’s exposures remain considerable, as municipal bonds constitute nearly 14% of the property/casualty segment’s invested assets, compared with 12% and 4.1% for the health and life/annuity segments, respectively.

The life/annuity segment’s municipal bond exposures represent 42% of their capital and surplus, exceeding that of other two segments. Companies rated by AM Best account for nearly 90% of the insurance industry’s municipal bond holdings.

Given their relative value and tax-exempt characteristics, municipal bonds will continue to play a role in an insurer’s strategic asset allocation. However, selecting appropriate exposures will be critical to insurers’ ability to manage through this tumultuous cycle. “The expertise and risk management practices of insurers and their investment managers will be tested,” said Jason Hopper, associate director, industry research and analytics. “Insurers that have a deep understanding of the municipal bond markets and well-defined risk thresholds based on solid credit risk fundamentals will perform better during and after the pandemic crisis.”

All asset classes have been affected by the pandemic, providing yet another illustration of rising correlations during times of stress. AM Best will continue to monitor the overall impact of deteriorating conditions on insurers’ ability to maintain adequate capital appropriate for their business and investment risks.

Owners of self-directed retirement accounts holding more cash: Schwab

The average account balance of self-directed brokerage accounts (SBDAs) held by retirement plan participants was $252,675 at the end of 1Q2020, down 6% from 1Q2019 and 14% from 4Q2019, according to Charles Schwab’s latest SDBA Indicators report.

SDBAs are brokerage accounts within retirement plans, including 401(k)s and other types of retirement plans, that participants can use to invest retirement savings in stocks, bonds, exchange-traded funds, mutual funds and other securities that are not part of their retirement plan’s core investment offerings.

The first quarter SDBA Indicators Report also showed Trading volumes increased in the first quarter of 2020 compared with the previous quarter, with an average of 13 trades per account, up from seven in Q4 2019. These trends matched trends in broader investor activity during the turbulent first quarter of 2020.

Asset allocations remained similar to last quarter, with the exception of an increase Cash holdings rose to 19% in 1Q2020 from 12% in 4Q2019. Mutual funds continue to represent 34% of participant assets (34%), followed by equities (27%), cash (19%), ETFs (17%), and fixed income (3%).

Allocation trends

Mutual funds: Large-cap funds had about 30% of all mutual fund allocations, followed by taxable bond (22%) and international (14%) funds.

Equities: Information technology remained the largest equity sector holdings at 29%, up from 27% last quarter. Apple (AAPL) continues to be the top overall equity holding, comprising 11% of the equity allocation of portfolios.

The other equity holdings in the top five include Amazon (AMZN) (6.5%), Microsoft (MSFT) (3.6%), Berkshire Hathaway (BRKA) (2.5%), and Tesla (TSLA) (2.1%).

ETFs: Among ETFs, investors allocated the most dollars to U.S. equity (48%), followed by U.S. fixed income (18%), international equity (13%) and sector ETFs (10%).

Report highlights

On average, participants held 10 positions in their SDBAs at the end of Q1 2020, which has remained steady both year-over-year and quarter-over-quarter. Gen X made up approximately 43% of SDBA participants, followed by Baby Boomers (37%) and Millennials (14%).

Baby Boomers had the highest SDBA balances at an average of $367,425, followed by Gen X at $199,071 and Millennials at $65,207. Gen X had the most advised accounts at 45%, followed by Baby Boomers (41%) and Millennials (11%).

‘Schwab Stock Slices’ now available

Schwab also announced that its new Schwab Stock Slices service is now available in the Schwab Personal Choice Retirement Account, the firm’s SDBA offering. The service lets investors own any of America’s leading companies in the S&P 500 for as little as $5 each, even if their shares cost more. Investors can use the new service to purchase a single stock slice or up to 10 different Stock Slices at once, and they can hold slices of as many S&P 500 companies in their account as they wish through multiple purchases. Schwab Stock Slices are purchased commission-free online, just like regular stock trades at Schwab.

The SDBA Indicators Report includes data collected from approximately About 145,000 retirement plan participants with balances between $5,000 and $10 million in their Schwab Personal Choice Retirement Account were surveyed for the latest SDBA Indicators Report. Schwab extracts data quarterly from all accounts that are open as of quarter-end and meet the balance criteria.

Empower on path to implementing SEC’s ‘Reg BI’

With the Securities and Exchange Commission’s (SEC) Regulation Best Interest set to take effect June 30, Empower Retirement will continue to act as a fiduciary for its client retirement plans, the Denver-based full-service retirement plan provider said this week.

Empower serves approximately 9.6 million individuals through defined contribution retirement plans, Individual Retirement Accounts and retail brokerage accounts.

In a release, Empower said it “will continue to expand the scope of its field representative service model so that individual retirement plan participants can discuss investment strategies with their Empower representative.”

“Reg. BI,” as the new SEC rule is known, requires broker-dealers and their registered representatives to act in the best interest of their retail customers, including both plan participants and IRA owners, when recommending securities and investment strategies, including rollovers and account-type recommendations.

The regulation is designed to ensure that broker-dealers and their registered representatives act under a higher standard of care when making such recommendations to everyday investors..

Investment advice provided to participants in retirement plans that are subject to the Employee Retirement Income Security Act (ERISA) must satisfy ERISA’s fiduciary conduct standards. Empower representatives offer fiduciary investment advice designed to meet ERISA’s standards, to participants in both ERISA and non-ERISA plans.

Reg. BI applies to investment recommendations made to retirement plan participants in 401(k), 403(b) and 457 plans, among others, as well as IRA owners and retail brokerage customers. It does not apply to interactions with plan sponsors or plan advisors and representatives.

Empower will continue to provide investment education to those plans that have not authorized Empower’s advice service, and those participants and retail customers who are interested in making their own investment choices without a recommendation or advice from Empower.

When allowed by the plan sponsor, field representatives of Empower’s registered investment adviser (RIA), provide fiduciary advice to plan participants who seek it. As such, Empower will update disclosure and procedures around client interactions, and its supervisory structure in place through Empower Advisory Services.

Under Reg. BI, broker-dealers will need to diligently collect information to determine if an investment is in the individual’s best interest. The registered representatives of the broker-dealers must disclose to the individual any conflicts of interest they have—such as payments from companies whose products they recommend.

Lincoln expands retirement plan investment options

Lincoln Financial Group is offering a new Multi-Manager solution built on Lincoln Variable Investment Product (LVIP) funds within the Lincoln Director program.

Lincoln Director Multi-Manager gives plan sponsors access to more than 80 LVIP funds with Lincoln Investment Advisors Corp. (LIAC) serving as the investment advisor. LIAC provides unbiased, third-party oversight over the selection of fund managers from a stable of experienced sub-advisory firms to provide day-to-day portfolio construction. Financial professionals and their clients can construct their investment lineup from the LVIP fund list, or they can choose to receive 3(38) fiduciary support from Morningstar Investment Management LLC to develop, monitor and update the portfolios on an ongoing basis. In addition, financial professionals have access to Lincoln Financial’s Client Investment Support team.

The Lincoln Director Multi-Manager funds also offer YourPath Multi-Manager collective investment trust (CIT) portfolios. By offering multiple glide path options based on risk tolerance, YourPath CIT portfolios provide a more personalized target-date investment for retirement plan participants. The selection of these portfolios allows plan sponsors to offer participants conservative, moderate and growth glide paths developed by Morningstar Investment Management. Plus, they may be used as a plan’s Qualified Default Investment Alternative (QDIA), Lincoln’s release said.

Troubled muni bonds weigh heavy on insurers: AM Best

Given the severe medium-term impacts on the municipal bond markets driven by the pandemic, according to a new AM Best special report.

The significant decline in revenue of states and cities during the COVID-19 pandemic likely will affect municipal bondholders, according to a recent Best’s Special Report, “Severe Test for the Municipal Bond Market.”

The report describes insurers’ muni exposures as “significant.” “U.S. insurance companies with more significant exposures, particularly revenue bonds for the more vulnerable sectors such as transportation and retail, are more likely to feel the negative market effects,” a release from A.M. Best said.

More than two-thirds of the municipal bonds held by insurers are from New York, New Jersey, Illinois, Massachusetts, California, and others hit hard the pandemic.

Of the three major insurance segments, property/casualty insurers have the greatest municipal bond exposure, although it has decreased by 20% since 2016, when the Tax Cuts and Jobs Act made the tax-exempt status of this asset class less advantageous. Nevertheless, the segment’s exposures remain considerable, as municipal bonds constitute nearly 14% of the property/casualty segment’s invested assets, compared with 12% and 4.1% for the health and life/annuity segments, respectively.

The life/annuity segment’s municipal bond exposures represent 42% of their capital and surplus, exceeding that of other two segments. Companies rated by AM Best account for nearly 90% of the insurance industry’s municipal bond holdings.

Given their relative value and tax-exempt characteristics, municipal bonds will continue to play a role in an insurer’s strategic asset allocation. However, selecting appropriate exposures will be critical to insurers’ ability to manage through this tumultuous cycle. “The expertise and risk management practices of insurers and their investment managers will be tested,” said Jason Hopper, associate director, industry research and analytics. “Insurers that have a deep understanding of the municipal bond markets and well-defined risk thresholds based on solid credit risk fundamentals will perform better during and after the pandemic crisis.”

All asset classes have been affected by the pandemic, providing yet another illustration of rising correlations during times of stress. AM Best will continue to monitor the overall impact of deteriorating conditions on insurers’ ability to maintain adequate capital appropriate for their business and investment risks.

Emory University 403(b) fee suit moves toward settlement

A preliminary settlement approval motion on behalf of Emory University employees and retirees in their suit against the university involving their 403(b) retirement plan has been filed by their counsel, Schlichter Bogard & Denton, the St. Louis-based scourge of retirement plan sponsors and service providers.

The complaint, Henderson, et al., v. Emory University, et al., was originally filed in the U.S. District Court in the Northern District of Georgia in Atlanta in August 2016. The plaintiffs sued for alleged breach of fiduciary duty under the Employee Retirement Income Security Act (ERISA).

Emory denied it committed any fiduciary breach in its operation of its plan. The settlement creates a $16.75 million settlement fund for the plaintiffs, and non-monetary changes in rules governing the 401(k) plan.

The case was part of a group of cases filed by Schlichter Bogard & Denton, LLP, which is the first law firm ever to sue a university 403(b) plan alleging excessive fees. Schlichter Bogard & Denton, LLP also filed the first cases over excessive fees in 401(k) plans.

The complaint alleged that Emory University breached its duties of loyalty and prudence under ERISA by causing plan participants to pay excessive fees for both administrative and investment services in the plan.

Besides the financial compensation, Emory agreed:

  • To conduct a Request for Proposals for bids on recordkeeping fees;
  • To prohibit the recordkeeper from using confidential information obtained from Emory employees and retirees to market IRA’s, insurance, and wealth management services
  • To hire an independent consultant to make recommendations regarding plan investments
  • To inform plan participants of changes in plan structure.

According to the motion, Schlichter Bogard & Denton, LLP will monitor Emory’s compliance with the terms of the settlement for three years.

© 2020 RIJ Publishing LLC. All rights reserved.

Does Your Suffering Need Buffering?

Ten short years ago, the annuity developers at AXA Equitable (now Equitable Financial) faced a dire challenge. Their flagship variable annuity had become an albatross, thanks to volatility and low rates in the wake of the Great Financial Crisis. They needed to create a new vehicle for the new environment.

So they invented the “structured” or “indexed” variable annuity (IVA). For gains, it relied on the purchase of options on an equity index. It posed a risk of loss for the client—but a “buffer” broke the fall. It was essentially a structured note in an annuity wrapper.

Sales of the quirky product blossomed, breathing life into Equitable Financial’s bottom line. Other annuity issuers took notice. They created IVAs of their own, gradually eating into AXA’s market share. So far, 11 life insurers have launched IVAs, most recently Prudential.

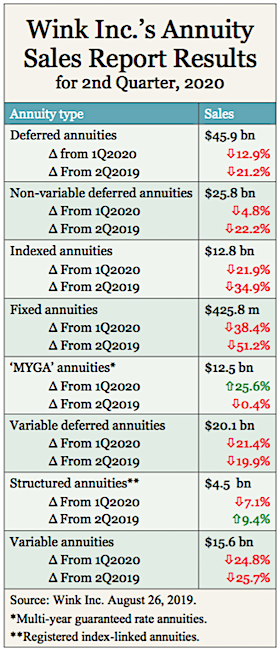
The IVA is now the darling of annuity issuers and distributors. At less than $5 billion, its 1Q2020 sales were still much less than sales of fixed indexed annuities (FIAs) ($16.4 billion) or variable deferred annuities ($25.6 billion). But, year over year, only IVA sales have risen.

“Structured annuities are the new shining star of the annuity market,” said Sheryl Moore, CEO of Wink, Inc., the Des Moines-based annuity market analysis firm. “There’s a perfect storm fueling sales for this product, as there was for fixed indexed annuities after 2008. This is where life insurers will start focusing their product development resources.”

For the second consecutive June, Wink and RIJ are collaborating on a four-week series of articles about the indexed annuities market. This year we’re drilling down on IVAs, but we won’t ignore other parts of the market. In this article, we’ll use IVA data from Wink’s Sales and Market Report for first-quarter 2020 as a framework for discussion.

Top IVA Issuers

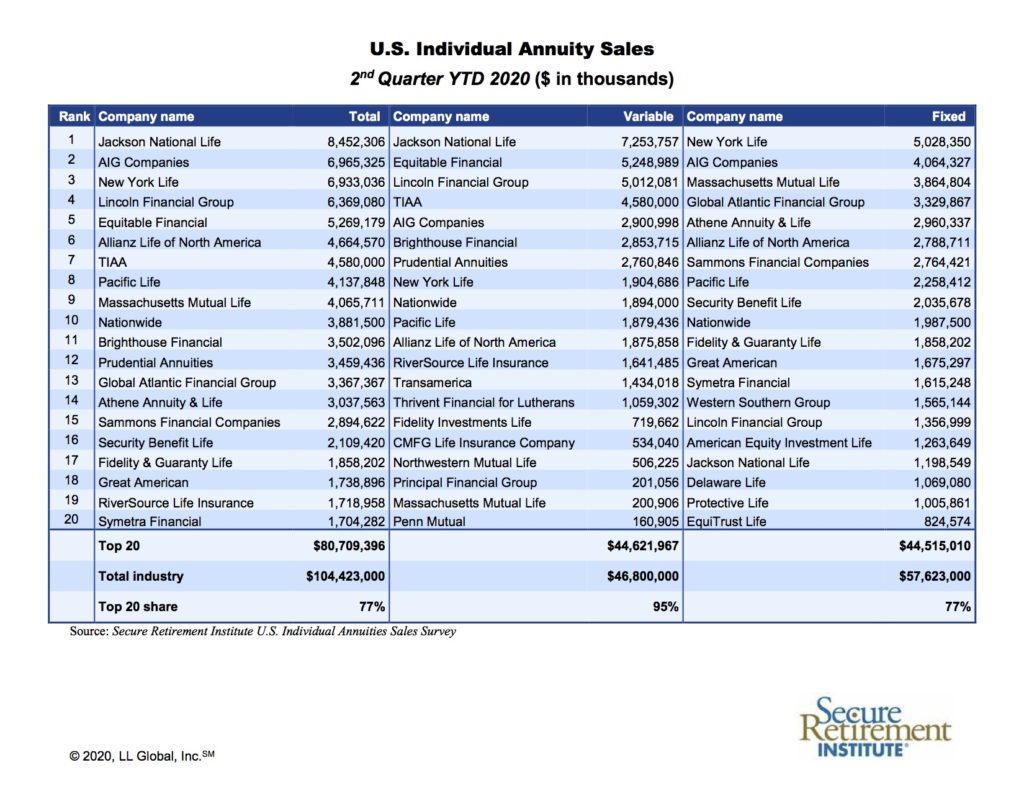
For the past five quarters, the same companies in the same order have been the top five sales leaders: Equitable Financial, Brighthouse, Allianz Life, Lincoln National and CUNA Mutual. These five companies alone account for 95% of annual sales. While scores of life insurers sell variable deferred or fixed deferred annuities, only 11 companies sell IVAs so far. Equitable has led in sales since 2010, and has had the largest share of the indexed variable annuity market since creating the category in 2010. But that market share has gradually slipped from 100% to 50% to the present 25%. Among its competitors, the fastest follower seems to be Lincoln—whose high sales growth rate reflects its relatively recent entry into the market, in 2018.

The upward trend in IVA sales is expected to continue this year. After IVAs sold $11.2 billion in 2018 and $17.4 billion in 2019, LIMRA Secure Retirement Institute (SRI) expects another bump in 2020—for a near doubling in two years. “We’re expecting registered index-linked annuities (IVAs) sales of $19 billion to $21 billion this year,” Todd Giesing, senior annuity research director, SRI, said in an interview.

Top-selling IVA contracts

We’ll look more closely at the five best-selling contracts. In most cases, they offer links to the performance of the S&P 500 Index, the Russell 2000 Index, and the MSCI-EAFE global index; options on these popular indexes are liquid and priced efficiently. A few other indexes are offered for variety, as noted below. All of the products are registered securities, but, as retirement savings products, they offer tax-deferred growth.

Most of these contracts allow owners to opt (in advance) for a fixed, positive rate of return if the index return is zero or positive. This feature goes by multiple names; it is variously called a Step Rate, a Step Up, a Precision Rate, and a Trigger Rate. It tends to be available only when the one-year term crediting option and -10% buffer are chosen, and ranges varies from 7.75% to as much as 14%. Contract owners can divide their principal among different crediting strategies.

The leading contracts all offer the client some protection against downside risk through their buffers. All feature a -10% downside buffer; Allianz Index Advantage also offers a floor. Deeper levels of protection, such as -15%, -20%, -25%, and -30% buffers, are offered in different combinations within different contracts. Lincoln Level Advantage offers 100% downside protection, which matches the protection of an FIA. With a buffer, investors lose nothing until market losses exceed the buffer limit. With a floor, investors can’t lose more than the floor limit.

These five contracts include death benefits and six-year surrender-charge periods (typical of products sold by commission). Enhanced death benefits are sometimes available for a surcharge, and the first-year penalty (e.g., 7%) for withdrawals greater than 10% of the contract varies by company.

(We wish we could describe or at least mention many of the other indexed variable annuities offered by the 11 life insurers in this niche. We’ll try to make up for that in a future article. Please note that, while we’ve tried to publish up-to-date rates, the rates available on new products change frequently. )

Lincoln National Life Level Advantage B-share. “Uncapped” crediting strategies are a big sales hook in the (fixed and variable) indexed annuity market, implying that the client will earn 100% of the index return (dividends excluded), however high it goes. Lincoln’s Level Advantage offers an uncapped strategy on four indexes, but only when clients leave their money in for six years, accept a -10% buffer, and link their investment to the performance of the Capital Strength Index, which invests in 50 stocks hand-picked by First Trust Advisors for favorable cash-on-hand levels, debt ratios and volatility. The contract also offers “100% participation” crediting methods on three-year holding periods with a -10% buffer.

Owners of this contract can also invest part of their balances in any of 14 investment options. They can access Lincoln’s patented i4Life lifetime income option, for an extra fee of 40 basis points per year. This contract gives the client the option to lock in gains at the end of each contract year of a six-year term, rather than waiting six years to lock in gains.

Brighthouse Life Shield Level 6. Not to be outdone on offers of upside potential, this contract offers a 300% participation rate on the performance of the large-cap S&P 500 Index, the MSCI-EAFE Index and a 90% participation rate on the small-cap Russell 2000 Index. But that option requires a six-year holding period and acceptance of net losses beyond the first 10%. “Level 6” refers to the six-year surrender period; there’s also a Level 3 product with no surrender penalties after a three-year holding period.

Equitable Structured Capital Strategies Plus. Only a few weeks ago, Equitable enhanced this product with a new optional feature called “Dual Direction.” If, at the end of the six-year term, the index return is between zero and -10%, the client will receive a gain equal to the loss. That is, if the S&P 500 was down 6% after six years, the client would earn 6% over six years. Structured Capital Strategies also offers uncapped upside on the six-year term option linked to the S&P 500 Index and MSCI-EAFE.

Allianz Index Advantage. Unlike the other leading contract, the Index Advantage includes an 1.25% “product fee.” This annual fee, paid by the contract owner, gives the product a bigger hedge budget. This presumably allows the purchase of more upside-potential from the options sellers. Another version (“Index Advantage NF”) has no product fee. This contract also has a $10,000 minimum initial premium—considerably less than the $25,000 some competitors require. This product is alone in offers “floor” in addition to a buffer. The floor protects the contract owner from losses in excess of 10%.

Allianz Index Advantage Income. Otherwise identical to Index Advantage, this contract offers a rider that guarantees income for life. The income rider costs 70 basis points of the contract value per year. At age 67, for example, a contract owner could receive 5.70% of the contract value each year for life (5.20% for a couple). An inflation-averse contract owner can opt for an annual increase in the payout percentage but the first-year payout percentage will be lower. For instance, at age 67, the payouts would be only 4.90% for a single owner (4.40% joint) but the payout percentage would go up by 40 basis points every year thereafter. The minimum initial premium for the contract only $5,000.

Where IVAs are sold, and who sells them

Annuity products may be complex and hard to understand, but annuity “distribution” is arguably even harder to grasp. Different annuity contracts travel different routes from manufacturer to wholesaler to distribution firm to adviser to client. Depending on product design, certain annuities can be sold by certain kinds of advisers in some venues but not others. 

Because investors can lose money on them, IVAs must be registered with the Securities and Exchange Commission and only securities-licensed advisers can sell them. IVAs are typically sold by commission, so representatives of RIAs (Registered Investment Advisors), can’t sell them; RIAs charge a percentage of the value of the assets they manage.

Consequently, most IVAs are sold by investment advisers at either independent broker-dealers (55%) or at banks (27%). Insurance agents without securities licenses—who are the biggest sellers of fixed indexed annuities—can’t sell them. Wealth managers at full-service brokerages (aka “wirehouses”) generally do not sell them, preferring to sell their companies’ proprietary structured products, according to Giesing.

Most popular contract structures

In their search for higher yields, more contract owners appear to be opting for the longer-term versions of these products, according to Wink’s data. In 1Q2019, 95% of the IVA contracts (by premium volume) used one-year point-to-point crediting methods. In other words, clients locked in gains (or losses) on each contract anniversary. (This particular data was based on responses from two-thirds of companies surveyed and covered 51% of premium.)

But a year later, in 1Q2020, 37% of premium volume went to contracts where investors chose to keep their money invested for terms longer than one-year. The six-year term is popular because it offers some of the highest and most alluring potential gains. Generally, the longer the holding period, and the smaller the downside buffer, the higher the upside potential for the crediting method, regardless of the index selected.

“The pricing will be more favorable with the longer-durations,” according to SRI’s Giesing. “Investors are also opting for more downside protection. As market volatility has increased, issuers are seeing more flows into the larger buffers—the -20% and -30% buffers.”

Wink’s survey suggests that investors are comfortable with the buffer concept. For more than three-quarters of premium, the contract owner chose a downside buffer (where the owner’s losses don’t start until the account value has dipped by at least 10%), 13.8% chose a downside floor (where the owner absorbs losses up to 10%, but no farther), and 9.9% chose 100% protection—thereby turning their IVA into the equivalent of a super-safe FIA with a maximum upside of only about 3.4% per year.

Additional sales patterns

Qualified sales (where the premium is paid with tax-deferred money) represented 62% of total first quarter structured annuity sales, with 64% of the premium coming from Individual Retirement Accounts (IRAs) and 36% from employer-sponsored retirement plans. The average issue age from all contracts was 62. The evidence suggests that older investors are buying this product to protect their assets during the so-called “red zone” around the retirement date, when they are vulnerable to losses that they don’t have time to recover.

The average structured annuity sales premium reported was $138,685 a decline of nearly 3%, compared to the previous quarter. The average structured annuity premium ranged from $43,786 to $677,524. The policy count overall was 18,982 policies for the quarter, an increase of more than 6% as compared to the previous quarter. The average policy count per issuer was 2,109.

© 2020 RIJ Publishing LLC. All rights reserved.

June is Index Month at RIJ

The yen to earn a slightly higher (but safe) rate of return, especially in a world where 10-year Treasury bonds yield six-tenths of a percent per year, sends investors and their advisers on some strange journeys into some odd locales.

Everyone knows that better bond returns live farther out on the yield curve and in weaker credit risks. Higher returns are also found through leverage, illiquity, emerging markets, and securitized loans. But older, more cautious investors don’t always want to go there.

Where investor needs appear, financial products follow. A handful of life insurers are putting an increasing amount of their actuarial and quantitative talents behind a relatively new kind of insured investment called an indexed variable annuity.

You may not be familiar these products, which are sold mainly by securities-licensed advisers in banks and independent broker-dealers. Or you may know them as “structured variable annuities” or by the acronym “RILA,” for registered index-linked annuities.

In June, Retirement Income Journal dedicates most of its coverage to the world of indexed annuities. This year we’re concentrating on the indexed variable annuity, for two reasons. Its sales are growing, despite the repressive rate environment. It also defies easy understanding.

An investor presented with the brochure for an indexed variable annuity (IVA) faces almost as many choices as a gambler at a roulette table or a sportsman at the track. On the upside, should they grab a chance to earn 80% over three years, or 200% over six? On the downside, should they agree to absorb all losses in excess of 10% per year, or all of the losses up to 10% a year? What are they likely to earn? That’s a tough question, since issuers can alter these products in mid-stream.

In this week’s issue of RIJ, with the help of Wink Inc., the annuity sales and marketing consultant, we’re going to review the first quarter sales performance of IVAs. In the accompanying feature article (“Does Your Suffering Need Buffering?”), we’ll identify the leading manufacturers, the most popular contracts, and the busiest distribution channels for IVAs.

In the weeks ahead, we’re going to dive as deeply as we can into the ways IVAs are designed and priced. Promotional literature for IVAs touts their potentially high returns and simultaneous safety. How do they do that? We know they work like structured notes, relying on a combination of puts and calls to apportion risk between an investor, an insurer and an option writer. But how?

We will also inquire into the nature of the product’s “buffers” and “floors.” In return for a chance at higher returns, buffers require investors to accept the rarest, largest risk of loss, while the floors require them to absorb the smaller, but more likely losses. How can an investor assess that trade-off?

Also this month, we’ll look at a new venture by a Midwest brokerage firm that involves a new retirement planning software and a novel type of single premium immediate annuity that uses indexing to produce the opportunity for rising income for life.

As always, we aim our content at two main audiences. We write for the creators of retirement income solutions. We also write for what we call “ambidextrous” advisers—advisers who want to become more adept at combining investment and insurance products to maximize their retirees’ incomes at minimum risk.

For advisers who prefer to avoid annuities but are still curious about products that manage risk with index options, take a look at today’s story about the structured ETFs that are offered by Allianz Life and by Innovator Capital Strategies.

I know that some readers will always believe that the Jack Bogle method—buy and hold a bond index fund and an equity index fund, with the equity portion equal to 100 minus the investor’s age—is the only risk management technique that most investors will ever need. But demand (and supply) is clearly growing for more creative (and complex) palliatives for investor anxiety.

© 2020 RIJ Publishing LLC. All rights reserved.

A buffet of buffered ETFs for jittery investors

Allianz Investment Management LLC (AllianzIM), a unit of Allianz Life Insurance Company of North America this week launched two structured investment products, each linked to the performance of an exchange-traded fund (ETF) consisting of options on the S&P 500 Price Return Index.

The new products are AllianzIM U.S. Large Cap Buffer10 Apr ETF and AllianzIM U.S. Large Cap Buffer20 Apr ETF. The Buffer10 version protects the owner from any loss that doesn’t exceed 10% over the ownership period, while the Buffer20 version eliminates any loss that doesn’t exceed 20%. The products will be available on the Halo Investing structured products distribution platform.

There are now at least four competitors in this product space, all hoping to attract business from today’s (justifiably) nervous investors:

Innovator Capital Management, which pioneered this concept in 2018; New York Life Investments, which announced on April 23 that it will distribute a version engineered by m+; First Trust, which offers Target Outcome Funds; and now AllianzIM, which touts its experience with indexed products and risk management as a competitive advantage.

For those unfamiliar with structured ETFs or structured indexed annuities, these products offer investors a defined range of outcomes, with upper limits on gains (caps) and partial downside protection (buffers). Allianz is a leading issuer of indexed annuities, but the new structured ETFs work very differently.

When an investor buys a indexed variable annuity (IVA), the money goes into a life insurer’s general account and earns income. Part of the income is used to purchase options on the performance of an equity index or ETF. In a structured ETF, by contrast, the investor owns a basket of FLEX options (on an ETF chassis) on the S&P 500 Index. For a deeper explanation, click here.

As noted above, Innovator Capital Management, in partnership with Milliman, the actuarial consulting firm, invented the category and considers the technology behind the Defined Income concept to be proprietary. (Patents are pending.) Innovator has launched 46 Defined Outcome structured ETFs since 2018, and has $2.9 billion in assets under management.

Innovator this week announced the upside caps and return profiles for its new June Series of S&P 500 Buffer ETFs, running from June 1, 2020 to May 31, 2021. The series include Innovator S&P 500 Buffer ETF (Cap of 16.35% and buffer of -9%), Innovator S&P 500 Power Buffer ETF (11.30% cap and buffer of -15%), and Innovator S&P 500 Ultra Buffer ETF (7.25% cap and downside protection between -5% and -35%).

The current cap for the AllianzIM Large Cap Buffer10 is 10.6% before fees (10% after fees) for the one-year term, where the issuer absorbs the first 10% of losses, according to Allianz. The current one-year cap for the Large Cap Buffer20, which doubles the contract owner’s downside protection, is 5.41% before fees (4.79% after fees).

“We’re bringing our institutional risk management expertise to retail investment options,” said Corey Walther, head of business development and distribution relationship management at Allianz Life, in an interview with RIJ. He noted that the new product complements the Allianz Index Advantage suite of structured annuities.

“The ETF opens up a broader audience than we’ve historically approached. We can have a broader conversation with advisers. We don’t have to talk about annuities alone,” Walther said.

The product also broadens Allianz Life’s potential audience. “Investors in their late 20s and early 30s wouldn’t usually be part of the target market for annuities, but with the buffer ETF we can still give them a level of protection they can’t get elsewhere,” he said. “For consumers in their mid-60s, our testing shows that their biggest fear, for years, has been that a financial crisis will hit just before they retire. We now have a solution that lets them stay invested for the long-term.”

Cost-wise, the products are roughly in the same range, he added, if you recognize that advisory fees will be added to the ETF but not to the IVA, whose distribution cost is built into the crediting rates. “Our structured ETF has an expense ratio of 74 basis points not counting adviser compensation. Our Index Advantage structured annuity (a commission product) has a 1.25% product fee. “Where the caps and buffers on the ETFs are good for 12 months, the annuity offers a potential duration of up to six years, which can provide more potential upside,” Walther said.

In April, New York Life Investments announced that it would join this niche. According to a press release, New York Life Investments would be the exclusive distributor of a suite of defined outcome retail solutions produced by m+.

“Using regularly issued m+ funds, investors can adjust their exposure to a broad-based market ETF over a fixed time period to seek enhance upside capture potential, downside protection potential, or both,” the release said.

m+ funds offer three types of strategies: Preservation, Buffered and Growth.  “Preservation” and “Buffered” m+ funds aim for upside exposure to an ETF, but with varying levels of protection in down markets depending on the strategy terms. “Growth” m+ funds aim for higher upside, with no downside protection. All m+ funds are offered under a fiduciary framework, provide full transparency on fees and holdings, contain no corporate credit risk, have efficient tax treatment, and provide daily liquidity at net asset value (NAV).

© 2020 RIJ Publishing LLC. All rights reserved.
CBO: Crisis will cost US economy $15.7tr over 10 years

In its May 2020 report, the Congressional Budget Office projected that the level of nominal GDP in the second quarter of 2020 would be $790 billion (or 14.2%)lower than the agency had previously forecast in January 2020.

The two largest differences between the two forecasts result from the economic effects of the COVID-19 pandemic in reducing output and the legislation enacted between January and early May in response, which partly offsets that reduction. Subsequently, the difference between those projections of nominal GDP narrows from $533 billion (9.4% lower in the May projection) by the end of 2020 to $181 billion (2.2% lower) by 2030.

As a result of those differences, CBO projects that over the 2020–2030 period, cumulative nominal output will be $15.7 trillion less than what the agency projected in January. That difference constitutes 5.3% of the value for cumulative nominal GDP for that period that the agency projected in January.

Real GDP

The revised forecast for nominal GDP reflects a significant markdown in CBO’s projection of real (inflation-adjusted) production in the United States as a result of the pandemic.

Business closures and social distancing measures are expected to curtail consumer spending, while the recent drop in energy prices is projected to severely reduce U.S. investment in the energy sector. Recent legislation will, in CBO’s assessment, partially mitigate the deterioration in economic conditions.

CBO’s May projection of real GDP in the second quarter of 2020 was $724 billion (or 13.3%) lower in 2019 dollars than the agency’s projection from January. Beyond the second quarter of 2020, the difference between those projections of real GDP shrinks, to $422 billion in 2019 dollars (7.6% lower in the more recent projection) by the end of 2020 and roughly disappears by 2030. As a result of those differences, CBO projects that over the 11-year horizon, cumulative real output (in 2019 dollars) will be $7.9 trillion, or 3.0% of cumulative real GDP, less than what the agency projected in January.

The Role of Inflation

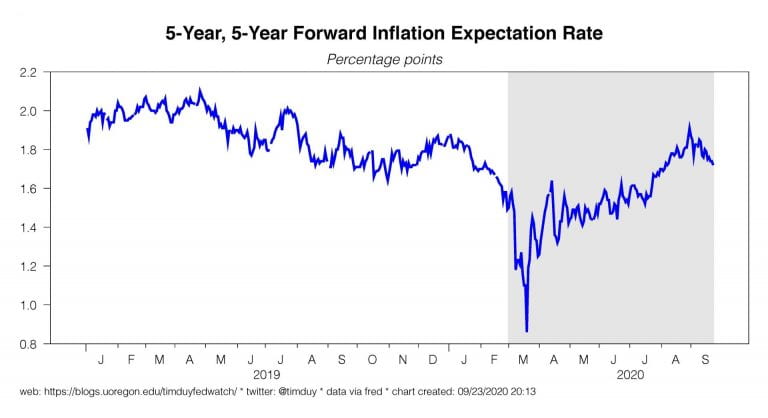
CBO also marked down its projection of nominal output because the agency expects that inflation will be weaker as a result of the pandemic. Lower projected inflation rates, particularly in 2020 and 2021, reduce the level of prices and nominal GDP relative to what CBO projected in January. In the May projections, the downward revision to inflation derives mostly from lower projected rates of inflation for energy prices and the prices of travel and transportation services.

Over the first few years of the 2020–2030 period, the revision to estimates of nominal GDP primarily reflects changes in real production, but as the effect of changes in real production wane in later years, the lower price level has an increasing influence. The contribution of those lower prices to the lower estimates of nominal GDP can be seen by comparing the revisions to the projections for nominal and real output. By 2030, lower prices account for roughly all of the revision to nominal GDP.

Uncertainty

An unusually high degree of uncertainty surrounds these economic projections, particularly because of uncertainty about how the pandemic will unfold this year and next year, how the pandemic and social distancing will affect the economy, how recent policy actions will affect the economy, and how economic data will ultimately be recorded for a period when extreme changes have disrupted standard estimation methods and data sources.

Additionally, if future federal policies differ from those underlying CBO’s economic projections—for example, if lawmakers enact additional pandemic-related legislation—then economic outcomes will necessarily differ from those presented here.

Future Work

CBO will continue to evaluate the impact of the pandemic and the trajectory of the U.S. economy. Later this year, the agency will publish a more comprehensive economic forecast covering the years through 2030.

The May projections for years after 2021 are preliminary because they do not fully reflect changes to CBO’s forecast. In particular, the agency did not update its estimates of the economy’s potential output in light of the pandemic beyond the effect that lower business and residential investment has on the nation’s capital stock (or productive resources).


More Self-Inflicted Risks Than We Need

I don’t know what to tell you. Seriously. Our government just seems to want to inject additional risk into an already troubled situation.

In some ways, it’s all straight-forward. We deliberately brought the economy to a standstill. We got behind the curve on the Covid-19 virus and really didn’t have much of a choice but to shut it all down. The immediate outcomes were fairly predictable.

Employment dropped sharply and household spending plummeted. We know the former already via initial jobless claims and employment reports and we get another round of negative news on that front this Friday. Last week we saw how deeply spending plummeted in April. Not pretty:

Still, not unexpected. The entire point of the shutdowns was to choke o activity by keeping people at home. And there was something of a plan to deal with the economic fallout, albeit a bit of a haphazard plan.

That plan too was in some ways simple: Pump income into households via a variety of mechanisms to keep the money flowing in the economy. And that too was successful, at least at a macro- level. Transfers more than compensated for lost wages and salaries:

Again, this is at a macro-level; at a micro-level, the unequal and slow distribution of money, particularly as associated with unemployment insurance, has left many struggling to bridge a gap in their finances. That said, many will receive benefits in excess of their incomes. It’s not a perfect plan in any sense, but not the worst especially considering how quickly it was implemented.

As we begin to see a reawakening of the economy, activity will jump higher. Not jump back to February, but it will bounce. Some sectors will some back quickly; I expect health care employment, for instance, to regain jobs quickly as elective procedures return. You can even see the bottoming-out of the economy starting to form in the ISM manufacturing numbers:

Of course, while the initial phase of the recovery may feel a bit thrilling, the recovery will most like lose speed soon thereafter. Too much of the economy will continue to be suppressed to some degree to allow for a fuel recovery. Moreover, firms that went out of business during the shut downs by definition won’t be restarting quickly.

Consequently, the economy will continue to need federal support to transition into whatever the post-Covid economy looks like. It is imperative to keep the money owing to households during the transition.

The Republicans, however, are trying to back away from fiscal support sooner than later and look to be trying to limit the size of the next package to something under $1 trillion. Senate Majority Leader Mitch McConnell is also claiming it will be the last bill. I continue to believe (hope?) that this is more posturing than anything else. I would think the Republicans have enough problems heading into the fall that they wouldn’t want to rip the rug out from under the economy. Something bigger than McConnell’s current position seems likely.

Sadly, even the Democrats are beginning to line up with the deficit hawks as a bipartisan group of House members already looks to curtail the national debt. There is no need for this. It sets up expectations that the government will more likely than not allow only a partial recovery of the economy. There is no reason to have this discussion before the economy has regained its footing. It’s simply counterproductive.

Oddly, I would like this to be the last major federal support package because I would prefer that it be open-ended with provisions that phase out support as the economy improves. What we will likely get instead is package that limps along the economy enough to keep the de cit hawks claiming there is no need for more. Enough to keep the economy growing yet it becomes a fight to get more down the road. It’s the kind of fiscal outlook consistent with a persistent output gap such as that of the CBO’s new estimate. The CBO predicts it will take a decade before output regains levels of the pre-Covid projections.

OK, so let’s just assume that we get another blast of fiscal support. It won’t be a $3 trillion bill, but it will probably be more than a $1 trillion. At the same time, the Fed is keeping the pedal to the metal with low interest rates, asset purchases, lending programs, and increasingly clear guidance that policy rates will be zero for a long time. Overall, a generally supportive set up for financial markets in the near term. Not great, but good.

Problem is that this story feels more vulnerable this week. The rise of unrest across the nation, and the lack of leadership to quell that unrest leaves a big question mark over the outlook. The best-case scenario is that the riots soon revert back to continuous, massive, but peaceful protests. The worst-case scenario is that President Donald Trump acts on his threat to use military force to end the riots.

I would prefer not to think about such possibilities, yet here we are. Aside from the obvious additional damage to the nation’s social fabric, widespread use of military force domestically would I suspect inflame the situation further, worsen consumer activity, and slow the progress of recovery.

In addition, it would intensify partisanship in Congress and delay the next fiscal support bill. Moreover, the large crowds and the shutting down of testing facilities also raise the question of a surge in Covid-19 cases in the weeks ahead; if the virus gained another foothold, we would find cities and states forced to retreat on plans to reopen.

Needless to say, widespread military action against U.S. citizens coupled with a resurgence in Covid-19 cases would be… bad. The psychology could turn against equities quickly, just as it did in March.

Bottom Line: On a certain level this shouldn’t be that hard, at least from a macro-policy perspective. Keep pumping money into the economy to support incomes as you build out the public health infrastructure to contain the virus while gradually ramping back up the economy. We just can’t fully commit to that program. That lack of commitment leaves us with a few more downside risks than I would like.

© Tim Duy. Reprinted by permission of the author.

In private, life insurers express ‘concern’

The COVID-19 pandemic infection has greatly affected the economy, resulting in volatile market conditions and impacting life insurers’ balance sheets, according to a new report from the Society of Actuaries, LIMRA, Oliver Wyman, and the American Council of Life Insurers.

The report was based on a survey of actuaries, investment managers, and risk managers directly involved in assessing the impact of recent events on asset/liability matching, or ALM. Thirty-two companies responded to the survey between April 22 and 28, 2020.

Top Concerns for ALM

Two-thirds of the companies are concerned or very concerned about the impact of low interest rates on ALM for their company. Twice as many respondents are very concerned about the impact of low rates for the life insurance industry (~47%) vs. the impact of low rates for their company (~22%).

When asked about the areas that low interest rates could impact, over half were either concerned or very concerned about new business margins (62%), Statutory earnings (59%), and new business sales (56%). When asked about ALM related challenges, most companies were concerned or very concerned about reinvestment yields (66%), new business yields (62%), credit migration (56%), and default risk (56%).

ALM Scenarios

About 85% of the companies use management scenarios to evaluate and set ALM strategies and over two-thirds use other deterministic and real-world stochastic scenarios. Management scenarios are defined as internal scenarios used for planning or other management decisions.

About two-thirds of the companies anticipate the 10-year and 30-year treasury rates to be in the range of 0.5-1% and 1-1.5%, respectively, by year-end for their base case scenario. About one-third of companies expect a negative 10-year treasury rate at the end of 2020 in their worst case scenario and 19% expect a negative 30-year treasury rate.

More than one-half of respondents take credit migration into account in their management scenarios. About 60% of respondents are considering running negative rate scenarios in sensitivity testing.

ALM Strategy

More than half of companies characterize their ALM in-force strategy as duration matched. For the 34% of companies that are not duration matched, inability to source long-duration assets and management position on interest rates were the most common contributing factors. Eighty-four percent of respondents use the same ALM strategy for new business as for in-force.

Investment Strategy

More than half of respondents have changed their investment strategy or are planning to change their investment strategy if recent conditions continue for the next several years. Of those who have changed or are planning to change, most cited higher-yielding assets classes and industry/sector allocations as areas to change.

Communication and Monitoring

Companies have not significantly changed their monitoring frequency for asset duration, liability duration and short-term cash balances. Companies have increased their monitoring frequency for policyholder behavior activities such as new premium deposits, policy loans, withdrawals and lapses. The majority of companies have received questions from senior management, the board of directors, rating agencies and regulators regarding their ALM position and strategy.

© Used by permission.

Bailouts Aside, the Fed Sees Red Ahead

The Federal Reserve’s Beige Book, a report on the U.S. economy that appears eight times each year, includes assessments received by Fed officials from various contacts outside the Federal Reserve System. The latest Beige Book, released May 27, 2000, appears below.

Overall Economic Activity

Economic activity declined in all Districts—falling sharply in most—reflecting disruptions associated with the COVID-19 pandemic. Consumer spending fell further as mandated closures of retail establishments remained largely in place during most of the survey period.

Declines were especially severe in the leisure and hospitality sector, with very little activity at travel and tourism businesses. Auto sales were substantially lower than a year ago, although several Districts noted recent improvement.

A majority of Districts reported sharp drops in manufacturing activity, and production was notably weak in auto, aerospace, and energy-related plants. Residential home sales plunged due in part to fewer new listings and to restrictions on home showings in many areas.

Construction activity also fell as new projects failed to materialize in many Districts. Commercial real estate contacts mentioned that a large number of retail tenants had deferred or missed rent payments. Bankers reported strong demand for PPP loans.

Agricultural conditions worsened, with several Districts reporting reduced production capacity at meat-processing plants due to closures and social distancing measures. Energy activity plummeted as firms announced oil well closures, which led to historically low levels of active drilling rigs.

Although many contacts expressed hope that overall activity would pick-up as businesses reopened, the outlook remained highly uncertain and most contacts were pessimistic about the potential pace of recovery.

Employment and Wages
Employment continued to decrease in all Districts, including steep losses in most Districts, as social distancing and business closures affected employment at many firms. Securing PPP loans helped many businesses to limit or avoid layoffs, although employment continued to fall sharply in retail and in leisure and hospitality sectors. Contacts cited challenges in bringing employees back to work, including workers’ health concerns, limited access to childcare, and generous unemployment insurance benefits. Overall wage pressures were mixed as some firms cut wages while others implemented temporary wage increases for essential staff or to compete with unemployment insurance. Most Districts noted wage increases in high-demand and essential sectors, while wages were flat or declining in other sectors.

Prices
Pricing pressures varied but were steady to down modestly on balance. Weak demand weighed on selling prices, with some contacts noting discounting for apparel, hotel rooms, and airfare. Several Districts also reported low commodity prices, including oil, steel, and several agricultural commodities.

Supply chain disruptions and strong demand led to higher prices for some grocery items including meat and fresh fruit. One District reported that firms faced additional costs related to safety protocols and social distancing compliance, while another District noted that the costs of personal protective equipment had risen due to strong demand.

Highlights by Federal Reserve District
Boston
Activity continued declining as a result of pandemic-related economic shutdowns and social distancing guidelines. Retail and tourism firms cut employment, staffing firms saw reduced demand, and most manufacturing contacts froze hiring. Respondents said the outlook was very uncertain.

New York
The regional economy continued to contract since the last report, though there were scattered signs of a pickup in early May. Businesses reported widespread layoffs and flat to declining wages, but the vast majority of separations were deemed temporary. Prices paid rose slightly, while selling prices edged down. Leisure & hospitality and retail trade have remained the most severely affected. Financial firms reported weaker activity.

Philadelphia
Business activity continued to fall sharply during the current Beige Book period, as the COVID-19 pandemic persisted. Nearly all sectors are operating at lower levels of activity. Government assistance eased liquidity concerns and addressed rapidly rising joblessness. General prices have begun to fall, but the wage path remains mixed. Firms also remain uncertain of the future.

Cleveland
Customer demand declined in a broad range of industries. The few areas of strength were limited to grocery sales and business lending. Firms responded with widespread layoffs, deep cuts to capital spending, and wage reductions for a growing minority of firms. Inflation pressures eased because of weak demand and lower commodity prices. Though many firms believe the worst declines have passed, few are expecting a strong recovery.

Richmond
The Fifth District economy contracted further in recent weeks as the shutdown measures to slow the spread of the COVID-19 outbreak continued to have severe consequences. Retail, travel, and hospitality remained some of the hardest hit industries, but negative impacts were reported in every sector. Employment declined sharply and price growth slowed slightly, remaining modest.

Atlanta
Economic conditions remained weak. Labor markets were soft and non-labor costs decreased. Retail sales of essential products and services rose and ecommerce activity grew. Hospitality activity continued to weaken. Residential real estate slowed somewhat and commercial real estate activity was mixed. Manufacturing activity decreased as new orders fell. Banking conditions were mixed.

Chicago
Economic activity declined sharply as the coronavirus caused major economic upheaval. Employment, consumer spending, business spending, construction and real estate, manufacturing, and agriculture all decreased substantially. Wages edged up and prices were little changed. Financial conditions improved modestly.

St. Louis
Economic conditions have weakened moderately since the previous report. Around half of firms are closed temporarily. Among the firms that are closed, about one-third expect to reopen in the next 3 weeks. Banks indicated a sharp increase in delinquencies, primarily in mortgages, credit cards, and auto loans, but expect fewer delinquencies in the third quarter.

Minneapolis
The Ninth District economy contracted further. Employment fell significantly, and wage pressures fell due to the decline in activity along with wage and salary cuts by some firms. While most sectors declined, oil and gas exploration and supporting industries saw a particularly steep decline as oil prices fell dramatically. Restaurants, lodging, and tourism continued to suffer, and agriculture fell from an already low level.

Kansas City
Economic activity declined substantially since the previous survey, and contacts remained pessimistic about future levels of activity. Contacts reported broad-based declines in consumer spending. Real estate activity declined significantly, and sales fell at transportation, wholesale trade and professional and high-tech services firms. Manufacturing activity contracted sharply, and energy and agricultural sectors weakened further.

Dallas
Economic activity contracted further, though the pace of decline moderated from April to early May in manufacturing and services. Oilfield activity fell to record lows. Home sales dropped sharply but were beginning to slowly improve. Employment plummeted, and selling prices fell. Outlooks were bleak and uncertain, largely centered on the speed and scope of the reopening.

San Francisco
Economic activity in the Twelfth District contracted markedly. Employment declined dramatically due to virus related disruptions. Prices remained generally flat. Activity in retail trade, consumer and business services, and manufacturing all contracted noticeably. Activity in the agriculture sector slowed further. The residential real estate market was mixed, while the commercial side slumped. Lending activity increased due to PPP loans.

Athene to use artificial intelligence-driven indexes in FIAs

HSBC has launched AiPEX, a family of equity indexes that uses artificial intelligence (AI) to pick stocks. The indexes are used in annuities underwritten by Athene Life & Annuity, which sold about $1 billion worth of FIAs in first-quarter 2020, according to a LIMRA Secure Retirement Institute chart.

“The AiPEX family of indices was developed by EquBot and leverages the AI capabilities of EquBot and IBM Watson to turn Big Data into investment insight,” an HSBC release said. HSBC is the exclusive licensor of AiPEX, and is offering a variety of investment solutions based on the indices to its clients globally.

AiPEX automatically consumes and analyzes a steady flow of publicly available “data points,” ranging from company announcements to tweets, satellite images of a store parking lot, or “even the tone of language a CEO uses during an earnings presentation,” according to the release.

“AiPEX uses a rules-based process to objectively evaluate each of the 1,000 largest U.S. publicly traded companies and selects those whose stock prices [the AI believes] are poised for growth,” the release said. The selection process “is similar to fundamental equity research approach, only thousands of times faster and broader in scope.”

AiPEX rebalances its portfolio monthly, and manages short-term volatility, by reallocating among chosen equity and cash on a daily basis.

“AiPEX with Watson simulates a team of thousands of analysts and traders working around the clock to learn from millions of pieces of information and identify potential investment opportunities,” said Dave Odenath, head of Quantitative Investment Solutions, Americas, at HSBC Global Banking and Markets.

© 2020 RIJ Publishing LLC. All rights reserved.

A Primer for Annuity Newbies

Many advisers have joined the Retirement Income Journal community recently, and many of them are new to the world of annuities. I’ve been asked to create a quick tutorial on this complex topic, if brevity with annuities is possible.

Annuities are special tools for investors who are willing to give up part of the upside potential of their investments in return for some protection against the downside risk. Unfortunately, to everyone’s confusion, most journalists mash-up the characteristics of different types of annuities when describing them.

All annuities do share certain qualities: They offer tax benefits, only life insurers can issue them, and every contract allows the owner to convert the underlying assets into an annuity—an income stream that will last for a certain period or for the owner’s entire life.

But the similarities end there. I first divide annuities into two categories: those used primarily for asset accumulation before retirement and those used primarily for generating income in retirement. Within each of those two major categories, I indicate the different ways they are invested: in mutual funds, bonds, or options.

Bear in mind that this article covers only the crests of the annuity mountain range; there are not only endless valleys but also countless cave systems waiting to be explored. Each of the product types described below exhibits almost infinite variation, and the variations themselves fluctuate over time.

Annuities for asset appreciation (before or during retirement)

Using bonds (with no risk of loss). Suppose you’re looking at certificates of deposits as safe short-term investment but the yields don’t interest you. You might look at fixed deferred annuities. You hand your $100k over to a life insurance company. The insurer puts your money into its general fund, where it earns about 4% per year. It subtracts its expenses—say, 1.5%—and pays you 2.5% a year. You have no risk of loss. Advisers must have insurance licenses to sell these products.

Using mutual funds (with risk of loss). You may have a large sum—up to $1 million or so—that you’d like to see grow tax-deferred for several years. You’ve already contributed the maximum to tax-deferred accounts like IRAs or 401(k)s. You’d also like to trade funds without generating taxable gains. Consider a deferred variable annuity. You invest in a mix of stock, bond or balanced mutual funds. The money resides in a “separate account” (outside the insurer’s general account) with your name on it. The mutual funds can gain or lose value, so you have a risk of loss. Only advisers with security licenses can sell this product.

Using options (with zero risk of loss). What if you’re unsatisfied with fixed annuity yields but don’t want to take the risks associated with mutual funds. You might compromise by purchasing a fixed indexed annuity (FIA). You hand your $100k over to a life insurance company. The insurer puts your money into its general fund, where it will earn about 4% per year. Then, instead of paying you 2.5% per year, it spends that $2,500 on options on an equity index or exchange-traded fund.

If the index goes up and the options pay off, you participate in the gain. You can’t lose money if you hold the contract until it expires at the end of a 1, 3, 5, 7 or 10-year term. You can—but aren’t certain—to gain one or two percent more than if you had bought a fixed deferred annuity. Advisers with insurance licenses can sell these contracts.

Using options (with limited risk of loss). What if you like the idea of a fixed indexed annuity but you want a chance for higher gains and you’re willing to accept a limited risk of loss? Then you’d be talking about products called structured variable annuities (aka registered index-linked annuities or RILAs). You’ll be investing in options, but this time you have a wider range of possible outcomes. You might, for instance, lose up to 10%, or you might incur the net loss beyond the first 10%, but your potential gain is higher than any FIA can offer.

Annuities that produce retirement income

Using bonds, with mortality pooling, with limited liquidity, starting now. You’re ready to retire and start living on savings. You don’t have a pension. You have Social Security but it won’t cover all your basic expenses. You’ve heard that you can’t spend more than 3% of your savings each year without a risk of running out of money before you die. You don’t have a pension, but you’re willing to buy one of your own, with part of your savings (tax-deferred or taxable). You can buy a single premium immediate annuity (SPIA). Your premium goes into the insurer’s general fund, sequestered with the money from other people your age.

In return, you receive a fixed, guaranteed monthly or quarterly income for life or for a specific period of years (perhaps as part of a bucketing or income-laddering strategy). The safe annual payout will be about 5% of your initial premium. That’s more than the safe withdrawal rate because you’ll receive a bit of the original principal, a bit of the interest on the bonds in the general funds, and a bit of the assets of other annuity owners who die before you.

Using bonds (with mortality pooling, with limited liquidity, starting some years from now). Let’s suppose that you like the product just describe, but you want to delay your first payment for several years. A deferred income annuity (DIA) will do the job. Everything works the same as the single premium immediate annuity, but your income starts years in the future.

Using mutual funds (without mortality pooling, with full liquidity). Remember the variable deferred annuity from above? Imagine that a special feature of this product allows you to switch income on, switch it off, or take as much of your money out whenever you like—but still promising you (as long as you restrain your spending) that if your own money runs out before you die, then the insurance company will continue making monthly payments to you until you die. This special feature is called a guaranteed lifetime withdrawal benefit (GLWB).

Using options, without mortality pooling, with full liquidity. Imagine the GLWB I just described, but attached to a fixed indexed annuity instead of a variable deferred annuity. Contract owners buy the contract, receive interest credits and bonuses for up to 10 years, and then start receiving a guaranteed minimum amount of monthly income for life. They never lose access to the account value as long as it’s positive.

Using bonds, with mortality pooling, with limited liquidity, starting a few years from now, for distributions of qualified money after the Required Minimum Distribution start date. Invented by the U.S. Treasury in 2014, this product resolves a technical problem for people who couldn’t buy deferred income annuities with tax-deferred money from a 401(k) or traditional IRA because it would have conflicted with their obligation to begin withdrawing money from those accounts at age 70½ (now 72). The IRS now allows taxpayers to apply 25% of their tax-deferred savings (up to $130,000) to the purchase of an income annuity whose payments begin between age 72 and age 85.

Less common annuities

Medically-underwritten or “impaired annuities”. It’s a myth that people in poor health should not buy SPIAs because they’re likely to die before they get all their money back through monthly payments. But at least one life insurer (Mutual of Omaha) will enlarge the monthly payouts from a SPIA for people in poor health. They simply revise the person’s age upward. A 65-year-old man with a heart condition might be charged the same price for the annuity as a 72-year-old man in better health.

Charitable remainder annuity trusts. These contracts are useful for retirees who want guaranteed retirement income and a tax deduction for a future contribution to charity. The donor typically pays into a charitable trust, which pays the donor a fixed income stream until he or she dies. Any money that remains in the trust at the donor’s death goes to the charity.

Secondary market annuities. When the victim of a serious accident wins a large settlement in a personal injury lawsuit, the settlement often includes an annuity that pays an income for a specific number of years. To convert the annuity to cash, the injured party might sell it, at a discount, to a settlement company. The settlement company will then sell the annuity through a broker to a member of the public who wants a specific payout at or over a specific time.

Such contracts have been controversial, because in some instances accident victims accepted less than fair compensation for their annuities. The industry has largely survived legal scrutiny, but the supply of secondary market annuities is small. What’s the attraction? Their payouts are said to be about 15% higher than the payouts of retail period-certain single premium income annuities.

Conclusion

Annuities are also accused of complexity. When they are, it’s partly because so many mathematical variables—interest rates, volatility levels, mortality rates, the number of people who keep their contracts or surrender them—enter the calculation of whatever financial outcome the life insurer has promised the purchaser.

Annuities are also accused of having high costs, and sometimes they do. That’s partly because annuities are investments with warranties—you’re paying an insurer to absorb the cost of a market crash or the risk that you’ll outlive your savings. Traditional stocks and bonds make no promises, and the owner bears both the upside and the downside risk. Annuity fees can be high when the life insurer recoups the upfront fee that it pays a broker—unless the purchaser pays the broker himself—by charging the client annual fees.

© 2020 RIJ Publishing LLC. All rights reserved.

BlackRock Makes a Bundle (with Annuities)

BlackRock, the $7.43 trillion asset manager, is bundling an optional income annuity with its LifePath target date funds (TDFs). With Brighthouse Financial and Equitable as the first annuity providers and Voya as one potential recordkeeper, it aims to offer plan sponsors a complete pension-like solution for their participants.

“We’ve brought together all the necessary players in the ecosystem to provide participants with an all-in-one solution,” a BlackRock spokesperson told RIJ this week.

The new program is called LifePath Paycheck. BlackRock, which manages $1.1 trillion in DC assets, told RIJ that it’s currently talking with specific plan sponsors about offering LifePath Paycheck to participants.

Here’s how the program will work, according to BlackRock’s website:

  • A participant in an employer-sponsored retirement plan invests in (or is defaulted into) an age-appropriate LifePath TDF, which uses the standard TDF allocation strategy of starting with a high equity allocation and gradually shifting toward 60% fixed income by the time the participant reaches age 55.
  • At age 55, part of the participant’s bond allocation begins moving into a group annuity contract (presumably underwritten by Equitable or Brighthouse). The gradual transfer process, which takes five to 10 years depending on when the employee retires, mitigates interest rate risk. Eventually it amounts to about 30% of the employee’s TDF assets.
  • When participants retire (at age 59½ or later), BlackRock makes it easy for them to use the group annuity assets to buy an individual income annuity (single or joint, life-only or cash refund) out of plan.  (BlackRock selects the allocation to each insurer, not the individual, and is expected to expand the number of insurers over time.) The employee’s remaining assets will stay in the 401(k) plan in a 50% stocks, 50% bonds LifePath PayCheck Retirement Fund. An important goal here is to retain assets that might otherwise be rolled over to a brokerage IRA.

Anne Ackerley

“We know that if we ask someone if they would like guaranteed income, they say yes. This removes the complication of having to find an insurance company, figuring how much to annuitize and when to buy,” said Anne Ackerley, head of BlackRock’s retirement group, in a release. “All of that has been decided for people.”

It was only a matter of time before new methods to turn 401(k) plan assets into lifetime income hit the market. A provision of the SECURE Act of 2018 reduced a plan sponsor’s potential liability for partnering with an annuity provider that later goes bankrupt—thus relieving one of the anxieties that prevent 401(k) plan sponsors from offering annuities as a plan option.

With LifePath Paycheck, BlackRock will serve as the fiduciary in choosing the annuity providers. There’s an in-plan group annuity inside the LifePath TDF that acts as a bridge to the individual income annuity. The individual annuity—the essential new piece—sits outside the plan as a rollover option.

BlackRock is also taking advantage of the fact that TDFs are QDIAs (qualified default investment alternatives); participants can be auto-enrolled or defaulted into TDFs—and into retirement solutions that are attached to them, such as Prudential’s IncomeFlex GLWB (guaranteed lifetime withdrawal benefit).

SponsorMatch was the seed

BlackRock was looking for a solution like Paycheck. For all its strength as an asset manager, BlackRock was at risk of being left out of the retirement income business as Boomers migrate into retirement. Its CoRI wizard, a calculator that expressed the cost of retirement income, has educational value, but is not a financial product per se.

Larry Fink

BlackRock doesn’t have a life insurance subsidiary, so it couldn’t follow the example of TDF competitors like Empower and Prudential, both of which have been able to add income-generating “guaranteed lifetime withdrawal benefits” to their TDFs. Even so, BlackRock CEO Larry Fink had tasked his executives with enhancing BlackRock’s presence into the retirement income space.

“Retirement income must be part of DC’s next evolution,” says BlackRock’s website. “Fortunately, many of the plan design tools and best practices used by today’s highly evolved DC system can help drive adoption of lifetime income solutions by giving participants a sense of ownership of their growing income stream.”

Within BlackRock’s institutional memory lay the seeds of a retirement income product. In 2008, MetLife (which spun Brighthouse Financial off as an independent company in 2017) and Barclays Global Investors (acquired by BlackRock in 2009) co-created “SponsorMatch.”

SponsorMatch involved ongoing contributions to an optional income annuity. But the two solutions are not identical. SponsorMatch segregated employee contributions and employer matching contributions, with the latter going into the income sleeve. At retirement, participants could choose whether to take the contents of the sleeve as a lump sum or an annuity.

Like SponsorMatch, Paycheck is optional. At no point does it limit participants’ access to their money or prevent them from choosing lump sum distributions at retirement. It mainly simplifies the purchase of an annuity for TDF-owning participants, and it reduces the volatility of the participant’s pre-annuity account during the period leading up to the annuity purchase.

Participants would be expected to resist a mandatory annuity, but there’s a cost to letting people keep all their options open. There’s no illiquidity premium. Annuities are able to offer guaranteed rates and protection from risk only when the life insurer can sequester your money and/or pool it with other people’s money.

With Paycheck, participants don’t appear to get an illiquidity benefit until or unless they buy an (illiquid) income annuity from Brighthouse or Equitable. It’s interesting, nonetheless, that participants pay no fee (other than the TDF fee) for Paycheck. With the competing TDF/GLWB model, the TDF provider might charge an annual GLWB fee of perhaps 0.3% of the entire TDF value, starting at age 45 or so. A participant might pay the fee for decades and never receive a tangible benefit.

The main advantage of Paycheck might be convenience. It facilitates the often-complex process of learning about, choosing and buying an income annuity. That may also be why BlackRock is touting its use of Microsoft’s multi-purpose cloud-based Azure technology as the platform for Paycheck. Azure will presumably facilitate integration with the life insurers, recordkeepers, and potentially other third-parties.

Solutions like LifePath Paycheck are likely to get the most traction at large companies. The people who allow themselves to be passively defaulted into a TDF may not be those with the biggest balances. And it will take a big TDF balance to buy a LifePath Paycheck annuity that generates more than a few hundred dollars of monthly income in retirement.

For the record

As of the end of 2019, according to BlackRock’s most recent 10-K filing, the firm reported pension plan assets of which $2.6 trillion in long-term institutional AUM (assets under management) for defined benefit and defined contribution plans and other pension plans for corporations, governments and unions.

Defined contribution represented $1.1 trillion of BlackRock’s total pension AUM. Its defined contribution channel had $16.7 billion of long-term net inflows for the year, driven by continued demand for the LifePath target-date suite. Multi-asset strategies, including the LifePath target-date suite, had net inflows of $28.8 billion.

BlackRock’s target date and target risk products grew 11% organically in 2019, with net inflows of $23.5 billion. Institutional investors represented 90% of target date and target risk AUM, with defined contribution plans representing 84% of AUM. Flows were driven by defined contribution investments in the LifePath offerings, which consist mainly of index funds.

© 2020 RIJ Publishing LLC. All rights reserved.
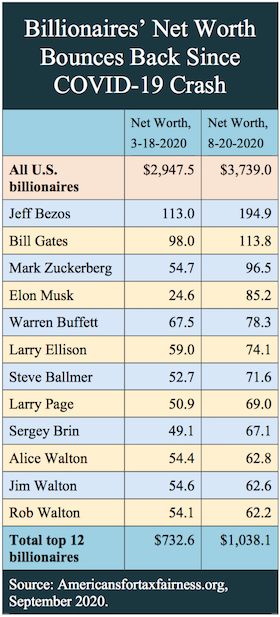
Research Roundup

For some of us, the economy is “on hold.” But many people are doubling down on work, either to respond to the COVID-19 pandemic, to help their businesses survive it, or because it offers a new opportunity to learn how (and how not) to preserve financial stability.

For weeks, studies have been gushing from the National Bureau of Economic Research and elsewhere on the economic implications of COVID-19. Economists are dissecting the virus’ impact on asset prices, employment, government policy, public sentiment and more.

Below you’ll find summaries of (and links to) seven of those publications. These papers cover the Fed’s support for the bond market, the poor design of the Paycheck Protection Program, the investment acumen of U.S. Senators, the damage experienced by the owners of America’s smallest businesses, and other topics.

“When Selling Becomes Viral: Disruptions in Debt Markets in the COVID-19 Crisis and the Fed’s Response,” by Valentin Haddad and Tyler Muir of the UCLA Anderson School of Management and Alan Moreira of the University of Rochester.

In mid-March of this year, a strange thing happened in the bond market. In defiance of economic models, the prices of ordinarily safe Treasuries, investment-grade bonds, and some bond exchange-traded funds (ETFs) suddenly dropped, creating temporary opportunities for bargain hunters but angst among Federal Reserve officials.

Given the panic over COVID-19, it made sense for stock prices to tank. But Treasury and investment-grade bonds weren’t at risk of default and the cost of insuring them never changed. In this paper, a team of three economists plumbs the mystery.

The most likely reason for the flash crash, they report, was that “some investors were particularly desperate for cash, possibly due to mounting losses, and liquidated many positions to obtain cash on short notice. These investors focused on the initially more liquid and safe securities: Treasury ETFs, investment-grade corporate bond ETFs, and the most liquid securities within each universe.”

But that didn’t explain who those nervous investors were, or why “balance sheet space suddenly became so expensive for them” (i.e., why they felt so much pressure to deleverage). Nor did it explain why deep-pocketed pension funds and insurance companies didn’t instantly step into the market and nip the sell-off in the bud.

That action fell to the Federal Reserve, which announced March 23 that it would buy the safe bonds. Turmoil in lower-rated bonds, including high-yield, was eased by the Fed’s April 9 announcement that it would increase its purchases of investment-grade debt.

Did the Fed over-react to an isolated case of mispricing? The answer is yet to be determined. “It remains unclear the ultimate goals of the Fed intervention, and whether it should have intervened,” the authors wrote. “Specifically, the rationale for the 2008 interventions—limited risk-bearing capital in the financial sector and widespread bank runs—didn’t seem present in 2020.”

Did the Paycheck Protection Program Hit the Target? by Joao Granja, Constantine Yannelis, and Eric Zwick of the University of Chicago Booth School, and Christos Makridis of the MIT Sloan School.

If the goal of the federal government’s Paycheck Protection Program was to loan operational but cash-starved companies enough liquidity to pay their workers for 10 weeks and prevent COVID-19-related layoffs or bankruptcies, its results were mixed, these professors believe.

Some 5,500 banks have so far made over 4.3 million Small Business Administration loans worth more than $513 billion. The loans will be forgiven if used for payroll and essential expenses like rent. But these researchers found that most of the money went to companies that were already good customers of banks that aggressively promoted the program, rather than to firms that needed the money most.

“PPP loans were disproportionately allocated to areas least affected by the crisis: 15% of establishments in the regions most affected by declines in hours worked and business shutdowns received PPP funding; [but] 30% of all establishments received PPP funding in the least affected regions,” the authors write.

Four banks that normally account for 36% of the small business lending business in the U.S.—JPMorgan Chase, Bank of America, Wells Fargo, and Citibank—made the largest PPP loans but, overall, disbursed less than 3% of them. The authors found that significant, and concluded overall that little effort went into directing the loans to the companies or regions that needed them most.

“How Are Small Businesses Adjusting to COVID-19? Early Evidence from a Survey,” Edward L. Glaeser, Michael Luca, and Christopher T. Stanton and Zoë B. Cullen of Harvard, Alexander W. Bartik of the University of Illinois and Marianne Bertrand of the Booth School.

You have to feel empathy for the owners, chefs, greeters, servers, busboys and dishwashers at American eateries. An academic team conducted a survey in late March of 5,800 businesses—most with fewer than 10 employees—showed that restaurants are the industry economically hardest-hit by the COVID-19 pandemic. Among their findings:

  • 55% of the businesses were still open at the end of March. Of those, the full-time employee headcount was down 17.5% and the part-time employee headcount was down 36%.
  • The banking, finance, real estate and professional services sectors generally expect to weather the crisis.
  • Restaurateurs saw a 30% chance of survival if the crisis lasts four months, and a 15% chance of survival if it lasts six months. Tourism and lodging firms saw a 27% chance of surviving a six-month crisis.
  • Most of the firms surveyed were tiny; 64% had <five employees and another 18% had five to nine employees.
  • 43% of businesses were temporarily closed; businesses had on average reduced their employee counts by 40% since January.
  • The median small business has more than $10,000 in monthly expenses and less than one month of cash on hand.
  • The majority of businesses planned to seek funding through the Paycheck Protection Program (PPP) of the CARES Act. However, many expected to encounter problems accessing the aid, such as bureaucratic hassles and difficulties establishing eligibility.


“Relief Rally: Senators As Feckless As the Rest of Us at Stock Picking,” by William Belmont, Bruce Sacerdote, Ranjan Sehgal, and Ian Van Hoek, all of Dartmouth College.

Sen. Richard Burr (R-NC) resigned from the chairmanship of the Senate Intelligence Committee after he was accused of unloading shares after a briefing he attended on the looming COVID-19 in late January—in time to avoid a 35% stock market crash.

If, as Burr claims, he acted on publicly available information, then he showed himself to be a more astute investor than most of his colleagues. An examination by four Dartmouth professors of the stock-trading behavior and returns of U.S. Senators from 2012 to March 2020 indicates mediocre stock-picking skill.

“Stocks purchased by senators on average slightly underperform stocks in the same industry and size (market cap) categories by 11 basis points, 28 basis points and 17 basis points at the one, three, and six-month time horizons,” respectively, the authors said.“We find no evidence that Senators have industry specific stock picking ability related to their committee assignments.

Neither Republican nor Democratic senators are skilled at picking stocks to buy, while stocks sold by Republican senators underperform by 50 basis points over three months. Stocks sold following the January 24th COVID-19 briefing do underperform the market by a statistically significant 9 percent while stocks purchased during this period underperform by three percent.”

In April 2012, Congress passed the “Stop Trading on Congressional Knowledge Act” or the STOCK Act. It prohibits members of Congress and their staff from trading on non-public information. The Act also requires the President, Vice President, and their staffs to report trades that exceed $1,000 within 45 days of the transaction.

The bill was amended a year later and major pieces of it were reversed. But the Dartmouth researchers speculate that the Act may have significantly reduced opportunistic trading by legislators.

“How the Coronavirus Could Permanently Cut Near-Retirees’ Social Security Benefits,” by Andrew Biggs, American Enterprise Institute.

COVID-19 threatens everyone, but middle-income workers who reach age 60 this year could suffer a permanent drop in their annual retirement incomes, even if they aren’t laid off, writes economist Andrew Biggs of the American Enterprise Institute.

Social Security benefits are pegged to wage levels, and workers are especially sensitive to the average wage in the year they turn 60. If, as Biggs estimates, the U.S. wage index drops 15% this year, today’s 60-year-olds could lock in a 13% drop in their future Social Security benefits.

If Gross Domestic Product (GDP) and wages are 10% below the 2019 Trustees Report forecasts in 2021, 5% below forecasts in 2022, and return to 2019 Trustees Report projected levels by 2023, as Biggs assumes, lifetime benefits for a medium-wage earner with a life expectancy of 18 years at age 67 would fall by $70,193 in current dollars.

In the past, Biggs’ research has often focused on the benefits of indexing Social Security benefits to inflation, not wages. He’s shown, for instance, that such a change could dampen benefits enough to prevent the shortfall in Social Security funding that’s expected in 2034. In this paper, he suggests that using inflation to index benefits would eliminate the vulnerability of 60-year-olds to a drop in average wages.

“Covid-19 and the Macroeconomic Effects of Costly Disasters,” by Sydney C. Ludvigson of New York University, Sai Ma of the Federal Reserve Board, and Serena Ng of Columbia University.

Depending on which sector of the economy you’re looking at, the economic damage from the COVID-19 pandemic could last for anywhere from two months to more than a year, according to this study.“Judging by past natural disasters, COVID-19 is a multi-month shock that is not local in nature, disrupts labor market activities rather than destroys capital, and harms the social and physical well being of individuals,” they write.

“We find that the effects of the event last from two months to over a year, depending on the sector of the economy. Even a conservative calibration of a three-month, 60 standard deviation shock is forecast to lead to a cumulative loss in industrial production of 12.75% and in service sector employment of nearly 17% or 24 million jobs over a period of ten months, with increases in macro uncertainty that last five months.”

“COVID-Induced Economic Uncertainty,” by Scott R. Baker of the Kellogg School of Management at Northwestern, Nicholas Bloom of Stanford, Steven J. Davis of the Booth School of Business, and Stephen J. Terry of Boston University.

These researchers identify three indicators—stock market volatility, newspaper-based economic uncertainty, and subjective uncertainty in business expectation surveys—that provide real-time forward-looking uncertainty measures.

“We use these indicators to document and quantify the enormous increase in economic uncertainty in the past several weeks,” they write. “Our illustrative exercise implies a year-on-year contraction in U.S. real GDP of nearly 11% as of 2020 Q4, with a 90% confidence interval extending to a nearly 20% contraction. The exercise says that about 60% of the forecasted output contraction reflects a negative effect of COVID-induced uncertainty.”

© 2020 RIJ Publishing LLC. All rights reserved.
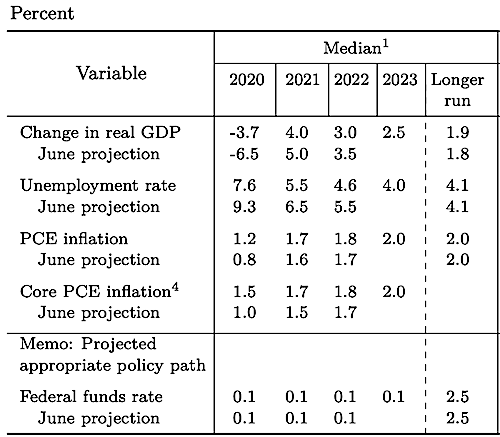
Honorable Mention

DOL allows electronic communications to plan participants

The U.S. Department of Labor (DOL) has published today a final rule that expands the ability of private sector employers to communicate retirement plan information online or by email. The rule allows employers to deliver disclosures to plan participants primarily electronically.

This action will save an estimated $3.2 billion in printing, mailing, and related plan costs over the next decade, the DOL said. The rule will also make disclosures more readily accessible and useful for participants, but preserve the rights of those who prefer paper disclosures.

On Oct. 22, 2019, the Department’s Employee Benefits Security Administration (EBSA) issued a proposed rule to allow plan administrators that satisfy certain conditions to notify retirement plan participants that required disclosures, such as a plan’s summary plan description, will be posted on a website. At the same time, participants can choose to opt out of electronic delivery or request paper copies of disclosures.

Following the Department’s proposal, plan sponsors and fiduciaries, plan service and investment providers, retirement plan and participant representatives, and other interested parties submitted several hundred written comments.

The final rule allows retirement plan administrators to furnish certain required disclosures using the proposed “notice-and-access” model. Retirement plan administrators also have the option to use email to send disclosures directly to participants. These administrators must notify plan participants about the online disclosures, provide information on how to access the disclosures, and inform participants of their rights to request paper or opt out completely. The new rule also includes additional protections for retirement savers, such as accessibility and readability standards for online disclosures and system checks for invalid electronic addresses.

The final rule furthers President Trump’s Executive Order 13847, “Strengthening Retirement Security in America,” which called on the Secretary of Labor to review actions that could be taken to make retirement plan disclosures more understandable and useful for plan participants, while also reducing the costs and burdens the disclosures impose on employers and plan administrators.

This rule also may help some employers and the retirement plan industry in their economic recovery from the disruption caused by the coronavirus pandemic. Many retirement plan representatives and their service providers, for example, have indicated that they are experiencing increased difficulties and, in some cases, a present inability to furnish ERISA disclosures in paper form. Enhanced electronic delivery offers an immediate solution to some of these problems.

Envestnet FIDx partners with RetireOne

FIDx, a product-agnostic platform that integrates the management of insurance and investment products, today announced a strategic partnership with RetireOne, the insurance and annuity back office for more than 900 registered investment advisers (RIAs) and fee-based advisors.

“The partnership supports a unified approach to connect insurance carriers, RIAs, and their existing wealth platforms. The alliance between FIDx and RetireOne will streamline the insurance experience for RIAs,” the companies said in a release this week.

The Envestnet Insurance Exchange, using FIDx technology, provides end-to-end annuity solutions, from pre- to post-issuance. RetireOne supports RIAs in planning, researching products, managing transactions post-execution, acting as agent of record, and creating necessary client reporting within the platforms they already use. This partnership with FIDx enables RetireOne to digitally access annuities through the Envestnet platform.

The Envestnet Insurance Exchange connects the brokerage, insurance, and advisory ecosystems. Together, Envestnet and FIDx have secured a strong line-up of annuity solutions from AIG Life & Retirement, Allianz Life, Brighthouse Financial, Global Atlantic Financial Group, Jackson National Life Insurance Co., Nationwide, Prudential Financial, and Transamerica. The Envestnet Insurance Exchange supports a wide range of both commission- and fee-based annuities.

Serving over 900 RIAs and fee-based advisors since 2011, Aria Retirement Solutions’ RetireOne is an independent platform for fee-based insurance solutions. With offerings from multiple “A” rated companies, RIAs may access this fiduciary marketplace at no additional cost to them or their clients.

What high-net-worth investors want: Cerulli

Asset and wealth managers currently servicing or seeking to grow their marketshare in the high-net-worth (HNW) market must be prepared to address investor needs with specific and targeted strategies that can protect client capital in increasingly volatile markets, according to The Cerulli Report – U.S. High Net Worth and Ultra High Net Worth Markets 2019.

Positioning capital preservation and tax-effective solutions will be of utmost importance for firms seeking to preserve and grow their share of market, the report said. Cerulli classifies HNW households as those with greater than $5 million in investable assets and ultra-high-net-worth (UHNW) households as those that own a minimum of $20 million.

When serving investors at the high end of the wealth spectrum, Cerulli finds that investment objectives shift away from wealth accumulation and toward preserving capital and tax efficiency. As more HNW investors re-evaluate their financial situation amidst the COVID-19 pandemic, providers must ensure that they are well aligned with their clients’ long-term objectives

More than four-fifths (83%) of HNW practices say wealth preservation is the most important investment objective when working with their clients, according to Cerulli’s research. Tax minimization (64%), wealth transfer (61%), and risk management (57%) are also rated as very important by more than half of HNW practices.

Firms need to be mindful of these underlying objectives and look to position relevant strategies that can help HNW investors minimize taxes and preserve wealth over time.

“As competition for HNW marketshare intensifies, asset managers that are able to provide relevant and timely solutions to meet the evolving needs of HNW investors will stand to benefit in the current market environment,” said Cerulli senior analyst, Asher Cheses, in a release.

Overall, HNW clients tend to be among the most sophisticated investors, and they often require a wide range of investment solutions to maintain their wealth across multiple generations. Given the complex needs of HNW clients, factors such as tax efficiency, long-term financial planning, and family governance are highly valued.

Advisors therefore need to be prepared to construct portfolios that take the appropriate risks into account and can weather the ups and downs of market cycles. “More than ever, in a period of heightened market uncertainty, wealth managers need to harness their value-added services to prove their worth and approach clients’ investment goals and priorities in a strategic manner,” Cheses said.

Lamarque promoted to general counsel at New York Life

Natalie Lamarque has been appointed New York Life’s General Counsel. She will have day-to-day oversight of the Office of the General Counsel, including the insurance and agency, investments, corporate practice, and tax teams. Lamarque will also join New York Life’s Executive Management Committee and continues to report to Chief Legal Officer Sheila Davidson.

Lamarque previously served as Deputy General Counsel, responsible for litigation and the legal responsibilities for the investment, asset management, technology and intellectual property areas. She also chaired the company’s Privacy Working Group, a multidisciplinary internal thinktank that serves as a resource for the company on matters related to privacy.

Lamarque joined New York Life in 2014 as an Associate General Counsel in the Litigation Group. She served as Chief of Staff to the Chief Legal Officer and as a member of the Corporate Compliance Department, supervising the Sales Practice Review team.

Lamarque was an Assistant United States Attorney in the Southern District of New York where she prosecuted an array of federal crimes, including racketeering, insurance fraud, money laundering, bank fraud, credit card fraud, and identity theft.

Earlier in her career, she was an Associate in the Litigation Department of Debevoise & Plimpton LLP, focusing on white-collar defense, anti-corruption, and Foreign Corrupt Practice Act investigations. Lamarque received her bachelor’s and law degree from Duke University.