For some of us, the economy is “on hold.” But many people are doubling down on work, either to respond to the COVID-19 pandemic, to help their businesses survive it, or because it offers a new opportunity to learn how (and how not) to preserve financial stability.
For weeks, studies have been gushing from the National Bureau of Economic Research and elsewhere on the economic implications of COVID-19. Economists are dissecting the virus’ impact on asset prices, employment, government policy, public sentiment and more.
Below you’ll find summaries of (and links to) seven of those publications. These papers cover the Fed’s support for the bond market, the poor design of the Paycheck Protection Program, the investment acumen of U.S. Senators, the damage experienced by the owners of America’s smallest businesses, and other topics.
“When Selling Becomes Viral: Disruptions in Debt Markets in the COVID-19 Crisis and the Fed’s Response,” by Valentin Haddad and Tyler Muir of the UCLA Anderson School of Management and Alan Moreira of the University of Rochester.
In mid-March of this year, a strange thing happened in the bond market. In defiance of economic models, the prices of ordinarily safe Treasuries, investment-grade bonds, and some bond exchange-traded funds (ETFs) suddenly dropped, creating temporary opportunities for bargain hunters but angst among Federal Reserve officials.
Given the panic over COVID-19, it made sense for stock prices to tank. But Treasury and investment-grade bonds weren’t at risk of default and the cost of insuring them never changed. In this paper, a team of three economists plumbs the mystery.
The most likely reason for the flash crash, they report, was that “some investors were particularly desperate for cash, possibly due to mounting losses, and liquidated many positions to obtain cash on short notice. These investors focused on the initially more liquid and safe securities: Treasury ETFs, investment-grade corporate bond ETFs, and the most liquid securities within each universe.”
But that didn’t explain who those nervous investors were, or why “balance sheet space suddenly became so expensive for them” (i.e., why they felt so much pressure to deleverage). Nor did it explain why deep-pocketed pension funds and insurance companies didn’t instantly step into the market and nip the sell-off in the bud.
That action fell to the Federal Reserve, which announced March 23 that it would buy the safe bonds. Turmoil in lower-rated bonds, including high-yield, was eased by the Fed’s April 9 announcement that it would increase its purchases of investment-grade debt.
Did the Fed over-react to an isolated case of mispricing? The answer is yet to be determined. “It remains unclear the ultimate goals of the Fed intervention, and whether it should have intervened,” the authors wrote. “Specifically, the rationale for the 2008 interventions—limited risk-bearing capital in the financial sector and widespread bank runs—didn’t seem present in 2020.”
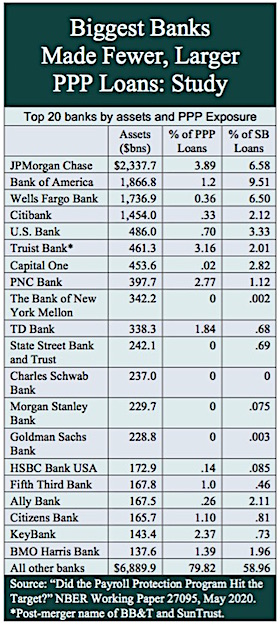
“Did the Paycheck Protection Program Hit the Target?” by Joao Granja, Constantine Yannelis, and Eric Zwick of the University of Chicago Booth School, and Christos Makridis of the MIT Sloan School.
If the goal of the federal government’s Paycheck Protection Program was to loan operational but cash-starved companies enough liquidity to pay their workers for 10 weeks and prevent COVID-19-related layoffs or bankruptcies, its results were mixed, these professors believe.
Some 5,500 banks have so far made over 4.3 million Small Business Administration loans worth more than $513 billion. The loans will be forgiven if used for payroll and essential expenses like rent. But these researchers found that most of the money went to companies that were already good customers of banks that aggressively promoted the program, rather than to firms that needed the money most.
“PPP loans were disproportionately allocated to areas least affected by the crisis: 15% of establishments in the regions most affected by declines in hours worked and business shutdowns received PPP funding; [but] 30% of all establishments received PPP funding in the least affected regions,” the authors write.
Four banks that normally account for 36% of the small business lending business in the U.S.—JPMorgan Chase, Bank of America, Wells Fargo, and Citibank—made the largest PPP loans but, overall, disbursed less than 3% of them. The authors found that significant, and concluded overall that little effort went into directing the loans to the companies or regions that needed them most.
“How Are Small Businesses Adjusting to COVID-19? Early Evidence from a Survey,” Edward L. Glaeser, Michael Luca, and Christopher T. Stanton and Zoë B. Cullen of Harvard, Alexander W. Bartik of the University of Illinois and Marianne Bertrand of the Booth School.
You have to feel empathy for the owners, chefs, greeters, servers, busboys and dishwashers at American eateries. An academic team conducted a survey in late March of 5,800 businesses—most with fewer than 10 employees—showed that restaurants are the industry economically hardest-hit by the COVID-19 pandemic. Among their findings:
- 55% of the businesses were still open at the end of March. Of those, the full-time employee headcount was down 17.5% and the part-time employee headcount was down 36%.
- The banking, finance, real estate and professional services sectors generally expect to weather the crisis.
- Restaurateurs saw a 30% chance of survival if the crisis lasts four months, and a 15% chance of survival if it lasts six months. Tourism and lodging firms saw a 27% chance of surviving a six-month crisis.
- Most of the firms surveyed were tiny; 64% had <five employees and another 18% had five to nine employees.
- 43% of businesses were temporarily closed; businesses had on average reduced their employee counts by 40% since January.
- The median small business has more than $10,000 in monthly expenses and less than one month of cash on hand.
- The majority of businesses planned to seek funding through the Paycheck Protection Program (PPP) of the CARES Act. However, many expected to encounter problems accessing the aid, such as bureaucratic hassles and difficulties establishing eligibility.
“Relief Rally: Senators As Feckless As the Rest of Us at Stock Picking,” by William Belmont, Bruce Sacerdote, Ranjan Sehgal, and Ian Van Hoek, all of Dartmouth College.
Sen. Richard Burr (R-NC) resigned from the chairmanship of the Senate Intelligence Committee after he was accused of unloading shares after a briefing he attended on the looming COVID-19 in late January—in time to avoid a 35% stock market crash.
If, as Burr claims, he acted on publicly available information, then he showed himself to be a more astute investor than most of his colleagues. An examination by four Dartmouth professors of the stock-trading behavior and returns of U.S. Senators from 2012 to March 2020 indicates mediocre stock-picking skill.
“Stocks purchased by senators on average slightly underperform stocks in the same industry and size (market cap) categories by 11 basis points, 28 basis points and 17 basis points at the one, three, and six-month time horizons,” respectively, the authors said.“We find no evidence that Senators have industry specific stock picking ability related to their committee assignments.
Neither Republican nor Democratic senators are skilled at picking stocks to buy, while stocks sold by Republican senators underperform by 50 basis points over three months. Stocks sold following the January 24th COVID-19 briefing do underperform the market by a statistically significant 9 percent while stocks purchased during this period underperform by three percent.”
In April 2012, Congress passed the “Stop Trading on Congressional Knowledge Act” or the STOCK Act. It prohibits members of Congress and their staff from trading on non-public information. The Act also requires the President, Vice President, and their staffs to report trades that exceed $1,000 within 45 days of the transaction.
The bill was amended a year later and major pieces of it were reversed. But the Dartmouth researchers speculate that the Act may have significantly reduced opportunistic trading by legislators.
“How the Coronavirus Could Permanently Cut Near-Retirees’ Social Security Benefits,” by Andrew Biggs, American Enterprise Institute.
COVID-19 threatens everyone, but middle-income workers who reach age 60 this year could suffer a permanent drop in their annual retirement incomes, even if they aren’t laid off, writes economist Andrew Biggs of the American Enterprise Institute.
Social Security benefits are pegged to wage levels, and workers are especially sensitive to the average wage in the year they turn 60. If, as Biggs estimates, the U.S. wage index drops 15% this year, today’s 60-year-olds could lock in a 13% drop in their future Social Security benefits.
If Gross Domestic Product (GDP) and wages are 10% below the 2019 Trustees Report forecasts in 2021, 5% below forecasts in 2022, and return to 2019 Trustees Report projected levels by 2023, as Biggs assumes, lifetime benefits for a medium-wage earner with a life expectancy of 18 years at age 67 would fall by $70,193 in current dollars.
In the past, Biggs’ research has often focused on the benefits of indexing Social Security benefits to inflation, not wages. He’s shown, for instance, that such a change could dampen benefits enough to prevent the shortfall in Social Security funding that’s expected in 2034. In this paper, he suggests that using inflation to index benefits would eliminate the vulnerability of 60-year-olds to a drop in average wages.
“Covid-19 and the Macroeconomic Effects of Costly Disasters,” by Sydney C. Ludvigson of New York University, Sai Ma of the Federal Reserve Board, and Serena Ng of Columbia University.
Depending on which sector of the economy you’re looking at, the economic damage from the COVID-19 pandemic could last for anywhere from two months to more than a year, according to this study.“Judging by past natural disasters, COVID-19 is a multi-month shock that is not local in nature, disrupts labor market activities rather than destroys capital, and harms the social and physical well being of individuals,” they write.
“We find that the effects of the event last from two months to over a year, depending on the sector of the economy. Even a conservative calibration of a three-month, 60 standard deviation shock is forecast to lead to a cumulative loss in industrial production of 12.75% and in service sector employment of nearly 17% or 24 million jobs over a period of ten months, with increases in macro uncertainty that last five months.”
“COVID-Induced Economic Uncertainty,” by Scott R. Baker of the Kellogg School of Management at Northwestern, Nicholas Bloom of Stanford, Steven J. Davis of the Booth School of Business, and Stephen J. Terry of Boston University.
These researchers identify three indicators—stock market volatility, newspaper-based economic uncertainty, and subjective uncertainty in business expectation surveys—that provide real-time forward-looking uncertainty measures.
“We use these indicators to document and quantify the enormous increase in economic uncertainty in the past several weeks,” they write. “Our illustrative exercise implies a year-on-year contraction in U.S. real GDP of nearly 11% as of 2020 Q4, with a 90% confidence interval extending to a nearly 20% contraction. The exercise says that about 60% of the forecasted output contraction reflects a negative effect of COVID-induced uncertainty.”
© 2020 RIJ Publishing LLC. All rights reserved.