Archives: Articles

IssueM Articles

Life Insurance in a Bucketed Income Plan

When a spouse dies during retirement, the loss deprives the widow or widower of love, support and companionship. It also deprives the the survivor of a second Social Security payment and sometimes part of a pension, shrinking the survivor’s income.

Advisers who work with older couples, especially couples who expect to rely heavily on Social Security and pensions for retirement income, are in a position to help them anticipate this risk and prepare for it.

At Wealth2k’s IFLM 2019 conference in Boston last month, Zach Parker, vice president of wealth management and product strategy at Securities America, the 2,500-adviser brokerage and advisory firm, presented a work-in-progress retirement income plan for just such a couple, using the IFLM (Income for Life Model) “bucketing” software.

Parker

The bucketing or “time-segmentation” method involves dividing a client’s retirement into periods of five to 10 years each. Monthly income during each segment is funded by a designated bucket of assets, which is liquidated and invested in short-term securities when its segment starts.

Academics sometimes describe bucketing as a “mental accounting” gimmick that requires frequent revisions and creates timing problems. That is, as clients age from segment to the next, like canal boats moving up a series of locks, the transitions won’t necessarily align with market conditions.  But advisers who use bucketing say that it can make the future seem less uncertain and less daunting, especially for “constrained” retirees who are at risk of running short of income.

Herb and Gigi

Parker’s case study was based on a real couple, both 60 years old, whom he calls “Herb and Gigi Hancock.” The Hancocks have saved $401,000, of which $340,000 is in qualified or pre-tax accounts. Herb was recently laid off from his job of many years. Gigi expects to work part-time for five more years.

The Hancocks’ guaranteed income sources in retirement include Herb’s pension of $3,102, his Social Security ($2,150 at age 65), Gigi’s Social Security ($1,200 at age 65). Gigi expects her job to net about $1,000 a month.

The Hancocks tell their adviser that they’ll need a gross real income of $6,200 each month to cover their essential expenses in retirement. They also aspire to leave a $600,000 legacy to their 32-year-old daughter.

Gigi and Herb are young enough to work for a few more years and delay claiming Social Security. They could also mobilize the equity in their home. But they ask their adviser for a plan under which Herb could retire right away, allow Gigi to retire in five years, and that wouldn’t dip into their home equity.

At first glance, barring catastrophe, the Hancocks’ vision of a secure retirement looks achievable. Over the first five years of retirement, their income from earnings and pension will be about $4,200, plus income from spending the $96,000 in their first bucket. Starting in the sixth year, they will receive $3,350 from their combined Social Security benefits plus Herb’s pension plus income from the investments in the second bucket. And so forth.

Their adviser uses IFLM software to create a preliminary plan that assigns their savings to six five-year buckets plus a seventh, legacy bucket. The segments look like this:

How does this compare to a 4%, inflation-adjusted withdrawal from a $401,000 total-return balanced mutual fund portfolio. Four percent times $401,000 is about $16,000 or $1,333 per month. If they don’t touch the $60,000 in the legacy fund, they would have an investment base of $340,000, yielding $13,600 per year or $1,133 per month. So the 4% method may not be attractive for this couple, especially if it require austerity measures during market downturns.

Mind the gap

But retirement is predictably unpredictable. The adviser alerts the Hancocks to the possibility that Herb might very well predecease Gigi during retirement. Since the survivor’s benefit of Herb’s pension is 50%, Gigi’s benefit would be only $1,551. Gigi would also lose her Social Security benefit when she stepped up to Herb’s. So her monthly income from guaranteed sources would shrink by about 43%.

How can the Hancocks deal with that possible shortfall? In Parker’s retelling of the case, the adviser at first suggests that the Hancocks buy $500,000 worth of life insurance on Herb. If Herb dies very early in retirement, for instance, Gigi would have $900,000 in savings to generate income in addition to her Social Security widow’s benefit and half of Herb’s pension.

Herb objected to that specific proposal, Parker said. He notes that if he lives to a ripe old age, then life insurance premiums will simply reduce the couple’s disposable income in retirement. The adviser then looks for a compromise between those two choices, and recommends the purchase of $267,000 worth of life insurance coverage.

Since the longer Herb lives, the less Gigi will need to make up her loss of his benefits, the adviser suggests a “staged term insurance/guaranteed universal life strategy.” It would give Gigi a benefit of $275,000 if Herb died during the next 20 years (based on the purchase of $150,000 worth of guaranteed universal life insurance and $125,000 worth of renewable term life on Herb for 20 years), after which the benefit would drop to $150,000. Parker estimated the cost of the insurance at about $400 per month.

Unknown unknowns

Retirement income planners often recommend life insurance for wealthy retirees as an estate-planning and tax-planning tool. But in the Hancocks’ case demonstrates a potential use for life insurance in a mass-affluent retiree’s income plan.

Before completing their plan, the Hancocks will inevitably need to contemplate more tactics and more risks. For example, they may decide to take more investment risk, mobilize their home equity as a first or last resort, reduce their legacy goal, or buy long-term care insurance.

In the income planning process, retirees must prepare for the expected and the unexpected—the “known knowns, the known unknowns, and the unknown unknowns,” as a former U.S. defense official famously said. Whatever a retiree’s initial plan might be, advisers know that it will need to be adjusted, perhaps many times. That’s what makes retirement income planning complex, challenging, and essential.

You can find previous case studies in this series here and here.

© 2019 RIJ Publishing LLC. All rights reserved.

TD Ameritrade to sell its first indexed annuity, a Pacific Life contract

Pacific Index Foundation, a deferred fixed indexed annuity, is now available to TD Ameritrade clients. Although TD Ameritrade has offered fixed and fee-based variable annuities to clients since 2012, and Pacific Index Foundation is the first fixed indexed annuity to be offered on the platform.

Clients of TD Ameritrade can purchase a Pacific Index Foundation annuity directly from TD Ameritrade’s annuity specialists.

Pacific Index Foundation also offers a choice of two optional benefits for an additional cost: one for guaranteed lifetime income and the other for enhancing the financial legacy that clients leave to beneficiaries.

TD Ameritrade and Pacific Life are separate, unaffiliated firms. Annuities are provided to TD Ameritrade clients through The Insurance Agency of TD Ameritrade, LLC.

© 2019 RIJ Publishing LLC. All rights reserved.

Multi-Trillion Dollar Fiscal and Monetary Gambles

Under pressure from President Trump and worried about a worldwide economic slowdown, the Federal Reserve recently cut short-term interest rates. By continuing to push rates down, the Fed may be doubling down on a $25 trillion gamble with future costs yet to be covered.

At the same time, the Trump Administration reportedly is considering tax cuts—that would add the deficit—to boost the economy in the short term. It too may be making another giant bet, with interest and debt repayments to be made by future taxpayers.

To understand why, keep in mind that what matters when government tries to spur economic growth is not the current rate of change in fiscal or monetary policy, but the change in the rate of change.

For instance, the short-term economy grows (all else equal) when the Fed accelerates the pace of growth in the money supply or when Congress increases Treasury’s rate of borrowing by cutting taxes or increasing spending. Acceleration spurs growth, deceleration dampens it.

Suppose federal borrowing rises to 4% of national output. In a steady economy, merely keeping borrowing at 4% in future years adds no new stimulus. But raising the deficit to 5% of GDP, or more than $1 trillion today, would stimulate growth through a larger budget deficit relative to the size of the economy.

To keep the wheel spinning, Congress needs to borrow ever-greater amounts—increasing the rate of change in debt accumulation. In an actual downturn, that additional borrowing would be on top of the old rate of borrowing plus the new borrowing forced by the decline in revenues—which is why many economists fear that each new fiscal gamble in good times increasingly deters future fiscal responses to a recession.

The same goes for monetary policy. Though not the only factor involved, the extraordinarily low short-term interest rates the Fed has maintained over recent years has helped promote an increase in the rate of wealth accumulation. The measured wealth of households rose from a long-term average of less than 4 times GDP to well over 5 times GDP. While that ratio fell closer to its historical level in the Great Recession, it has since risen to an all-time high. That’s about a $25 trillion increase that, if history is a guide, could become a $25 trillion loss if the ratio of wealth relative to income merely reverts to its average.

All those additional budget deficits and increases in household wealth, in turn, spur consumption. For instance, a recent NBER working paper by Gabriel Chodorow-Reich, Plament T. Nenov, and Alp Simsek suggests that a $1 increase in corporate stock wealth increases annual consumer spending by 2.8 cents. Building on that estimate, conservatively suppose each dollar increase in all types of wealth boosts annual consumption by about 2 cents. That would mean that a $25 trillion wealth bubble would spur this year’s consumption by about $500 billion, or about 2.5%age points of GDP more than had wealth simply grown with income.

What do you do if you’re Congress and an economy operating at full employment starts to slow down a bit? To spur the economy, you need to increase budget deficits at an even faster rate than before. If you’re the Fed thinking about sustaining or increasing consumption based on the wealth effect, then you try to maintain or increase the wealth bubble by not allowing housing or stock prices to fall.

How does this end? Science tells us: Not well. For instance, imagine an insect species identifies a new food source. The insect population will multiply rapidly until the demand from its accelerating birth rate outstrips the supply of food and the insect population crashes.

The economist Herb Stein described this phenomenon as simply and clearly as possible: “If something cannot go on forever it will stop.”

Our fiscal situation may not be that dramatic, but large budget deficits can lead to economic stress, and eventually, a crash. That has been the fear historically, though the recent experience of easy money across the globe, very low interest rates, and associated wealth bubbles may have offered a reprieve of sorts. However, interest rates that turn negative on an after-inflation, after-tax basis can lead to unproductive investments, which, in turn, can slow real economic growth even without a crash.

The modern economy may protect us in some ways. For example, the flow of international trade may mitigate economic slowdowns in any one region. And a service economy may not face some of the tougher business cycles that threaten an industrial one. But none of these factors overcomes Stein’s Law: Fiscal and monetary policy cannot always operate on an accelerating basis. To maintain the flexibility to accelerate sometimes, they must decelerate at other times.

Right now, we’re living with a $25 trillion wealth gamble by the Fed and trillion-dollar deficit bets by the Congress and the President. We’ve yet to see how it all ends and how the bills will be paid. How safe do you feel that your winnings will cover your share of those bills?

© 2019 The Urban Institute.

The Seeds of Inflation are Beginning to Sprout

The biggest surprise in recent years is that inflation has not begun to climb. The labor market has been at full employment for a while, we have seen upward pressure on wages, but inflation has remained dormant.

It is important to understand why that has happened. But that is history and, at long last, inflation is on the rise. How much might inflation accelerate in the next year? When might the Fed decide to reverse course and start raising short-term interest rates? No one is talking about that possibility.

Serious upward pressure on the inflation rate will originate from the labor market. Why? Because labor costs represent about two-thirds of a firm’s overall cost. If labor costs begin to climb firms will eventually be forced to raise prices to counter the negative impact on earnings. That process begins once the economy reaches “full employment.”

At that level every qualified worker who wants a job already has one. Fed officials peg that rate at about 4.2%. The unemployment rate has been below that “full employment” threshold since October 2017 and. as a result, worker compensation has begun to climb.

The indicator of wage pressures most people cite is average hourly earnings because it is readily available and can be observed monthly as part of the employment report. That measure of wages began to rise noticeably in mid-2015.

A broader and better measure of hourly compensation is included in the productivity report which is released quarterly. This measure of hourly compensation has also begun to accelerate and in the past four quarters has risen at a steamy 4.4% pace.

But we are still missing one final piece of the puzzle—worker productivity. If firms pay workers 3.0% higher wages and the workers are 3.0% more productive, firms don’t care. They are getting 3.0% more output and, therefore, they have no incentive to raise prices. But if they pay 3.0% higher wages and their workers are no more productive, then labor costs have clearly risen and they are likely to pass them through to their customers in the form of higher prices.

Focusing on any measure of hourly compensation is misguided. People should be looking at the increase in labor costs adjusted for the change in productivity, which economists call unit labor costs. This concept is the best gauge of upward pressure on the inflation rate caused by tightness in the labor market.

In the past year hourly compensation has risen 4.4%. Productivity has risen 1.8%. The difference between those two numbers is the increase in unit labor costs, which has climbed 2.6%. In mid-2016 ULC’s were climbing at an 0.8% pace which was far below the Fed’s 2.0% inflation target. The alleged tightness in the labor market was not generating any upward pressure on the inflation rate.

Since then ULC’s have begun to accelerate and the current 2.6% pace is higher than the Fed’s 2.0% target. For the first time, the well-documented labor shortage is putting upward pressure on inflation.

So what should we expect going forward? Labor costs are unlikely to rise less than the 4.4% increase registered in recent quarters. That is particularly true now since unions (as evidenced by the current UAW strike) and other workers are starting to exercise their power and demand higher wages.

If employers do not accede to those demands workers could easily jump ship to another employer who, facing a similar labor shortage, may be willing to better compensate them. We will take a stab that hourly compensation next year climbs 4.6%. Productivity growth is unlikely to keep pace.

Trump’s inconsistent trade policies and persistent badgering of Fed Chair Powell and his colleagues has undermined business confidence. As a result, investment spending has slowed considerably in the past several quarters which suggests that productivity growth next year might not accelerate further (as we had expected earlier) but remain at about 1.7%.

A 4.6% increase in compensation combined with a 1.7% increase in productivity implies an increase in unit labor costs of 2.9% in 2020.  hat is significantly higher than the 1.6% increase registered in the past 12 months and also significantly above the Fed’s 2.0% inflation target.

In fact, inflation could be almost as far above the Fed’s target by the end of next year as it was below target for the past several years.

© 2019 Numbernomics.

Life insurers fined over annuity exchanges

Six life insurance companies have agreed to pay New York $1.8 million to settle allegations that they conducted deferred to immediate annuity replacement transactions that violated state regulations, FA-mag.com reported this week.

“These six carriers failed to properly disclose to consumers income comparisons and suitability information, causing consumers to exchange more financially favorable deferred annuities with immediate annuities,” the New York Department of Financial Services said in a press release.

The annuity replacement transactions resulted in less income for consumers for identical or substantially similar options, the department added.

Last year DFS issued a regulation that ensures recommendations related to life insurance and annuities are in the best interest of the consumer and appropriately address the insurance needs and financial objectives of the consumer at the time of the transaction.

These are the insurance companies that were cited for the violations, followed by the consumer restitution and penalty, respectively, that they agreed to pay:

  • Companion Life Insurance Co., $462,122, $186,000
  • Guardian Insurance & Annuity Company Inc., $218,589, $224,000
  • Northwestern Mutual Life Insurance Co., $31,937, $26,000
  • The Penn Mutual Life Insurance Co., $322,584, $133,000
  • The Prudential Insurance Company of America, $14,020, $35,000
  • The U.S. Life Insurance Company in New York City, $102,902, $69,000

The insurers will collectively pay $1.15 million in restitution and $673,000 in penalties, the department said.

As part of the agreements, the department said, many state consumers will receive additional restitution in the form of higher monthly payout amounts for the remainder of their contract terms. “The insurers have agreed to take corrective actions, including revising their disclosure statements to include side-by-side monthly income comparison information and revising their disclosure, suitability, and training procedures to comply with regulations,” the press release said.

The settlements are part of an ongoing, industry-wide investigation into immediate annuity replacement practices in the state, the department said.

© 2019 RIJ Publishing LLC. All rights reserved.

Honorable Mention

Retirement assets total $29.8 trillion in 2Q2019: ICI

Total US retirement assets were $29.8 trillion as of June 30, 2019, up 2.3% from March 31, 2019. Retirement assets accounted for 33% of all household financial assets in the United States at the end of June 2019.

Assets in individual retirement accounts (IRAs) totaled $9.7 trillion at the end of the second quarter of 2019, an increase of 2.9 percent from the end of the first quarter of 2019. Defined contribution (DC) plan assets were $8.4 trillion at the end of the second quarter, up 2.6% from March 31, 2019.

Government defined benefit (DB) plans— including federal, state, and local government plans—held $6.2 trillion in assets as of the end of June 2019, a 0.7 percent increase from the end of March 2019. Private sector DB plans held $3.2 trillion in assets at the end of the second quarter of 2019, and annuity reserves outside of retirement accounts accounted for another $2.2 trillion.

Defined Contribution Plans

Americans held $8.4 trillion in all employer-based DC retirement plans on June 30, 2019, of which $5.8 trillion was held in 401(k) plans. In addition to 401(k) plans, at the end of the second quarter, $545 billion was held in other private-sector DC plans, $1.1 trillion in 403(b) plans, $339 billion in 457 plans, and $617 billion in the Federal Employees Retirement System’s Thrift Savings Plan (TSP). Mutual funds managed $3.8 trillion, or 65%, of assets held in 401(k) plans at the end of June 2019. With $2.2 trillion, equity funds were the most common type of funds held in 401(k) plans, followed by $1.1 trillion in hybrid funds, which include target date funds.

Individual Retirement Accounts

IRAs held $9.7 trillion in assets at the end of the second quarter of 2019. Forty-six percent of IRA assets, or $4.5 trillion, was invested in mutual funds. With $2.5 trillion, equity funds were the most common type of funds held in IRAs, followed by $952 billion in hybrid funds.

As of June 30, 2019, target date mutual fund assets totaled $1.3 trillion, up 4.1% from the end of March 2019. Retirement accounts held the bulk (87%) of target date mutual fund assets, with 68% held through DC plans and 19% held through IRAs.

T. Rowe Price model portfolios offered on Envestnet platform

T. Rowe Price Group, Inc. announced today that its T. Rowe Price Target Allocation Active Series Model Portfolios will now be available to financial advisors through the Envestnet Fund Strategist Portfolio (FSP) and Unified Managed Account (UMA) Programs.

The Target Allocation Active Series on the Envestnet platform consists of seven risk-based asset allocation models designed to meet a wide range of investment objectives. The model portfolios use T. Rowe Price equity and fixed income mutual funds as their underlying investments. The series will be available to advisors and companies leveraging Envestnet’s wealth management platform.

The Target Allocation Active Series is managed by T. Rowe Price Portfolio Managers Charles Shriver, Toby Thompson, Robert Panariello, Guido Stubenrauch, and Andrew Jacobs van Merlen. Each portfolio manager is a member of the T. Rowe Price Multi-Asset team, which had $332.5 billion in assets under management as of June 30, 2019.

27% of Americans very confident about retirement: TIAA

TIAA’s 2019 Lifetime Income Survey found that various uncertainties are key detractors of financial confidence among Americans– with just three-in-ten respondents saying they are very confident they will always feel financially secure, including during retirement.

Only a little more than one-in-three (35%) are very confident they will be able to maintain their lifestyle as long as they live. Uncertainty about the future of social programs and market performance, concerns about unexpected expenses and investment losses, and fear of saving too little are all major detractors of confidence.

The survey showed a number of skills and practices that build confidence. For example, the ability to plan long-term and invest effectively are key drivers of feeling secure. Those who rate highly their ability to invest effectively are roughly three times as likely to express confidence in always being financially secure, including throughout retirement. Long-term planning can also play a role in financial confidence, as those who are able to master this skill are at least twice as likely to feel confident.

U.S. ranks 18th in retirement security

The United States dropped two spots to No. 18 among developed nations on the 2019 Global Retirement Index, released this week by Natixis Investment Managers. The annual index found the U.S. ranked the same or lower in all four sub-indices:

  • Health
  • Material well-being
  • Finances
  • Quality of life

Three global risks to long-term sustainability weigh on retirees and policymakers—low interest rates, longer lifespans and the costs of global warming.

The Seventh Annual Natixis Global Retirement Index examines 18 factors that influence retiree welfare, producing a composite score for evaluating comparative retirement security worldwide.

Highlights of the 2019 Global Retirement Index include:

Factors affecting the US GRI ranking

For all four sub-indices, the US ranked the same or lower in this year’s Index compared to last year, including Material Wellbeing (28th from 26th), Finances (10th from 9th), Quality of Life (20th from 19th) and Health (held steady in 10th place). The following are notable factors affecting the US position:

Growing pressure on government resources

The US lost ground in the Finances category, but remains in the top 10. The Index reflects an increasing proportion of retirees to working adults, an ongoing trend that is putting growing pressure on Social Security and Medicare funds.

Rising government debt and tax pressures also contributed to the US’s lower score in the Finances category, which was offset by improvement in interest rates and fewer nonperforming bank loans.

Economic inequality widens

Despite rising employment, the gap between wealthy and poor continues to grow. The US has the eighth-worst score for income equality, even though it has the sixth-highest income per capita score among all GRI countries. These factors generated a lower score for the US in the Material Wellbeing category.

Lower life expectancy despite health spend

The US maintains its position in the top 10 (at 10th) for health due to an improvement in insured health expenditure, which measures the portion of that expenditure paid for by insurance, and by maintaining the highest score globally for per capita health spending. But the US experienced a decline in life expectancy as Americans’ longevity failed to keep pace with that of top-ranked Japan and other nations.

Quality of life in relation to retirement security

A lower score for happiness, which evaluates the quality of retirees’ current lives, weighed on the US’s Quality of Life performance. However, the US continues to achieve the seventh-highest score for air quality on the Index and it showed improvement in its environmental factors indicator score, though not enough to lift it out of the bottom 10 in that category.

Western Europe continues to lead as a region, with 15 countries finishing in the top 25 for the third year in a row. The Nordic countries maintain their strong performance in the top 10, including

Iceland (No. 1)

Norway (No. 3)

Sweden (No. 6)

Denmark (No. 7)

Ireland advanced to No. 4 from No. 14 two years ago due to an improved score in the Health sub-index, where it moves into the top 10 (from 19th), driven primarily by the country’s higher per capita health spending. The country also performed well in Finances, powered by improvements in bank nonperforming loans and government indebtedness.

Japan, which ranks No. 23, stands out for having the lowest score among GRI countries for old-age dependency, a measure of the number of active workers compared to the number of retirees. Japan has the highest life expectancy, but also one of the lowest fertility rates among developed countries.

Three pressing risks for retirement security

The Natixis report, “Global Security. Personal Risks,” supplements the 2019 Index and illustrates three pressing risks and their implications for retirees and future generations globally. The analysis serves to encourage dialogue among policymakers, employers and individuals to understand the impact and help manage the risks to society.

Interest rates: Interest rates do not appear to be rising anytime soon, and the related low yields on investments present hurdles for those looking to generate income in retirement. As a result, retirees may be forced to invest in higher-risk assets, thus exposing their portfolios to greater volatility at an age when they might not have time to recoup losses due to a market downturn. Indeed, more than four in ten Baby Boomers (aged 55–73 years old) in the US surveyed by Natixis earlier this year said they were blindsided by the market downturn in 2018.

Demographics

Longevity represents a key risk for retirees. In the US, the ratio of older adults to working-age adults is climbing. By 2020, there will be about 3.5 working-age adults for each retirement-age person; by 2060, that ratio will fall to just 2.5. This leaves policymakers with hard choices on how to address the funding crunch.

Financial and health impacts of climate change

The risk of climate change is often viewed through a long-term lens, but it poses tangible health and financial risks to today’s retirees. The costs associated with natural disasters help force up insurance rates and consume government resources. Severe events helped make 2018 the fourth-costliest year for insured losses since 1980, according to Munich Reinsurance Co. Extreme heat has increased the risk of illness among older adults, particularly those with chronic illnesses, according to the US Environmental Protection Agency.

Millennials lead emphasis on sustainable investing

The rapidly aging population in the US means a large percentage of people depend on Social Security payments at a rate that threatens the long-term sustainability of the nation’s retirement system. At the same time, younger generations are leading the charge for long-term sustainability, seeking to have a positive impact on the world and, ultimately, their retirement security.

© 2019 RIJ Publishing LLC. All rights reserved.

A VA Rider Designed for Inheritances

A new variable annuity rider from Lincoln Financial, called Wealth Pass, allows non-spouse beneficiaries of variable annuities or retirement accounts to stretch the receipt of their inheritance over their own remaining years of life expectancy, with the added assurance that, if they live that long, no less the nominal value of the original inheritance would be paid out.

Under current law, widows or widowers can assume the ownership of inherited IRAs or inherited deferred annuities, but a non-spousal beneficiary faces different options. The new Lincoln rider is designed to encourage these non-spouses to keep the assets in their inherited VA, inherited IRA, or even a non-qualified account, to buy a new Lincoln VA with the assets.

“Suppose someone put $100,000 into a variable annuity today,” Del Campbell, vice president of variable product development at Lincoln Financial, told RIJ this week. “If he or she dies in 10 years, and the death benefit is $200,000, a non-spouse beneficiary, can take the contract, add the Wealth Pass rider, and then receive $200,000 over his or her own life expectancy.

The beneficiary would actually have several options under the Wealth Pass rider. To be assured of receiving the entire (nominal) inheritance, he must take out at least his required minimum distribution (RMD) each year (as determined by IRS life expectancy tables). Alternately, he could also take out a higher percentage, up to a limit set by Lincoln.

For instance, beneficiaries who are 60 years old have a life expectancy of 25 years. They can stretch the payments over 25 years, starting with an RMD of 4% ($8,000) in the first year. In each of the next 24 years, they would receive their RMD amount, unless they choose to cash out and end the contract. Alternately, they could withdraw up to 5.5% ($11,000 in the first year) and continue withdrawing at that pace until they receive the entire $200,000.

“They would still be invested in the market, so with good performance they could get more than that,” Campbell added. “If they then died before receiving all of their payments and they still had any account value, their beneficiaries could receive their remaining payments or the account value.” If the account value is zero when the second owner dies, the contract is cancelled and no further payments are issued.

Alternately, people who inherit a $100,000 traditional IRA, for instance, could invest the assets in a new Lincoln VA, add the Wealth Pass rider, and spread their inheritance and tax liability over their life expectancies, with the assurance that the entire $100,000 would be paid out while they’re living.

A hypothetical beneficiary

A Lincoln Financial web page illustrates the tax implications of using Wealth Pass, which adds a 1% annual fee (1.25% for those ages 66 to 80) to the mortality & expense risk fees and investment fees of the assumed or new variable annuity. The illustration imagines a hypothetical investor, Cynthia, 56, who inherits an IRA worth $500,000.

If Cynthia took the $500,000 in a lump sum, she would owe income tax of $165,000 (assuming a 37% marginal tax bracket). Her after-tax inheritance would be $335,000. If she took $100,000 per year for five years, she would pay an incremental $25,000 in federal income tax per year (assuming a 32% marginal tax bracket), leaving her with an after-tax inheritance of $375,000.

But if she used the $500,000 to buy a Lincoln VA with a variable annuity with Wealth Pass, she would receive her inheritance over her life expectancy or she could take it out at 5% per year for 20 years, with a guaranteed payout of at least $25,000 per year (assuming she followed the rules of the contract), paying $5,816 per year ($116,000 total) in income taxes. This assumes no growth; with market growth her income could be higher.

(There is a limitation on the portion of the VA account value that can be held in equities. See the prospectus for further details.)

As of today, the Wealth Pass rider can be added to either a qualified or non-qualified VA contract. But pending federal legislation, known as the SECURE Act, would effectively eliminate the so-called “stretch” strategy, which allows non-spouse beneficiaries of qualified accounts, such as IRAs, to receive distributions from the qualified account over their life expectancies. The SECURE Act would mean that Wealth Pass could only be attached to non-qualified VAs.

The SECURE Act passed almost unanimously in the House last May but has been hung up in the Senate, where certain senators, including Ted Cruz (R-TX), have objected to certain provisions. The SECURE Act would eliminate the ability of a non-spouse beneficiary to take a lifetime payout in most cases, and impose a maximum deadline of 10 years to distribute the full value of the qualified account. It remains unclear whether the SECURE Act and its Senate counterpart will be reconciled, passed and signed by the president during the current session of Congress.

© 2019 RIJ Publishing LLC. All rights reserved.
Investors Flocked to Money Funds in August

The Federal Reserve’s quarter-point rate cut this week was meant to gladden Wall Street, boost the economy, and perhaps appease Donald Trump’s appetite for ideal economic numbers in advance of the gathering presidential race.

Citing uncertainties in the global economy and weakening fixed business investment and exports—factors heightened by the president’s shifting policies and provocative tweets—the Fed’s Board of Governors voted to reduce the fed funds rate to a range of 1.75% to 2%.

But, judging by investors’ sober reaction to the Fed’s last rate cut, on July 31, the latest monetary stimulus might only remind investors that the global and U.S. economies are slowing down.

According to the August Fund Flows report from Morningstar Research, investors reacted to the July 31 move by pulling a net $15.9 billion out of long-term open-end and exchange-traded funds in August.

It was the biggest outflow since the panicky stock sell-off in December 2018.

“Every major U.S. category group—except commodities—saw a decline in inflows or an increase in outflows compared with July,” Morningstar analysts wrote. “August’s long-term outflows were the greatest since December 2018, when capital markets were enduring a nasty correction.”

Instead of buying mutual funds, investors moved a net $80 billion into money market funds—even though the yields on those funds naturally went down after the Fed lowered its benchmark rate. “Money market funds have collected nearly $300 billion” for the first eight months of this year, “the greatest sum since 2009 when investors were just beginning to recover from the credit crisis,” the report said.

August also saw the value of passive U.S. equity funds surpass the value of U.S. actively managed equity funds by about $25 billion ($4.271 trillion vs. $4.246 trillion).

“This is a milestone that has been a long time coming as the trend toward low-cost fund investing has gained momentum. Active U.S. equity funds have had outflows every year since 2006, with roughly equivalent inflows into passive funds during that time,” Morningstar said.

“Over the past 10 years, active U.S. equity funds have had $1.3 trillion in outflows and their passive counterparts nearly $1.4 trillion in inflows,” the analysts wrote. “Still, 10 years ago, active U.S. equity funds had about 75% market share. And at that point we had recently entered one of the longest equity bull markets in U.S. history. If you had known this, would you have guessed that active U.S. equity funds were on track to lose $1.3 trillion to outflows?”

Despite the July 31 rate cut, taxable-bond funds had the highest inflows in August, with $16.3 billion in inflows. “This was the group’s second-lowest total of the year. Credit-oriented high-yield and bank-loan funds had about $8.9 billion in combined outflows. Municipal-bond funds’ inflows remained strong with $9.1 billion,” Morningstar said.

© 2019 RIJ Publishing LLC. All rights reserved.
Vantis Life to sell fixed annuities direct to the public

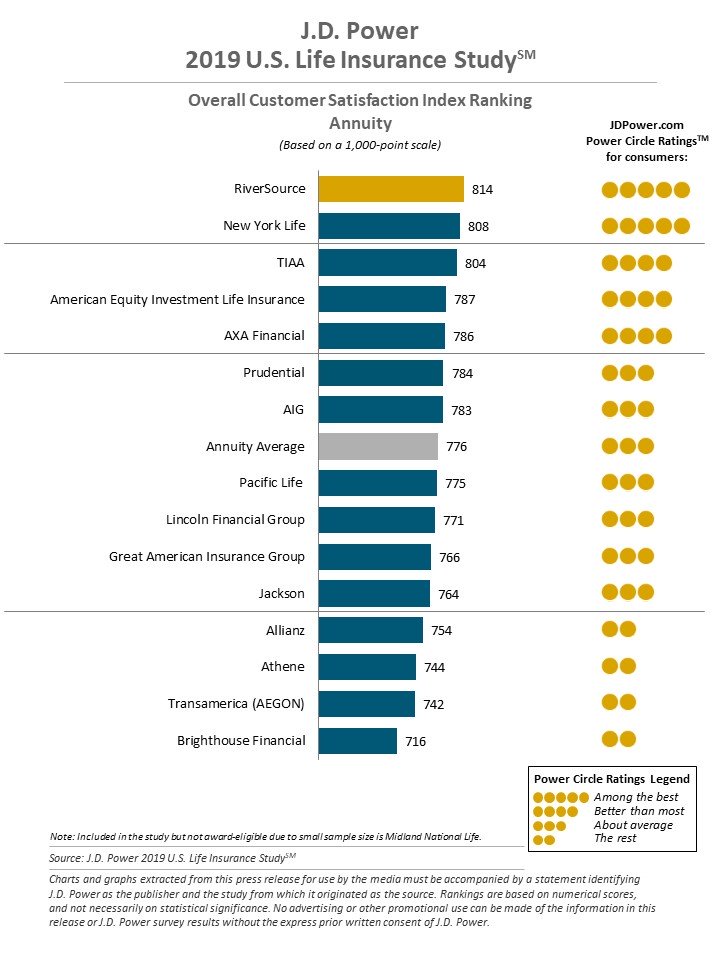
Direct-to-consumer life insurance provider Vantis Life Insurance Company, a subsidiary of The Penn Mutual Life Insurance Company, is making an existing line of fixed deferred annuities available for direct purchase online for the first time. The annuities are:

  • TaxSaver Freedom ROP. This annuity provides a fixed interest rate with the safety of a return of premium (ROP) guarantee feature. With the ROP feature, customers can withdraw assets at any time without a penalty.
  • TaxSaver Freedom MVA. This product locks in an interest rate for the duration of the term. The market value adjustment (MVA) feature can positively or negatively impact the value in the contract if funds are withdrawn prior to the end of the guarantee period.

Both products provide a five-year rate guarantee and tax-deferred accumulation of interest gains, in addition to waivers for withdrawals triggered by nursing care or terminal illness. Vantis Life is rated A+ (Superior) by A.M. Best.

© 2019 RIJ Publishing LLC. All rights reserved.

More up ratings than down among U.S. insurers: AM Best

In the first half of 2019, there were seven ratings upgrades and three downgrades in the life/annuity/health segments of the U.S. insurance industry, compared with eight upgrades and five downgrades in the first half of 2018, according to a new Best’s Special Report, “L/H Upgrades Outpace Downgrades in First-Half 2019.”

In the health segment, there were eight rating upgrades and one downgrade, compared with nine upgrades and three downgrades in first-half 2018. No upgrades or downgrades were made in the life reinsurance segment in first-half 2019, compared to one upgrade in the same prior-year period.

Despite AM Best’s revised L/A market segment outlook to stable from negative in December 2018, AM Best sees potential for a global economic slowdown, with a recession likely in 2020. That view is based on the prolonged trade/tariff war and the reduction in interest rates by the Federal Reserve this year.

The positive rating development in the L/A segment was based on factors that include improved risk-adjusted capitalization from an increase in profitability, owing to the Tax Cut and Jobs Act, as well as a modest increase in interest rates in 2018 and expense reductions.

The health segment continues to see strong operating results and positive earnings, along with favorable medical cost and growth trends, which have fostered positive rating development.

In first-half 2019, seven life/health rating units were placed under review, compared with 25 in the first-half of 2018. The high number in 2018 mainly reflected elevated merger and acquisition activity. Affirmations remained the most common rating action for the life/health industry at 79.9%, consistent with most years.

The industry has benefited from an easing in regulatory oversight, but changing fiscal and political dynamics could slow down or even reverse some of these gains. However, carriers have strengthened their risk-adjusted capitalization and enterprise-wide liquidity, which likely will mitigate the impact of investment credit and liquidity risk, which continue to rise for many carriers.

AM Best maintains a stable outlook on the U.S. health industry segment, based on positive earnings, strong results in all major lines of business, growth in capital and surplus, and a decline in near-term regulatory uncertainty. However, health insurers must remain watchful of rising cost trends and utilization.

© 2019 RIJ Publishing LLC. All rights reserved.

At the RIA Dance, Annuities Look for Partners

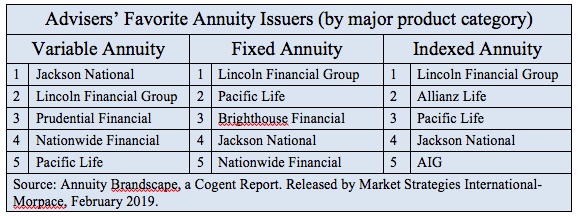
Determined to follow advisors wherever they may go, the top annuity issuers continue to develop no-commission versions of their products and make them available where fee-based advisors can see them: on the custodial or turnkey asset management platforms that RIAs (Registered Investment Advisors) use.

This week, Nationwide Advisor Solutions added an income rider for its RIA-ready NARIA variable annuity and Great American announced that Pershing’s RIA custody platform would host Great American’s fee-based Index Protector 7 indexed annuity, which also has a lifetime income benefit rider.

So far, the excitement about the potential for RIAs to recommend annuities for their retirement clients has been more visible in the annuity world than in the RIA world. But annuity issuers figure that if RIAs are fiduciaries, and their Boomer clients need sequence risk protection and longevity risk protection, then RIAs will, ipso facto, have to start using annuities.

This fall, several annuity issuers received private letter rulings from the IRS that will make it easy for RIAs to receive their asset-based fees from annuities without causing a taxable distribution.

In any case, annuity issuers must go to the RIA dance because it’s where desirable advisors and clients will be. Whether their “dance cards,” to use a quaint expression, are filled or not remains to be seen. Nationwide (since its purchase of Jefferson National’s RIA/VA business in 2017) and Great American have been among the most assertive life insurers in adapting to the evolving world of RIAs and dually-registered (RIA and broker-dealer) advisors.

Nationwide adds income rider to its no-commission variable annuity

Nationwide has launched a new lifetime income rider and two new enhancements to its stripped-down, no-commission NARIA (Nationwide Advisory Retirement Income Annuity) variable annuity for Registered Investments Advisors (RIAs) and their Investment Advisor Representatives (IARs).

“A simple, transparent, low-cost variable annuity (VA) and one of the only VAs with ‘advisory-friendly’ fee management capabilities that will not erode the client’s benefit base, NARIA can help RIAs and fee-based advisors incorporate insurance into their practice for more holistic planning,” a Nationwide Advisor Solutions release said this week.

The announcement follows the recent IRS Private Letter Ruling allowing favorable tax treatment of advisory fees from non-qualified annuities.

NARIA now offers Nationwide Lifetime Income Rider Advisory (Nationwide L.inc Advisory), an optional living benefit with a 7% (simple interest) annual increase in the benefit base (the notional sum, independent of the account value, on whose basis annual payouts are calculated) during the accumulation period. When the client’s contract returns above 7% on the rider anniversary, the contract value is the benefit base.

“Nationwide L.inc Advisory is designed to help RIAs and fee-based advisors provide a retirement income solution compatible for a shorter accumulation period, which is important during those critical years between the ages of 65 to 75, when most clients start taking retirement income and need income protection,” the release said.

NARIA can now offer unconstrained 100% equity exposure when combined with “RIDER” (Retirement Income Developer), a lower cost optional living benefit launched earlier this year. RIDER has a ratchet feature to lock in growth. It is designed for longer accumulation periods, with newly increased equity exposure.

NARIA also now offers tiered pricing for its low-cost platform funds. More than 30 funds, including investment options from DFA, DoubleLine, Vanguard and Nationwide, are now available for between 10 bps and 35 bps, on top of NARIA’s annual mortality & expense risk fee of 20 bps. NARIA offers more than 150 underlying funds from more than 25 fund families.

Great American’s fee-based FIA joins Pershing RIA platform

Index Protector 7, Great American Life Insurance Company’s fee-based fixed indexed annuity, is now available on BNY Mellon’s Pershing (“Pershing”) registered investment advisor (RIA) custody platform, the insurer announced this week.

Index Protector 7 features an optional guaranteed income rider, Income Keeper, which offers lifetime income payments that could increase each year.

Great American Life launched the industry’s first fee-based fixed-indexed annuity in 2016, and the company continues to introduce new technology solutions that make it easier for RIAs to include an annuity in a fee-based portfolio. Most recently, Great American advocated for industry change and received an IRS Private Letter Ruling that permits advisory fees to be withdrawn from Great American Life’s fee-based non-qualified annuities without creating a taxable event, as long as certain conditions are met.

Great American Life Insurance Company, a member of Great American Insurance Group, is rated “A+” by Standard & Poor’s and “A” (Excellent) by A.M. Best for financial strength and operating performance.

© 2019 RIJ Publishing LLC. All rights reserved.
Taxes in Retirement: Front-Load or Back-Load?

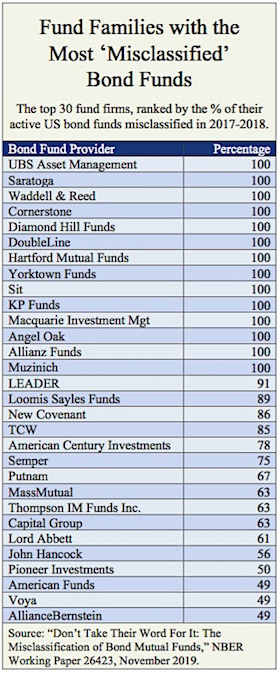
People seem to dislike taxes even more after they retire. The tax bite becomes painfully obvious when not simply withheld from a paycheck, and a required minimum distribution (RMD) often means nothing to wealthy retirees but a thankless tax bill. Taxes on Social Security benefits can feel like an unjust clawback of just deserts.

The ability to reduce a high net worth retiree’s tax burden—in the form of income tax, Medicare tax, Social Security tax, state tax, or taxes on bequests—therefore represents a rich opportunity for financial advisers to demonstrate their skills, bona fides and value.

In a presentation at Wealth2k’s IFLM 2019 adviser conference two weeks ago, Zach Parker, a vice president at Securities America demonstrated how an adviser could use the “bucketing” technique of retirement income generation to minimize federal taxes during the first 10 years of retirement for a 65-year-old couple.

In Parker’s hypothetical situation, the couple has $1 million in qualified accounts and $500,000 in non-qualified (taxable) accounts. They’ve expressed a need for $8,435 in gross real monthly income. Each will receive a Social Security of $18,000 a year, inflation adjusted, if they retire in the current year.

He offered two solutions. One of the solutions called for “back-loading” federal income taxes by minimizing them during the first ten years of retirement. That involved dipping into qualified savings as slowly as RMD obligations would permit. The second solution called for maximizing taxes in the first decade—front-loading taxes—by spending qualified assets or converting them to Roth IRAs within that period.

Back-loading federal taxes

To create the desired income for the couple during their first five years of retirement without triggering any federal tax, the hypothetical adviser recommends buying five-year period certain single premium immediate annuities (SPIAs).

In this case, the adviser uses $51,190 of the qualified money and $263,431 of the non-qualified money to purchase two single premium immediate annuities running concurrently for the first five years. The qualified SPIA will produce $10,500 in annual income, all of which will be taxable, and the non-qualified SPIA will produce $54,720 per year, of which only $2,025 will be taxable.

Using the Social Security tax formula, the adviser adds $10,500 + $2,025 + $18,000

(half the couple’s Social Security benefit). It equals $30,525, which is under the $32,000 threshold for taxing any of the Social Security benefit. Total annual income for each of the first five years will be $101,220 ($54,720 + $10,500 + $36,000). Only $12,525 will be taxable, which is under the standard deduction ($27,000) for those over age 65. The couple pays no federal taxes.

Investing for the second five-year term or “bucket,” the adviser uses income annuities again, but reverses the weight of qualified and non-qualified money in order to satisfy the couple’s RMDs. This time, $262,621 of qualified money goes to a period-certain SPIA paying $61,000 a year for five years and $68,300 goes into a deferred income annuity (DIA) for income of $16,592 per year for five years.

The annual income for the first year of the second term is $117,336 ($61,000 + $16,592 + $39,744 in Social Security). Of that amount, $70,719 is taxable. That includes $33,782 (85% of the Social Security benefit), $61,000 from the qualified annuity, and $2,937 from the non-qualified annuity—minus the $27,000 standard deduction. At current rates, the federal tax bill will be $8,098. The couple’s net income would be $109,238 ($117,336 – $8,098).

Front-loading federal taxes

The tax-delaying strategy described above would backfire, Parker pointed out, if federal income tax rates rise considerably over the next two or three decades in response to the higher national bills for Social Security and Medicare that will come with an aging society. So he proposed an alternate strategy that would frontload rather than backload the couple’s federal tax liability.

This alternative (“Option 2”) uses Roth conversions to bring taxes forward. A conversion of a traditional IRA to a Roth IRA means satisfying the tax liability on the IRA assets while allowing them to continue to grow tax-deferred.

Under this strategy, the clients fund their income for the first five years of retirement by applying $314,621 to the purchase of a period certain SPIA that would pay $65,220 a year. Simultaneously, they would convert $65,000 in qualified money to a Roth IRA. With a taxable income that high, 85% of their Social Security benefit ($30,600) would be taxed as ordinary income.

Their first-year federal tax would be $21,158 on taxable income of $133,820 ($65,220 + $65,000 + $30,600 minus $27,000 standard deduction), of which $65,000 would remain invested in the Roth IRA. Their after-tax first-year spending would be $80,062 minus the tax cost of the Roth conversion (about $10,000).

The couple would follow a similar strategy each year for each of the first ten years of retirement. Over those ten years, they would have paid about $200,000 in federal income taxes (compared with $49,000 in the tax-backloading strategy).

In the 11th year, their qualified assets would equal zero (instead of $1.235 million in the tax-backloading strategy), having either been spent as income or converted to Roth IRAs. Federal taxes after age 75 would be negligible, and beneficiaries would not receive qualified money, with its implicit tax bill.

In the second (tax-frontloading) strategy here, Parker said, one of the goals was to minimize Medicare taxes. For individuals with incomes under $170,000, the monthly Medicare premium is currently $135.50 per month. The Medicare premium rises with wealth, to a maximum of $460.50 per month for those with annual incomes of $750,000 and higher in retirement. Presumably $5,526 a year wouldn’t be onerous a premium for the rare person with a post-age-65 annual income of $750,000; that’s 4% of $18.75 million.

To download a copy of Parker’s PowerPoint slides, click here.

© 2019 RIJ Publishing LLC. All rights reserved.

Subscription-based planners sue SEC over Reg BI

XY Planning Network (XYPN) is filing a lawsuit in the Southern District of New York to challenge the Securities and Exchange Commission (SEC) over its new Regulation Best Interest (Reg BI), the co-founders of the subscription-based network of financial planners serving Gen X and Gen Y investors said in a release this week.

“Brokers and dual-registrants should not be able to use titles that connotes they are in the business of providing fiduciary advice unless they do so at all times, and that once a consumer engages a fiduciary advisor that advisor remains a fiduciary for the entirety of the advice relationship and such advisors cannot downgrade their fiduciary duty when implementing brokerage products pursuant to that fiduciary advice,” said Michael Kitces, co-founder and chief strategy officer of XYPN.

In the release, XYPN said “the SEC has exceeded its regulatory authority in the creation of Reg BI by permitting comprehensive financial planning services to be delivered in connection with the sale of brokerage products without requiring the financial planner to register as an investment adviser and/or without fully subjecting such financial planning advice itself to an RIA’s fiduciary duty.

“XYPN alleges that the SEC also exceeded its authority by reinterpreting the Investment Advisers Act of 1940, and the ‘solely incidental’ exemption for broker-dealers therein, to permit dual-registrants under Reg BI to use advisor-like titles and hold out as being in the business of providing financial planning advice while actually selling non-advisory brokerage services and products.”

The SEC’s creation of a “Best Interest” rule for broker-dealers that is not actually a full fiduciary rule… is anti-competitive to Registered Investment Advisers who differentiate in the marketplace by their actual Best Interests commitment to consumers (and are actually held to such a standard), the release said.

“With Reg BI, however, the SEC is permitting brokers and dual-registrants to provide financial planning advice, without being subject to full RIA registration and/or without being subjected to the fiduciary duty that Congress prescribed for such advice,” said XYPN’s co-founder and CEO Alan Moore, in the release.

© 2019 RIJ Publishing LLC. All rights reserved.

Pacific Life’s new 5-year VA/GMAB rider sets -10% floor

Pacific Life Insurance Company has introduced a new optional guaranteed minimum accumulation benefit (GMAB) on certain of its variable annuities that “can provide guaranteed lifetime income and unlimited growth potential,” the company said in a release.

The rider is called Protected Investment Benefit. The rider is available for the Pacific Choice and Pacific Odyssey variable annuities.

    • If the client purchases the 5-year term, the charge is 0.85% (of first year purchase payments, less pro-rata reduction for withdrawals), each year for the entire 5 years.
    • If the client purchases the 10-year term, the charge is 0.95% each year for the entire 10 years. Otherwise, conditions are the same as the 5-year term.
    • Pacific Choice is a commissionable variable annuity with a 5-year withdrawal charge schedule and has an M&E of 0.95% and an admin fee of 0.25%. It offers two enhanced optional death benefits: one for 0.20% annually and one for 0.25% annually.
    • Pacific Odyssey is a fee-based variable annuity with no withdrawal charges (completely liquid) and has an M&E of 0.15% and an admin fee of 0.15%. It offers one enhanced optional death benefit for 0.20% annually.

By the end of the five-year option, policyholders can be assured of having at least 90% of their first-year premiums. By the end of the 10-year option, they can be assured of having at least 105% of their first-year premiums. At the end of five or 10 years, as the case may be, the rider and its fee automatically expires. Pacific Life offers additional GMAB riders that protect 100% of premium but has more limited investment options.

Clients who choose either option can choose from a variety of asset allocation options with up to 80% equity exposure. According to the product fact sheet, the investments aren’t subject to volatility controls or asset-transfer programs (which might include automatic rebalancing toward bonds during equity downturns). This GMAB can be combined with other living benefits to generate lifetime income. The contract can also be converted to a life annuity.

Unlike a structured variable annuity, there’s no cap on investment returns, so their earning potential is unlimited,” said Brian Woolfolk, FSA, MAAA, senior vice president of sales and chief marketing officer for Pacific Life’s Retirement Solutions Division.

© 2019 RIJ Publishing LLC. All rights reserved.

40% of life insurers’ bank loans below investment grade: AM Best

About three-quarters of the $40.6 billion in bank loans owned by the U.S. life/annuity companies are rated below investment grade, according to a new AM Best report.

The Best’s Special Report, titled, “Bank Loans: Low Credit Quality, But Manageable Exposure,” notes that bank loans are not yet widely held throughout the industry.

Bank loan holdings totaled over $54 billion in par value for the insurance industry as of year-end 2018. Life/annuity insurers own nearly three-quarters, at 74%, with property/casualty and health insurers owning 23% and 3%, respectively.

More than 90% of bank loans in the property/casualty and health segments are below investment grade, but they are concentrated primarily with the largest holders, who generally have a strong expertise in this asset class.

Most insurers that own bank loans below investment grade have exposure of less than 10% of capital and surplus. In the life/annuity segment, the top 10 bank loan holders owned 79% of the total bank loans as of year-end 2018.

Most of these companies are large, with over $7 billion in capital and surplus, and bank loans make up just a small percentage of their bond portfolios, typically less than 4%.

Insurers use bank loans primarily for diversification, as well as for gaining floating rate exposure and additional yield. Returns from loans have been generally high due to the lower credit quality and illiquidity.

Additionally, the overwhelming majority of these loans are senior debt, indicating that nearly all of these loans are in a favorable position for repayment in the event of a default.

“However, with even marginal borrowers able to access loans in a strong economy, the risk of loan defaults will rise as the economy turns,” said Jason Hopper, an associate director on AM Best’s industry research and analytics team.

The report adds that the benefit of floating interest rates on bank loans, which somewhat protects insurers from rapidly rising interest rates, is further diminished in a continued low interest rate environment.

© 2019 RIJ Publishing LLC. All rights reserved.

Honorable Mention

Lincoln’s Fuller wins IRI award

Will Fuller, executive vice president and president of Annuities, Lincoln Financial Distributors and Lincoln Financial Network, was recognized by the Insured Retirement Institute (IRI) as the recipient of their 2019 Industry Champion of Retirement Security award.

The award recognizes the contributions of individuals to the enhancement of retirement security in the United States through advocacy, communication, education and other initiatives. Fuller is the first industry recipient of the annual award.

Fuller “has been an industry advocate for best interest regulation, with agencies including the Department of Labor (DOL), and Securities and Exchange Commission (SEC), to ensure the best possible outcome for the benefit of customers. In addition, he has played a leadership role in the Alliance for Lifetime Income, a non-profit organization focused on raising awareness on the importance of retirement income planning and protected income in retirement,” a Lincoln release said this week.

A former board member of IRI and LL Global, Inc., the parent organization of LIMRA and LOMA, Fuller was the recipient of IRI’s 2014 Leadership Award for his contributions to the retirement income planning industry.

IRI created the Champions of Retirement Security Award in 2013 to recognize policymakers who have contributed to retirement security in America. IRI broadened the program in 2019 to recognize private sector individuals.

JP Morgan offers tool for plan advisors

J.P. Morgan Asset Management has launched Price Smart, a digital tool that lets plan advisors generate custom 401(k) pricing proposals for clients. Price Smart is available through Retirement Link, J.P Morgan’s bundled defined contribution plan offering.

Price Smart enables advisors to:

Identify potential cost savings

  • View three pricing options per plan, in flat dollars and percentages
  • Compare Retirement Link pricing proposal vs. current 401(k) fees

Tailor proposals to each plan

  • Present bundled or TPA pricing for multiple scenarios
  • Help clients make informed decisions by customizing additional services

Get instant results

  • Gain secure, 24/7 access to plan quotes on demand
  • Save and manage proposals online
Scholten to retire from Principal

Gary Scholten, executive vice president, chief information officer, chief digital officer, and direct report to Principal chairman, president and CEO Dan Houston, will retire effective Dec. 31, 2019, the company reported.

Scholten joined Principal in 1980 and has overseen the company’s use of information technology since 2002. He was named executive vice president in 2014 and became the chief digital officer in 2017. Scholten also oversees global sourcing and leads our offshore resourcing, Principal Global Services in Pune, India.

Scholten was part of Principal’s African America/Black Employee Resource Group for 10 years and chaired its Diversity Council for the past seven years. He has also served as the chairman of the board for the Technology Association of Iowa.

An internal and external global search for Scholten’s replacement is currently underway.

Principal absorbs Wells Fargo plan services

As part of its absorption of the Wells Fargo Institutional Retirement & Trust (IRT) business, Principal Financial Group is incorporating capabilities from the Wells Fargo IRT platform into its own proprietary recordkeeping platform. The enhanced Principal platform will serve both defined contribution and defined benefit participants.

Principal has accelerated investments in the Principal Total Retirement Suite (TRS) and its retirement recordkeeping system—launching financial wellness resources such as Principal Milestones, Principal Real Start, and a chat feature. Principal plan sponsors and participants will have access to a single source for plan benchmarking, performance monitoring, and feedback on plan health, regardless of plan type.

Plan sponsor benefits:

Flexible to fit various plan sizes and needs. Robust plan health assessment, benchmarking and reporting plus with a strategy dashboard.

Easy-to-administer plans. Plan sponsors have key decision-making and time-saving tools and resources to manage payroll processing, loans, and participant notices, etc. The chat feature for retirement plan sponsors gives them with answers to administrative questions.

Simplicity. Customizable, all-in-one retirement solutions for all major types of retirement plans, as well as risk management support.

Participant benefits:

Personalization​. Provides tailored education and communications, including the Principal Real Start on-boarding experience, Retirement Wellness Score, and Retirement Wellness Planner, all capabilities. Customizable features on the website enable participants to build a retirement savings dashboard.

Simplicity. Interactive tools and resources such as contribution slider with easy button, My Virtual Coach annual check-up and account aggregation.

Confidence enhancement​. Participants receive congratulatory messages when they take progress. The Principal Milestones platform facilitates will preparation, budgeting and applying for scholarships.

The enhancements to the Principal platform are expected to be available in 2020 and coincide with the transition of Wells Fargo IRT clients to the Principal platform.

11% of Gen Xers still paying off their own student loans: Schwab

Many 401(k) participants in Generation X struggle with credit card and other debt, according to research from Schwab Retirement Plan Services. About 40% of this group, ages 39 to 54, said they focus more on debt repayment than saving for retirement.

The nationwide survey of 1,000 401(k) plan participants included 368 Gen Xers, 315 Millennials and 317 Baby Boomers. Among Gen Xers, 70% feel “on top” of their 401(k) investments but “still face obstacles and experience financial stress.”

When asked what prevents them from saving more for retirement, Gen Xers named:

  • Unexpected expenses like home repairs (38%)
  • Credit card debt (31%)
  • Monthly bills (29%)

In addition, 22% are paying for children’s education/tuition, and 11% are still paying off their own student loans. Saving for retirement is Gen Xers’ top source of money-related stress (40%), followed by credit card debt (27%), and keeping up with monthly expenses (23%).

Genworth’s U.S. life insurance units suffer ratings downgrade

AM Best has downgraded the Financial Strength Rating (FSR) to B (Fair) from B+ (Good) and the Long-Term Issuer Credit Rating (Long-Term ICR) to “bb+” from “bbb-” of Genworth Life and Annuity Insurance Company (GLAIC) (Richmond, VA).

“The ratings of GLAIC reflect its balance sheet strength, which AM Best categorizes as strong, as well as its weak operating performance, limited business profile and appropriate enterprise risk management (ERM),” AM Best said in a release.

Concurrently, AM Best downgraded the FSR to C++ (Marginal) from B- (Fair) and the Long-Term ICRs to “b” from “bb-” of Genworth Life Insurance Company (GLIC) (Wilmington, DE) and Genworth Life Insurance Company of New York (GLICNY) (New York, NY).

Additionally, AM Best affirmed the Long-Term ICRs of “b” of Genworth Financial, Inc. (Genworth) [NYSE: GNW] and Genworth Holdings, Inc. (both domiciled in Delaware), as well as their Long-Term Issue Credit Ratings (Long-Term IR). The outlook of these Credit Ratings (ratings) is stable.

The rating downgrades of GLAIC follow a deterioration in its operating performance, in AM Best’s view. There has been history of negative profitability in aggregate and in most lines of businesses. Uncertainty around the potential for future reserve increases and other write-downs decreases credibility of future earnings projections.

Absolute and risk-adjusted capital, as measured by Best’s Capital Adequacy Ratio (BCAR), has decreased steadily over the past few years, driven by poor operating performance, although the overall balance sheet is assessed as strong. GLAIC calculated its risk-based capital (RBC) level at 422% at the end of 2018, a decrease from the prior year’s RBC score of 427%.

The ratings of GLIC and GLICNY reflect the group’s balance sheet strength, which AM Best categorizes as weak, as well as its weak operating performance, limited business profile and appropriate ERM.

The rating downgrades of GLIC and GLICNY follow a deterioration in AM Best’s view of its balance sheet strength and its operating performance. Risk-adjusted capitalization, as measured by BCAR and other capital metrics, deteriorated significantly.

An offsetting factor is management’s focused strategy of garnering actuarially supported premium rate increases on in-force long-term care policies.

“Management identified the need for these increases in 2012, took corrective action and has achieved meaningful results, although the ability to gain sufficient premium increases across all states will take a number of years.

“While GNW has had some success at achieving these increases in the past, operating losses continue to persist and the impact and timing of the approval and receipt of those rate increases continue to be uncertain,” the release said.

The rating affirmations of the two holding companies, Genworth and Genworth Holdings, Inc., as well as its associated debt, reflect the impact of the recently announced the sale of Genworth’s 57% stake in Genworth MI Canada, Inc. to Brookfield Business Partners.

Net proceeds are expected to be approximately $1.8 billion, strengthening the balance sheet flexibility and liquidity of the holding company as the proceeds are expected mainly to be used to reduce upcoming debt.

Military is adapting to new retirement savings system: Survey

A survey conducted by First Command Financial Services, which provides banking and financial coaching services to members of U.S. military forces, shows that middle-class military families who are covered by the new Blended Retirement System (BRS)—which combines the traditional military pension with a defined contribution plan—are more likely that those in the traditional military pension program to:

Invest conservatively. The Index reveals that their most frequent investment choice is the government securities fund (“G Fund”) which offers protection from loss of principal but delivers returns that may be below the rate of inflation. The G Fund was selected by 43% of BRS participants versus 25% of those in the traditional pension.

Contribute to the government’s tax-advantaged savings program. Families covered under the BRS are significantly more likely than those covered under the traditional military pension to contribute to the Thrift Savings Plan (TSP), the government’s 401(k)-style defined contribution plan for service members and federal employees. The Index reveals that the TSP participation rate is 81% for those in the BRS versus 56% for those in the traditional pension system.

Invest 5% or more of their paychecks in TSP. Among those participating in TSP, 82% of BRS participants are contributing 5% or more of their pay to the savings plan. That compares to just 51% for those in the traditional system.

Feel confident about retirement. Eighty-four percent of BRS participants say they feel extremely or very confident in their ability to retire comfortably. That compares to 56% for those in the traditional system.

Benefit from working with an adviser. TSP participation is particularly high among career military families who seek out professional financial assistance. The First Command Financial Behaviors Index reveals that the participation rate is 70% for those who work with a financial advisor versus 45% for their do-it-yourself colleagues.

The survey was conducted among commissioned officers and senior NCOs in pay grades E-5 and above with household incomes of at least $50,000.

© 2019 RIJ Publishing LLC. All rights reserved.
 

Voya rolls out risk-adjusted TDFs

Voya Financial’s MyCompass Index, a new target date fund series designed by flexPATH Strategies Inc., is now available to all of Voya’s retirement plan customers, according to a release this week.

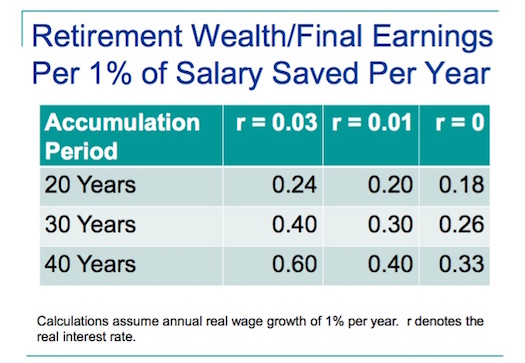
Target date funds (TDFs) have reached $2.1 trillion in assets under management in employer-sponsored defined contribution plan accounts as of the end of 2017, up from $1.3 trillion in 2015, according to industry data cited by Voya. Of the $2.1 trillion, so-called custom TDFs have an estimated $430 billion.

MyCompass Index includes the following key features and benefits:

Multiple participant glide paths. MyCompass Index offers three glide paths (conservative, moderate and aggressive) to address individual needs and risk tolerances.

Fund name transparency. In addition to selecting the year in which a participant plans to retire (as one does with a traditional TDF), participants will add the risk level to the name of his or her fund. For example: “MyCompass Index Aggressive 2025.”

Fiduciary Protection. MyCompass Index offers increased support and protection around TDFs, shielding the fiduciary responsibility for plan sponsors to select and monitor investment funds for participants.

The new MyCompass Index solution complements Voya’s current TDF solutions, which are offered by Voya Investment Management. Assets in these funds have increased from $10.5 billion to $16.5 billion over the past five years (as of June 30, 2019). Voya’s data shows that approximately 80% of participants in its new Small-Mid Corporate Market 401(k) plans select Voya TDFs.

Voya continues to invest in its suite of digital retirement planning services including a digital financial wellness experience, special needs planning tools and personalized account videos, the release said.

© 2019 RIJ Publishing LLC. All rights reserved.