Archives: Articles

IssueM Articles

RIJ’s 500th Issue

Dear readers, this is the 500th issue of Retirement Income Journal.

The idea for RIJ can be traced in March 2009, the lowest point of the Great Financial Crisis. Until then I was writing and editing Annuity Market News, which circulated mainly among members of the National Association for Variable Annuities (now the Insured Retirement Institute). That publication had just been cancelled by its owner, SourceMedia.

Within a few days, Jeremy Alexander, of Beacon Research, phoned me to find out what my next steps would be. I wasn’t sure. I had spent the previous 2½ years reporting on the annuity industry. By “reporting,” I mean talking to hundreds of life insurance executives, actuaries, academics, attorneys and software developers on the phone, by email and in person at conferences. I had recently written Annuities for Dummies. My spouse was working, but our two oldest daughters were still in college.

Amid the chaos, one element remained constant: the global retirement crisis. I had returned to journalism in 2006, after nine years in Vanguard’s retirement marketing department, specifically to write about what struck me as one of the most important news stories of our time: The baby-boomer age wave and the pension crises (public, private and personal) that it was triggering all over the world. As a boomer, I was living that story. As a reporter, I felt compelled to “cover” it.

So I started a new web-based publication. I created a domain and a website. I located off-the-shelf platform vendors for content management and email distribution. On the strength of sweat equity, Retirement Income Journal was born. Its content and the audience matched that of Annuity Market News, but everything else was different. RIJ was a weekly, not a monthly. It was web-only, with no print edition. Annuity Market News circulated more or less free to its readers; RIJ would need cash flow.

The choice of revenue model was never much in question. To report “without fear or favor,” as the Times put it, on whatever aspects of the retirement story appeared interesting and timely to me, the publication needed paid subscribers. Managing the conflict between serving readers and advertisers just wouldn’t work for me.

So, in December 2009, I put up a “paywall” and began soliciting subscribers. In what still seems like a near-miracle, people and companies responded. Spontaneously, and (as far as I knew) independently of each other, they bought individual and corporate subscriptions. At that moment in time, the “retirement industry,” an unofficial federation of individuals and organizations with similar interests and purposes—an entity more universal than the annuity industry—needed this type of periodical.

RIJ has no formal mission statement, but it always had goals:

  • To inform readers about the latest products and processes that could help boomers convert savings to income. Though written for professionals, it would have the interests of near-retirees at heart.
  • To talk to the retirement industry in a voice it would recognize—as a member of it but not as a captive of it. If I hadn’t worked inside the annuity industry, this would have been impossible.
  • To publish content that reveals the borderless nature of the retirement crisis. The story was international in nature, especially in a financially globalized world.
  • To deconstruct the disinformation that circulates so glibly in the financial services industry. I wanted to report what industry executives say to each other, not what they say to the public.
  • To exploit the overlooked drama of the retirement business. A topic that involves life, death, fate, chance, greed, fear, brains, ambition, and trillions of dollars was neglected by most of the publishing world.
  • To make the e-newsletter and website colorful enough, in words and pictures, to make people want to open their weekly RIJ e-mail.

On its tenth birthday, RIJ is still a work in progress. The subject is so large. The potential is barely touched. As for the future, I and my team—Laura Chinnis on the tech side and Laurel Cavalluzzo on the marketing side—are in the process of strengthening our coverage for and circulation among financial advisors. There are also a couple of books I’d like to write. For inspiration, I keep a glazed ceramic tile on a shelf above my desk, inspired by 15th century explorers and fired a couple of decades ago at the Moravian Pottery & Tile Works in Doylestown, PA. It says, “Plus Ultra.”

© 2019 RIJ Publishing LLC. All rights reserved.

© 2019 RIJ Publishing LLC. All rights reserved.

We Are All Active Investors Now

Investors have long debated whether their portfolios should be actively managed or passively track a market index. But that discussion is becoming a sideshow. Attention is shifting to what matters most: the active decisions about strategic asset allocation that largely determine subsequent investment returns.

To paraphrase Milton Friedman in the 1960s, we are all active now.

True, passive global exchange-traded funds (ETFs) have experienced explosive growth—from just over $200 billion in assets in 2003 to more than $4.6 trillion last year—which has enabled them to gain market share from more expensive actively managed funds. And investors should always take the lower-cost option if paying higher fees for an active fund brings little additional value (especially during bull markets, when simply being in the game can yield outsize returns).

Yet the rapid rise of low-cost ETFs has had two other important effects on investment management.

First, active management fees have come under pressure, particularly for weaker- performing funds. For example, the proportion of hedge fund managers charging “two and twenty” fees—a 2% management fee plus 20% of any profits earned—has fallen below one-third. Given mediocre hedge fund performance over the past decade and the emergence of liquid alternatives, it’s surprising that fees haven’t fallen further. Moreover, average fees for active funds across all investment strategies fell from about 1% in 2000 to 0.72% in 2017, a downward trend that shows no signs of abating.

Second, the proliferation of ETFs has blurred the distinction between passive and low-cost investing. Strictly speaking, a passive strategy is one that continuously rebalances a portfolio to track a market-capitalization-weighted index. Yet many ETFs go well beyond this textbook definition by offering investors exposure to particular regions, sectors, factors, or types of credit, as well as a multitude of other “sub-market” criteria. These funds are not passive, but rather instruments for expressing active investment views inexpensively.

But now ETFs themselves face challenges. Several decades ago, the advent of cheaper investment vehicles, including ETFs, boosted investors’ net returns. Between 1979 and 1992, for example, the average weighted retail mutual-fund expense ratio was about 1.5% (including sales load fee). But with the average fee on actively managed funds now below 75 basis points, versus about 44 basis points for ETFs, the “excess return” to ETFs is falling.

What’s more, the rapid expansion of ETFs coincided with bull markets. Index performance largely dictated security selection, and asset allocation meant little more than piling into stocks, bonds, and credit. But those days are probably over. Further sustained market advances are unlikely, given stretched stock and bond valuations, slowing economic and earnings growth, and heightened political and policy uncertainty. Broad market returns are likely to be lower, with episodes of volatility probably more frequent.

In a world of lower returns and a narrowing fee gap between active and passive investment vehicles, investors must shift their emphasis from cheap market access to proper portfolio construction. After all, the choice of which asset-allocation strategy to pursue determines most of an investment portfolio’s return. Other factors, such as tactical asset allocation or the choice of instrument, are of secondary importance and may account for less than 10% of portfolio variance.

The biggest mistake investors could make in today’s environment is to seek a safe haven in “balanced” portfolios of stocks and bonds. Both asset classes suffer from unattractive valuations and deteriorating fundamentals. It beggars belief to think that holding a roughly equal proportion of each will deliver satisfactory results.

Instead, investors must recognize that lower risk-adjusted returns—as reflected in falling Sharpe ratios—and shifting market correlations place a premium on genuine diversification and loss avoidance. Diversification requires investors to pay attention to market, factor, and non-directional sources of return, and also to focus on volatility and correlation. Avoiding losses calls for flexible decision-making to cut exposures when necessary.

Some of the instruments that investors need to diversify and avoid losses may well be low-cost. But many of them, including long/short or alternative risk-premium strategies, are unlikely to be found in the ETF universe. A blended approach is therefore likely to provide the greatest diversification benefits.

Rather than worrying about whether their portfolios are actively or passively managed, investors should focus on the crucial decision of strategic asset allocation. The tired active-passive investment debate has run its course. We truly are all active investors now.

© 2019 Project Syndicate.

AIG enhances index annuities

AIG Life & Retirement, a division of American International Group, Inc., has added two new living benefit riders to its Power Series of index annuities: the Lifetime Income Plus Flex and the Lifetime Income Plus Multiplier Flex.

These riders allow contract owners to:

  • Change coverage options between single and joint life to meet varying income needs and life events, such as marriage, divorce or death.
  • Take withdrawals without losing their annual step-ups and doubling guarantee.
  • Access money and not lock in their withdrawal percentage for life until they are ready to start retirement income.

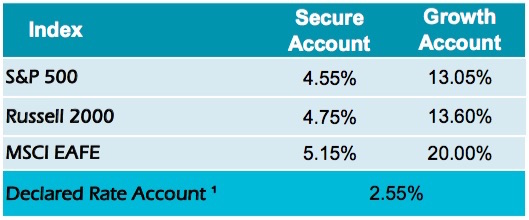
The enhanced Power Series also offers the Russell 2000, a U.S. small-cap stock index, and the MSCI EAFE, an international stock index, in addition to the existing S&P 500, PIMCO Global Optima and ML Strategic Balanced index options.

Last month, AIG Life & Retirement announced “Plan for 100,” a new initiative focused on preparing individuals, employers and financial advisors for retirements that could last four decades or more.

The initiative, with its 100-year theme complementing the centennial celebration at AIG, includes the launch of a new website (Planfor100.com) and podcast series to raise awareness about the impact of increased longevity and educate Americans about potential solutions.

© 2019 RIJ Publishing LLC. All rights reserved.

Many regret claiming SS early: MassMutual

In a survey of 60-somethings who have already filed for Social Security retirement benefits, MassMutual discovered that many Americans who claim early regret doing so and wished they had filed later and captured higher monthly benefits.

The 2019 MassMutual “Social Security Pulse Check,” a co-venture with AgeFriendly.com, uncovered a cruel irony: Many people file early because they aren’t working, lack savings, and need the monthly income Social Security provides; yet the same people would benefit most from claiming later.

“Many are not saving enough for retirement and need to access funds the minute they can—regardless of the longer term impact of the decision—and in some cases, unforeseen health issues are complicating the issue,” said Mike Fanning, head of MassMutual US, in a release this week.

The survey showed that:

  • 30% filed at age 62 or younger
  • 38% wished they filed later
  • 53% filed out financial necessity, such as not saving enough
  • 30% filed as the result of unforeseen health issues or employment changes

In an extreme example, a high-earning, healthy married couple could be leaving more than a half million dollars “on the table,” or as much as $2,000-4,000 per month for life, if both filed for benefits at age 62 instead of age 70, the release said. A surviving spouse could receive $1,000 to 2,000 per month less for life as a result of a primary earner filing at age 62.

Most survey respondents (79%) felt that they had the right amount of information about when to file for Social Security retirement benefits, and 58% didn’t get help or advice.

For more information and examples of write-in commentary from survey respondents, visit this blog.

MassMutual is a corporate founding sponsor of Age Friendly Advisor and member of the Alliance for Lifetime Income and the MIT AgeLab. Age Friendly conducted the MassMutual Social Security Pulse Check via an online survey of 618 individuals age 70+ in March/April 2019.

© 2019 RIJ Publishing LLC. All rights reserved.

Three Annuity Cures for Sequence Risk

The Dow Jones Industrial Average fell by about 600 points on Monday, as investors reacted to fresh tremors in the US-China trade relationship. Although the Dow regained 100 points on Tuesday, the jittery sell-off was a reminder that financial instability is never more than a presidential tweet away.

To provide near-retirement investors with a safe haven for at least part of their money, Fidelity Investments and New York Life have partnered to offer a deferred variable annuity with a guaranteed minimum accumulation rider (VA/GMAB) that guarantees no loss of principal over a 10-year holding period. The only underlying investment is the Fidelity VIP FundsManager 60, which targets a 50% to 70% equity allocation.

The New York Life Premier Variable Annuity—P Series, with Investment Preservation Rider, as the product is called, is billed as “simple and easy to understand, while also providing confidence during market volatility,” according to Fidelity’s press release. The product is designed for people who want principal protection during the years around the retirement date when “sequence of returns” risk—the risk of having to liquidate depressed assets for current income—is highest.

The product joins a variety of other annuity products on the market that are designed to insure near-retirees and retirees from the worst effects of a market storm (which everyone seems to expect after a 10-year bull market) while still allowing them to capture at least some upside if the predictions of doom prove false.

Insurance products in this category include fixed indexed annuities (FIAs), deferred fixed annuities, index-linked “buffer” annuities, as well as variable annuities with lifetime withdrawal riders. They’re designed for investors who want more protection than they can get simply by reducing their equity allocation to 50%.

Indexed annuities

For instance, a fixed indexed annuity could also be used to solve the problem that the New York Life VA/GMAB is built to solve. A few weeks ago, RIJ published a side-by-side comparison of New York Life’s new deferred variable annuity with minimum accumulation benefit rider with a 10-year fixed indexed annuity. The analysis was conducted by Cannex, the annuity data shop, and sponsored by New York Life.

An exact comparison between the two types of products–one of which invests directly in equities and bonds and one that only holds bonds and equity options–was difficult. But Cannex concluded that the FIA would have to have an extraordinary performance cap of 8.25% to compete on average with the VA/GMAB, for which Cannex assumed an average return of 4.99%, net of fees. FIAs with a participation rate of 42.3% over 10 years start to outperform the VA/GMAB. The FIA returns were more clustered, the VA returns were potentially much higher. Both offered limited liquidity.

In the Cannex study, the VA had higher potential returns, while the FIA had more predictable returns, and was more likely to produce a positive return than the VA, Cannex determined. The two products were difficult to compare cleanly. FIAs lock in gains each year, while the New York Life VA/GMAB locks in gains at the end of 10 years (unless the client chooses to lock in gains on an anniversary).

Equities plus a MYGA

There’s a third way to solve a client’s sequence risk problem, by relying on two cheap, transparent products instead of one complex all-in-one product. This third strategy would involve much lower costs, would allow upside unimpeded by caps or participation rates or high marketing fees or dilution with bonds, and wouldn’t rely on luck (the coincidence of a high water account value with a contract anniversary).

This strategy calls for the purchase of a fixed multi-year guaranteed rate annuity with enough of the $100,000 investment to ensure that it would grow to about $100,000 in 10 years, with the remainder invested in the S&P500 index fund. A 10-year MYGA from an insurer with an A rating or better ranges from 2.6% (for a New York Life product) to about 3.3% at current rates. To produce a sure $100,000 after 10 years, the client would have to invest between $77,400 and $72,400.

The client would invest the remaining $22,600 or $27,600 in the equity index. Using an ultra-cheap S&P500 with an assumed growth rate was 11% (the average return of Vanguard’s S&P500 since August 1976), those amounts would hypothetically grow to $64,170 or $78,370 over 10 years. Combined, the two products would be worth more than $164,000 or more than $178,000.

Even with a recurrence of the worst 10-year performance in the modern history of the S&P500 (-3%, for the decade ending in February 2009), the client would still have at least $120,000 at the end of 10 years.

The client can personalize his risk level with precision. One client might apply $80,000 to the 2.6% MYGA and only $20,000 to the S&P500, with an average result of about $103,400 for the MYGA and $56,790 and a worst case of $122,800. Another client might put $60,000 in the MYGA and $40,000 in the S&P500 fund 113575, with an average expected return of about $167,000 and a worst case of about $116,000.

While the New York Life/Fidelity product’s account value could in theory reach $200,000 or more, it also has a 14% chance of having a final balance of just $100,000. Its main drawback is fee drag. There’s a 1.20% mortality and expense (M&E) risk charge (1% per year after the seven-year surrender charge period), a 0.70% fee for the principal preservation rider, and a 0.74% annual investment fee.

In the two product strategy, the client would not have to sell his S&P500 fund if its value were depressed at the end of ten years. He could hold it in expectation of a big rebound. In addition, the amount invested in the S&P500 Index would be fully liquid during the 10-year holding period, with harvestable gains. Withdrawals from the more complex all-in-one products may entail surrender fees, market-value adjustments or reductions in the guarantee.

In the real world, however, few clients would see all three solutions. Most advisors develop a comfort zone or follow a business model that favors one risk management strategy over another. But advisors who consider themselves fiduciaries, and who want to give clients a chance to decide among multiple options, should arguably have several annuity arrows in their quiver.

© 2019 RIJ Publishing LLC. All rights reserved.

Deregulating Retirement

Legislators in the House and Senate are inching toward the passage of two similar pieces of retirement legislation. These bills, the SECURE Act (H.R.1994) in the House and RESA (S.972) in the Senate, would tweak many aspects of existing pension law.

More specifically, they would loosen current rules for retirement plans in at least three ways that could impact the 401(k) business:

  • First, their “open multiple employer plan” provision would allow small company employers to join big, provider-sponsored, multi-employer 401(k) plans rather than sponsoring their own plans.
  • Second, the bills don’t limit the types of annuities that could be offered in 401(k) plans to plain-vanilla immediate or deferred income annuities, as previous Department of Labor (DOL) policy preferred.
  • Third, the bills allow plan sponsors to rely on state insurance commissions to verify the financial strength of the life insurers that offer in-plan annuities, even though 401(k) plans are regulated by the federal government. There’s no requirement that the insurer be A-rated by the ratings agencies.

These provisions could, by reducing the administrative or legal burden of plan sponsorship on employers, encourage more small employers to offer 401(k) plans—and even to offer annuities in plans. That’s why the retirement industry has lobbied for them.

If they did stimulate more plans, it could help close the “coverage gap” that leaves up to half of all private sector workers in the US without a retirement savings program at work. That’s part of the public policy rationale for the bills. By removing barriers to commerce, however, they have the potential to affect long-standing safeguards for workers’ savings in unpredictable ways.

‘Challenges in the System’

On Tuesday, in a meeting entitled “Challenges in the Retirement System,” members of the Senate Finance Committee interviewed four witnesses with stakes in retirement reform: Joni Tibbetts of Principal Financial, Joan Ruff of AARP, Lynn Dudley of the American Benefits Council and Tobias Read, state treasurer of Oregon, which has pioneered a workplace-based Roth IRA program called OregonSaves.

Principal’s presence at the meeting made sense. Principal provides retirement plan services to tens of thousands of small and mid-sized plans in the US. In addition, Principal already has an in-plan annuity option, the Pension Builder, which allows participants to make incremental contributions toward a life-with-10 year’s certain deferred fixed income annuity. So the Des Moines-based plan provider could be a major beneficiary of both the open MEP provision and the in-plan annuity elements of RESA and SECURE. “We like open MEPs,” Tibbetts told the senators.

Sri Reddy, the chief of Principal’s Retirement and Income Solutions business, told RIJ in an email this week, “We believe the specific annuity provisions of SECURE/RESA will encourage more employers to make in-plan annuities available to their employees and we are confident that over time, with appropriate education, participants will see great benefit in electing to convert portions of the accumulated balances into a guaranteed income stream.”

Open MEPs and a ‘safe harbor’

But the hearing didn’t touch on parts of the bill that, I think, merit more discussion. The “open MEP” and annuity “safe harbor” provisions of the bill sound fairly innocuous but they could remake the retirement industry.

For instance, the “open MEP” provision would, on the face of it, allow small firms to “band together” to buy retirement plan services at economies of scale.

But informed observers agree that the impact will be very different. The law will allow—it’s still not clear exactly how—plan service providers to sponsor large plans and invite many small employers to join it. That would turn the current employer-driven 401(k) world on its head.

There are two other provisions in the RESA and SECURE bills that sound purely technical but could have far-reaching consequences. One provision appears to allow plan sponsors, when choosing an annuity to incorporate into their plan, to rely on state insurance commissions for information about the financial strength of an annuity provider.

But retirement plan sponsors have hitherto had to meet Department of Labor standards for due diligence when choosing an annuity. In 2008 and in 2015, the DOL reframed the steps required of an employer when choosing an annuity. But annuity issuers have pressed for further relaxation of the regulations, and have succeeded in shifting from federal to state standards for annuity strength.

Significantly, the new bills also appear to allow almost any annuity product as a plan option. In the past (in Field Assistance Bulletin 2015-02), the DOL used only immediate and deferred income annuities in its illustrations—implying that only those annuities should be offered in retirement plans. But here’s how the new bills define an annuity for the purpose of inclusion in a 401(k) plan:

“The term ‘guaranteed retirement income contract’ means an annuity contract for a fixed term or a contract (or provision or feature thereof) which provides guaranteed benefits annually (or more frequently) for at least the remainder of the life of the participant or the joint lives of the participant and the participant’s designated beneficiary as part of an individual account plan.”

The words, “or provision or feature thereof,” means that the chosen annuity need only have a rider or a clause that allows conversion of the contract to an income annuity. In fact, every annuity contract—including every deferred indexed and variable annuity contracts—contains such provisions. That’s what makes a contract an “annuity.” It’s why only life insurers can issue annuities, and why deferred annuities receive favorable tax treatment.

These two provisions are a potential boon to the annuity industry generally. They represent the kind of deregulatory spirit that arrived in Washington with the Trump administration. The Obama DOL’s Employee Benefit Security Administration, headed by Phyllis Borzi, would almost certainly have questioned them.

Indeed, Borzi told RIJ in an email this week, “We did intend the safe harbor to be limited to what I would call ‘plain vanilla’ lifetime income products like immediate and deferred annuities and not sweep as broadly as the current legislation does. That doesn’t mean that the other investment products offered by insurers (e.g., variable annuities and fixed indexed annuities) are prohibited from being used in 401(k) plans. It simply means that they are not eligible for safe harbor treatment.”

Regarding the reliance on state insurance commissions, she said, “That is a huge weakness (if not an enormous loophole) in the pending legislation. [It] does appear to turn this important component of the DOL’s fiduciary interpretive, administrative and enforcement powers over to the states.

“Deferring to the states for standard-setting for ERISA plans is a very unusual and odd result… In my 40 plus years of ERISA practice, plan sponsors have always strenuously opposed such an approach.”

Bottom line: the RESA and SECURE bills contain provisions that could potentially drive enormous changes in the retirement industry. These provisions have largely been written behind closed doors, with strong industry influence. For some, the implications of the language in the bills is worrisome. Others hope that the bills, if passed, will remove long-standing barriers to innovation.

© 2019 RIJ Publishing LLC. All rights reserved.

How Debt Affects Retirement

A mid-life kitchen crisis can mess up your retirement plans.

A suburban couple, ages 55 and 50, had 10 years left on their mortgage and a 1970s kitchen with avocado appliances and brown cabinets. With a $50,000 cash-out refinance, they removed a wall, added a stainless steel stove and fridge, and created a beautiful open-plan living/cooking space.

There was a small problem, however. Their new 15-year mortgage threatened to push back the husband’s retirement date—and Social Security claiming date—by five years. In theory, he could pay off their mortgage early and still stop working at age 65, but the couple’s savings would shrink.

This anecdote is admittedly, well, anecdotal. But it’s indicative of a trend—one strong enough to be documented by economists Barbara A. Butrica of the Urban Institute and Nadia S. Karamcheva of the Congressional Budget Office, in a new paper, “Is Rising Household Debt Affecting Retirement Decisions.”

They aren’t the only ones tracking the effect of debt on retirement. Their paper was one of several presented in Philadelphia last week at the 65th annual symposium of the Pension Research Council, which is part of the Wharton School. This year’s conference theme was “Remaking Retirement? Debt in an Aging Economy.”

Americans are approaching and entering retirement with unprecedented debt. For the poorest retirees, bills can spoil retirement entirely. For the wealthy, it’s often harmless–a reflection less of hardship than of leveraged assets. For those in the middle, like the couple with the kitchen, it’s a problem that needs careful handling. Advisors who specialize in retirement planning should take note.

A wrinkled rainbow

Franco Modigliani’s lifecycle theory of personal finance suggests that people lever up for homes and education in impecunious early adulthood and amortize their debt as they earn more: thus “smoothing” their consumption. But with older Americans refinancing mortgages, taking on college loans or buying new cars, the lifecycle arc looks less and less like a rainbow and there’s as much debt as gold at the end.

“On average, households continue to make payments for mortgages, auto loans, credit card debt, and even student loans well into their 60s, 70s, and beyond,” wrote Anne Lester of JP Morgan, who presented her team’s analysis of the debt payments of 5.1 million JP Morgan banking customers. “This suggests that the conventional view of enjoying retirement largely debt free after paying off a mortgage and driving the same paid-for car appears outdated for many.”

Older Americans still carry less debt than their younger counterparts, but their debt loads are trending up. There’s been “an 87% increase in the real consumer debt held by Americans ages 55 to 80 between 2003 and 2017,” according to economists from Stony Brook University and the Federal Reserve Bank of New York, in their paper, “The Graying of American Debt.” Meanwhile, debt for those ages 35-54 rose only 6%. For those below age 35, debt growth was flat.

The same proportion of households ages 55 to 64 carries debt as did 25 years ago (about 75%), but their median debt load ($31,000 in 2016) was more than double the median in 1995 [adjusted for inflation],” according to “The Risk of Financial Distress in Retirement: A Cohort Analysis,” by economists at the Social Security Administration, the Treasury Department and Harvard.

Most of the increase comes from mortgages and home equity loans, but credit card debt and student loans also increased over the period, they said. The share of older households with credit card debt has increased to 42% from 31% since 1995; the median credit card balance has doubled, to $2,800 from $1,400. The share of older households paying off student loans—either for children, grandchildren or themselves—rose to 10% from 3%, and the median amount owed rose to $18,000 from $5,400 (in 2016 dollars).

Along with per capita debt, aggregate debt among older people is growing in part because the elderly demographic is growing. The baby boom “elephant” is moving through the “python” of history. Low interest rates, the abundant and ubiquitous availability of credit, the federal bankruptcy reform of 2005 (which made it harder to discharge debts), the wealth effects of the housing and equity markets, and the concentration of wealth have all shaped recent trends in debt holding.

Delayed retirements

Not surprisingly, debt forces people to postpone retirement and/or postpone claiming Social Security. “Individuals who have more debt than financial assets are more likely to be working and less likely to be retired than individuals who have enough financial assets to cover their debt, and individuals with no debt are least likely to work and most likely to be retired,” wrote Butrica and Karamcheva.

Mortgage debt appears to delay retirement, while credit card debt tends to hasten claiming Social Security. “Compared to households with no debt, those with a medium degree of indebtedness (households whose financial assets cover their debt) are more likely to delay claiming their benefits, while households with a high degree of indebtedness (households whose financial assets don’t cover their debt) might be more likely to claim early,” they wrote.

Although secured debt (i.e., mortgage) levels tend to be much higher in dollar value than unsecured debt (i.e., credit cards), credit card debt affects retirement decisions more. “A $10,000 increase in credit card debt for a person with the median amount of credit card debt increases the likelihood of working by 9.4 percentage points, reduces the probability of receiving Social Security benefits by 9.1 percentage points, and reduces the likelihood of being retired by 11.0 percentage points,” according to Butrica and Karamcheva.

Because of debt, the “incidence of hardship” is currently projected to be about 50% higher for retirees born in the mid-1950s compared with people born in the mid-1930s, according to the paper, “The Risk of Financial Hardship in Retirement: A Cohort Analysis,” by Jason Brown of the Social Security Administration, Karen Dynan of Harvard, and Theodore Figinski of the Treasury Department.

In addition to suffering, this will create pressure on government services. “A material share of the individuals approaching retirement age in the mid-2010s are likely to face hardship in their late 70s and early 80s… One in ten are predicted to be on food stamps, one in eight are predicted to be in poverty, one in six are predicted to be on Medicaid, and one in four will have annuitized wealth that is below 1.5 times the poverty line for their household,” they wrote.

If nothing else, high debt loads make retirees more financially fragile and less able to absorb the shocks that they will inevitably experience with age. Butrica and Karamcheva cited data showing that “three-quarters of adults ages 51 to 61 and more than two-thirds of those age 70 and older experience a negative event over a nine- or 10-year period and simultaneously a large decline in wealth.”

Worse for some than others

Debt in retirement tends to be a burden to the extent that it outweighs assets. Wealthy retirees have more capacity for debt and carry more of it, but they wear it relatively lightly because they own substantial amounts of assets—some of which they financed with debt.

“Having debt in late middle-age may, on average, be associated with households who are in a relatively secure position at this stage given that access to credit rises with income and that much household debt finances assets that yield material positive returns over the longer run,” according to Brown, Dynan and Figinski.

For the mass-affluent retiree with little or no mortgage debt, ample savings and income from pensions or Social Security, debt service tends to be manageable. For the poor, debt becomes a source of hardship. Americans of color continue to have much lower levels of assets, on average, than white Americans. The differential is somewhat startling.

“The ratio of the wealth of the median White household to the median Black household and the median Hispanic household has fluctuated between 5 to 1 and 10 to 1 for over 20 years,” according to those three authors.

Lack of assets will force the poorest retirees to use unsecured debt, often at high interest rates. “We find that those with short-term uncollateralized debt as well as those still holding student loans for their education tend to be those most subject to financial distress,” according to the organizers of the conference, Annamaria Lusardi, an economist and professor at George Washington University and Olivia S. Mitchell, PhD, director of the Pension Research Council, in their paper, “Financial Vulnerability in Later Life and its Implications for Retirement Well-being.”

“Women, the low-income, and African Americans tend to be those most vulnerable due to debt at older ages,” they wrote. Having to postpone retirement by a few years to accommodate an investment in a modern kitchen is not the worst problem one can have.

(Editor’s note: The conference papers are not yet available for broad distribution.)

© 2019 RIJ Publishing LLC. All rights reserved.

At the Morningstar Investor Conference

David Blanchett was about mid-way into his presentation on retirement planning—”(Re) Modeling the Cost of Retirement”—when I arrived at the Morningstar Investors Conference in Chicago Wednesday morning. The breakout room at the McCormick Center was crowded with 300 or so attentive financial advisors, many braced against the walls with their wheeled carry-ons and bright red conference swag bags.

Morningstar’s retirement research chief introduced the topic of annuities gingerly, promising to say the “A-word” only once. He described income-generating insurance contracts succinctly:

“This is risk transfer. This is not wealth maximization.” He also said, “If you don’t talk about guaranteed income with your clients, then you’re not really providing holistic financial advice.” Great points.

Blanchett then showed how guaranteed income streams and a systematic withdrawal method can work together in the same retirement income plan. The greater the percentage of retirees’ essential expenses met by Social Security, pensions or annuities, he said, the greater their withdrawal rates from risky assets can be (to 6.9% a year, in his calculation). Blanchett gave a solid presentation on the benefits of annuities, for an audience that probably doesn’t use them much.

Most of Blanchett’s presentation will have been familiar to followers of his research, much of it done in collaboration Wade Pfau and Michael Finke of The American College. But the level of audience-engagement during the session seemed to signal that the notion of blending annuities and investments in retirement is new to a big percentage of advisors.

No surprise there: The preoccupation with market-beating returns and principal-preservation that dominates the accumulation stage is a hard habit to kick. It carries over into retirement, especially among wealthy clients who are counting on their advisors to make them even richer at the end of retirement than they were at the beginning.

Only one point in Blanchett’s presentation needed clarification, I thought. He said that “high income retirees get less from Social Security” than lower income retirees. I hear this a lot, but, obviously, it’s not true.

While Social Security, because of its progressive benefit formula, replaces a higher percentage of pre-retirement income for low lifetime earners, it doesn’t mean they “get more.” High lifetime earners receive, in absolute terms, much higher monthly benefits. They also receive higher cumulative benefits, because they tend to live longer.

Where are the life insurers?

Oddly, annuity providers failed to sponsor a single booth at the Morningstar conference trade show. On a break between breakout sessions, I paced up and down the broad avenues of the exhibition hall at the McCormick Center, snacking from a paper cup of dried bananas, cranberries and apricots, and didn’t see any.

If annuity issuers want to expand their reach into the RIA market, as they claim to, why aren’t any of them here? (That’s not meant to be a rhetorical question.) Yes, this is an investment conference, and most of the exhibitors are mutual fund firms. But Morningstar has a variable annuity data business, and a retirement research department, run by Blanchett. On the conference program, there was even a decumulation panel discussion on “Cracking the Retirement Nest Egg,” featuring Kelli Hueler of Income Solutions, the annuity platform for certain jumbo plan sponsors and providers.

Trade show exhibits are expensive; I get it. But if you hope to get traction with this audience in the future, show the annuity flag today. The journey of a thousand sales, they say, begins with a single booth.

© 2019 RIJ Publishing LLC. All rights reserved.
Target-date CITs grew in 2018: Morningstar

Assets in target-date mutual funds shrank in 2018 but the overall market grew, as providers gathered assets into low-cost alternatives like collective investment trusts (CITs), according to Morningstar’s annual Target Date Fund Landscape Report.

The 2019 report evaluated more than 60 series of target date funds (TDFs) and found intensifying demand for low-fee options. Providers answered demand with inexpensive options like CITs or new lower-cost series that rely on passive funds.

Assets in target-date strategies totaled more than $1.7 trillion at the end of 2018, with $1.1 trillion in mutual funds and approximately $660 billion in target date CITs. Vanguard claimed nearly 40% of the TDF market at year-end 2018 and held roughly $650 billion in total assets across its mutual fund and CIT series.

The report presents the latest developments in the target-date landscape, highlighting noteworthy considerations for target-date investors in five areas: Process, People, Performance, Price, and Parent.

In June, Morningstar intends to launch a new quarterly publication, “Target-Date Fund Series Reports,” which will feature analyses of sub-asset-class glide paths and insights on a series’ management. It will also introduce a revised methodology for performance attribution.

Key findings from Morningstar’s annual TDF landscape report include:

  • The demand for lower-cost options propelled growth in target-date series offered as CITs, which typically cost less than mutual funds. In 2018, assets in target-date CITs totaled approximately $660 billion, a roughly $30-billion increase in a year when returns were negative.
  • Assets in target-date mutual funds receded slightly in 2018 for the first time since 2008. Even though assets in target-date mutual funds fell to $1.09 trillion at the end of 2018 from $1.11 trillion at year-end 2017, their estimated net inflows for the year were positive, at $55 billion.
  • Price drove demand for TDFs in 2018. Nearly all the $55 billion estimated net flows in 2018 went to low-cost series that held more than 80% of assets in index funds. Assets moved to lower-cost share classes, reducing the average asset-weighted expense ratio to 0.62% in 2018 from 0.66% in 2017.
  • Many TDF providers have launched less-expensive alternatives to their higher-priced legacy offerings or made their strategy available in lower-cost vehicles like CITs. However, returns of a target-date provider’s newer, lower-cost series didn’t always beat those of the legacy. Of the 10 target-date series that replicate a legacy offering but with lower fees, the since-inception returns for three failed to keep pace.
  • “Passive target-date funds” do not exist. Even among series that invest only in index funds, there are significant differences in methods—differences that can’t always be inferred from their equity glide paths.
  • Only 16 of the roughly 140 target-date fund managers invested more than $1 million in their series as of year-end 2018. Of that 16, four of the six managers who run multiple series invest more in a higher-cost, legacy offering that relies predominantly on actively managed underlying holdings.

© 2019 RIJ Publishing LLC. All rights reserved.

Germany struggles with defined contribution

Contrary to popular belief, not all Europeans have cushy pensions. In the German state of North Rhine Westphalia, only 47% of those employed in the private sector are covered by a workplace savings plan. The country has been promoting voluntary defined contribution plans, but there’s still a big coverage gap.

The situation in North Rhine Westphalia’s motivated its labor and social affairs minister, Karl-Josef Laumann, to call for mandatory workplace pensions across the German federal republic, according to a report in IPE.com.

Laumann, a Christian-Democrat, said at the annual conference of the pension association aba (Arbeitsgemeinschaft für betriebliche Altersversorgung) that proposals to reduce the statutory state pension level for everyone makes no sense when only half of Germany’s workers can make up the shortfall by saving in occupational pensions.

Among low-income earners, he said, only 28% of those earning up to €2,500 ($2,804) a month were signed up for a workplace pension and just over half (52%) of those earning up to €4,500 ($5,047) had a workplace pension, compared to 71% of those earning above this level.

“We’re not reaching the low income earners with occupational pensions,” Laumann said.

“Where we no longer have collectively agreed wages, no one is thinking about workplace pensions—and that’s why I come to the conclusion that this won’t work with a voluntary-only approach.”

Germany’s workplace pension reform law of 2018, known as the BRSG, had led to some growth in coverage, said Heribert Karch, the outgoing chairman of aba. But coverage growth is still slow.

Around 56% of Germans in jobs that are subject to taxes for national insurance also had a workplace pension in 2018, Karch said, with current approaches set to take this to around 60% or 70% by 2030. That would represent an increase of around 30 percentage points in 30 years.

Germany has been moving toward establishment of defined contribution (DC) plans designed by trade unions and employer organizations through collective bargaining agreements, an arrangement known as the “social partner model.” Trade unions are expected to discuss that plan in the fall.

Like the US, Germany appears to be struggling to increase the future retirement security of its citizens while balancing the cost equitably among workers, employers and the government, as it transitions to a world where defined contribution plans are the only supplement for the basic state pension.

© 2019 RIJ Publishing LLC. All rights reserved.
Why Capitalism Needs Populism

Big Business is under attack in the United States. Amazon canceled its planned new headquarters in the New York City borough of Queens in the face of strong local opposition. Lindsey Graham, a Republican US senator for South Carolina, has raised concerns about Facebook’s uncontested market position, while his Democratic Senate colleague, Elizabeth Warren of Massachusetts, has called for the company to be broken up. Warren has also introduced legislation that would reserve 40% of corporate board seats for workers.

Such proposals may seem out of place in the land of free-market capitalism, but the current debate is exactly what America needs. Throughout the country’s history, it has been capitalism’s critics who ensured its proper functioning, by fighting against the concentration of economic power and the political influence it confers. When a few corporations dominate an economy, they inevitably team up with the instruments of state control, producing an unholy alliance of private- and public- sector elites.

This is what has happened in Russia, which is democratic and capitalist in name only. By maintaining complete control over commodity extraction and banking, an oligarchy beholden to the Kremlin has ruled out the possibility of meaningful economic and political competition. In fact, Russia is the apotheosis of the problem that US President Dwight D. Eisenhower described in his 1961 farewell address, when he admonished Americans to “guard against the acquisition of unwarranted influence” by the “military-industrial complex” and the “potential for the disastrous rise of misplaced power.”

With many US industries already dominated by a few “superstar” firms, we should be glad that “democratic socialist” activists and populist protesters are heeding Eisenhower’s warning. But, unlike in Russia, where the oligarchs owe their wealth to the capture of state assets in the 1990s, America’s superstar firms have gotten to where they are because they are more productive. This means that regulatory efforts have to be more nuanced—more scalpel than sledgehammer.

Specifically, in an era of global supply chains, US corporations have benefited from enormous economies of scale, network effects, and the use of real-time data to improve performance and efficiency at all stages of the production process. A company like Amazon learns from its data constantly to minimize delivery times and improve the quality of its services. Confident of its superiority relative to the competition, the firm needs few favors from the government—one reason why Amazon founder Jeff Bezos can back The Washington Post, which is often critical of the US administration.

But just because superstar firms are super-efficient today does not mean they will stay that way, particularly in the absence of meaningful competition. Incumbents will always be tempted to sustain their positions through anti-competitive means. By supporting legislation such as the 1984 Computer Fraud and Abuse Act and the 1998 Digital Millennium Copyright Act, the leading Internet firms have ensured that competitors cannot plug into their platforms to benefit from user-generated network effects.

Similarly, after the 2009 financial crisis, the big banks accepted the inevitability of increased regulations, and then lobbied for rules that just so happened to raise compliance costs, thereby disadvantaging smaller competitors. And now that the Trump administration has become trigger-happy with import tariffs, well-connected firms can influence who gets protection and who bears the costs.

More generally, the more that government-defined intellectual-property rights, regulations, and tariffs—rather than productivity—bolster a corporation’s profits, the more dependent it becomes on government benevolence. The only guarantee of corporate efficiency and independence tomorrow is competition today.

The pressure on the government to keep capitalism competitive, and impede its natural drift toward domination by a dependent few, typically comes from ordinary people, organizing democratically in their communities. Not possessing the influence of the elite, they often want more competition and open access. In the US, the late nineteenth century Populist movement and the early twentieth century Progressive movement were reactions to monopolization in critical industries such as railroads and banking.

These grassroots mobilizations led to regulations like the 1890 Sherman Antitrust Act, the 1933 Glass-Steagall Act (albeit less directly), and measures to improve access to education, health, credit, and business opportunities. By supporting competition, these movements not only kept capitalism vibrant, but also averted the risk of corporatist authoritarianism.

Today, as the best jobs drift to superstar firms that recruit primarily from a few prestigious universities, as small and medium-size companies find the path to growth strewn with impediments laid by dominant firms, and as economic activity abandons small towns and semi-rural communities for megacities, populism is emerging again. Politicians are scrambling to respond, but there is no guarantee that their proposals will move us in the right direction.

As the 1930s made clear, there can be much darker alternatives to the status quo. If voters in decaying French villages and small-town America succumb to despair and lose hope in the market economy, they will be vulnerable to the siren song of ethnic nationalism or full-bore socialism, either of which would destroy the delicate balance between markets and the state. That will put an end to both prosperity and democracy.

The right response is not revolution, but rebalancing. Capitalism needs top-down reforms, such as updated antitrust regulation, to ensure that industries remain efficient and open to entry, and are not monopolized. But it also needs bottom-up policies to help economically devastated communities create new opportunities and maintain their members’ trust in the market economy. Populist criticism must be heeded, even if the radical proposals of populist leaders are not followed slavishly. This is essential to preserving both vibrant markets and democracy.

Raghuram G. Rajan is professor of finance at the University of Chicago Booth School of Business and the author, most recently, of The Third Pillar: How Markets and the State Leave the Community Behind.

© 2019 Project-Syndicate.

It’s No Joke: The Fed’s Comic Book is Wrong

To teach young people “about basic economic principles and the Federal Reserve’s role in the financial system,” the New York Fed has published an Educational Comic Series. The pdfs of three of comic books are available for download from the New York Fed’s website.

These fanciful cartoon books use elements of science fiction (space travel, weird extraterrestrials, robots) to make the story of money entertaining and simple. But there’s a problem with the series. It repeats the myth that coins were invented to solve the inefficiencies of barter.

In one of the three books, “Once Upon a Dime,” the population of a planet called Novus barter with each other for what they need. A fisherman trades a fish for a jar of honey mustard. An E.T.-type swaps three small gears to a robot in exchange for the cakes the robot made. An octopus-like creature trades clock repair for a new pair of socks.

“This system of trading goods and services is called ‘barter’ and it works pretty well–as long as things don’t get too complicated,” the caption says.

The comic goes on to tell a familiar story, sometimes attributed to the 18th century Scottish economist Adam Smith: How coins (un-counterfeitable river stones, in this case) provided a common medium so that people could exchange goods for money at one place and time and then exchange that money for different goods at a different place and time.

In this telling, money gradually made large-scale commerce possible. People accumulated rocks and, when they had too many, banks were created to safeguard the accumulations. The banks loaned out the idle rocks at interest. Paper money and checks were later created to eliminate the need to carry hundreds of rocks.

Eventually, a central bank was needed. As credit expanded, inadvertent over-lending and defaults led to panics and bank runs. So the residents of Novus decided to create and fund a central bank that would serve as the banks’ bank. It would also monitor all the other banks so that they didn’t create too much or too little credit.

The inaccuracy—not just the over-simplification—of this version of the money-and-banking creation story has been known for at least a century. In 1913, British diplomat and economist Alfred Mitchell-Innes pointed out the shortcomings of the barter theory of money in two essays published in the Banking Law Journal. The first essay was called “What is Money?” The second, “The Credit Theory of Money.”

In Innes’ account, markets existed long before the introduction of metal coins. Trade was financed by credit and debt obligations based on a combination of IOUs, trust, reputation, laws and enforceable contracts. Most importantly, the development of large-scale commerce preceded the use of money by many centuries.

“The idea that to those whom we are accustomed to call savages, credit is unknown and only barter is used, is without foundation,” Innes wrote. “From the merchant of China to the Redskin of America; from the Arab of the desert to the Hottentot of South Africa or the Maori of New Zealand, debts and credits are equally familiar to all, and the breaking of the pledged word, or the refusal to carry out an obligation is held equally disgraceful.”

Scholarly research has since supported Innes’ premise. In his 2011 book, “Debt: The First 5,000 Years,” David Graeber writes, “There’s no evidence that [a barter economy] ever happened, and an enormous amount of evidence suggesting that it did not.” In a more recent example, Harvard law professor Christine Desan studied the history of the issuance of coins in Britain for her 2015 book, “Making Money: Coin, Currency, and the Coming of Capitalism,” and didn’t find support for the barter story.

It’s “a myth that money emerges naturally from the trades of enterprising individuals or their agreement on a common symbol of value,” she wrote. Coins, she discovered, were always in short supply, were not always durable, needed frequent revaluation, and were subject to hoarding. The big breakthrough in economics was, she found, was the 17th century discovery that governments (and, by extension, banks) could create large amounts of IOUs based on their anticipated receipt of taxes.

Desan characterizes modern money as a “political project” by which a sovereign government spends its IOUs (Treasury bonds, which pay interest, or Federal Reserve Notes, which don’t) into circulation and then cancels them as people and companies pay taxes. At the retail level, the government licenses banks to create dollar deposits out of thin air when they make loans, allow them to circulate at interest, and then extinguish the liabilities when borrowers repay the loans.

Does it make a difference whether we think that merchants spontaneously created gold coins and other “commodity money” to replace barter or whether we think of it as government-backed credit money (like the Continental dollars printed in the Revolutionary War, the greenbacks printed in the Civil War, or the “expansion of the Fed balance sheet” by trillions of dollars during the financial crisis)?

It makes a big difference. If money is a commodity originating in the private sector, then taxes can be characterized as confiscation—something parasitic to be resisted and avoided. But if a nation’s money is a kind of public utility, where the government and banks release money that never existed before, then taxes are essential. They complete the cycle of credit creation and destruction on which the global economy runs.

Your politics, in fact, is likely to be determined by the version of the story you believe. Whether you think that Social Security can or can’t “run out of money,” or whether you believe private banks should receive more or less government oversight, depends on whether you think money is primarily a private, a public matter, or both.

Desan thinks that we, as Americans, need to get the story right. Otherwise, we won’t be able to make smart decisions about our financial future. We’ve lost the “visibility of money as a political project,” she writes. With that disappearance, we also lost our ability to discuss “the role of fiscal action in supporting the value of money, the distributive stakes in the modern arrangement, and the alignment of rights and interests acted out in the ethics of capitalism. That absence, a void of history and theory, undermines the effort so urgent to our present moment to understand the political economy we inhabit.”

[Note: A spokesman for the New York Fed told RIJ this week that the central bank has been publishing educational comic books intermittently since the 1950s. He said he didn’t know if the comic books were historically accurate or inaccurate. The content of the newest comic books may have been based on the content of the older comic books, he said, which were written when the barter story still went largely uncontested.

© 2019 RIJ Publishing LLC. All rights reserved.

To Defer or Not To Defer (SPIA or DIA)?

Annuities are curious instruments. The garden-variety annuity is the immediate life annuity—hereafter, the IA. Beloved by most economists, it is ignored or distrusted by most everybody else. As this article will show, it is actually the cheapest way to generate secure retirement income, provided the retiree can accept the illiquidity entailed by an IA’s upfront purchase requirement.

The IA in its simplest form is a contract with an insurance company, in which, in return for a fairly hefty upfront payment, the insurance company pays the annuitant a monthly sum after the contract is signed that lasts as long as the annuitant does. If payments start at age 66, and the annuitant dies at age 67 (and if the contract has no cash refund or period certain feature), that’s it; the payments end. If, on the other hand, the annuitant lives to age 100, or for 35 x 12 months, the insurance company is stuck with 420 monthly payments.

The IA has never been popular with Americans, even those with enough money to be able to buy one. In part, this is because an IA does not come cheap. For a guaranteed monthly income of only, say, $800 per month, a 65-year old male would have to pay about $143,000 today (or $156,000 if the contract has a cash refund feature). Since the life expectancy of a 65-year-old male these days is about 20 years, an insurance company cannot count on the premature death of its annuitants to lower the cost of its contingent liability.

The lack of popularity of IAs means that for most Americans, the only guaranteed lifetime income they will receive in their advancing years is the benefit that Social Security provides, which pays out like an IA, but is also indexed to consumer prices. Social Security is not only the only source of lifetime income for older Americans; for the majority, its present value (if it were possible to capitalize the flow of Social Security payments) would account for most or much of their wealth.

IAs should have a real appeal to many older Americans, since the greater the share of wealth they represent, the less an older American has to worry that his or her retirement nest egg will run out if she lives to an advanced old age. IAs have a survival-contingent annual yield that is higher than that of a more conventional financial instrument.

To grasp this, consider that an IA is like a contingent bond: an investor making a choice between an instrument paying a given sum that continues to have value after her death and one that simply stops paying at that point, will pay more for (i.e., it will cost more than) the first type of instrument. But for as long as the annuitant stays alive, she will get a higher return on the IA. This differential increase with the starting age of the annuitant, because life expectancy declines with that age.

But what about the price of an IA, and the pain of giving up access to more than $100,000? The question arises as to whether these are stumbling blocks. Enter the IA’s less well-known cousin, the deferred annuity (DA), which typically doesn’t begin to pay out until the owner reaches an advanced age, like 81.

A stream of income of $800 per month beginning at age 81 when purchased at age 65 in the form of a DA might cost only about $35,000 (or $43,000, if there’s a cash refund feature). That gives the retiree protection against late-life poverty while providing about $100,000 more liquidity. Thus, the same survival-contingent income stream ($800), with no payments until age 81, costs much less than an IA, because of the smaller likelihood that the insurance company will have to pay out anything. If death occurs before age 81, there is no payment whatsoever, and the odds that payments will continue for many years even if the annuitant makes it to age 81 are not great.

So, it might appear that a DA gives us the best of both worlds: protection against poverty in advanced old age, and liquidity in the meantime. But that which glitters is often iron pyrite. Let’s make the reasonable assumption that our hypothetical annuitant also wants a risk-free income of $800 per month over the period from age 65 through age 80. If not provided by an annuity, it will have to be provided by a more conventional financial investment.

Assuming a rate of return on risk-free investments of three percent, and not taking account of the cost (including profit margins and sales commissions) of the conventional investment the upfront cost of this 15-year income stream will be about $115,000.

It can be seen—and will always be true—that the cost of an IA that provides income for life starting at age 65 will be less than the sum of the cost of the DA and the conventional investment.

Let’s do the math. Remember we are assuming, to avoid an apples and oranges comparison, that the conventional investment is risk-free, and therefore has a lower expected return than an investment like a S&P500 mutual fund. (We are also working with the actuarial values of both annuities and ignoring the costs of either type of investment. This should not affect the basic conclusion of the comparison.)

Working in years, not months, and letting r stand for the risk-free rate of interest, Pi stand for the probability of survival from age 65 to age i, FTCA stand for the fixed-term contingent annuity, DA stand for the deferred annuity, and CI stand for the conventional investment, their costs per dollar of income are given by:

FTCA = P66/(1+r) + P67/(1+r) + P68/(1+r)2+ P69/(1+r)3 + …. + P80/(1+r)15

DA = P81/(1+r)16 + P82/(1+r)17 + P83/(1+r)18+ P84/(1+r)19 + …. + P100/(1+r)35

CI = 1/(1+r) + 1/(1+r)2+ 1/(1+r)3+ 1/(1+r)4 + …+ 1/(1+r)15

The cost of the IA is the sum of FTCA and DA. This has to be less than the sum of CI and DA, because all the P terms are less than one. In other words, if you set costs aside, the value of the contingent annuity must be less than the cost of the conventional investment. You can’t get a higher return on the conventional investment without taking more risk. And if you take more risk, you lose the predictability that comes with a guaranteed income stream.

Focusing on the low price of a DA can distract us and make us forget that if we want a given income when we are really old and grey, we might also want the same income during the first part of our golden years.

© 2019 RIJ Publishing LLC. All rights reserved.

Honorable Mention

Loans from 401(k)s still declining: T. Rowe Price

The use of 401(k) loans reached a nine-year low of 22.5% in 2018, and continued a steady six-year decline of nearly 10%, according to T. Rowe Price’s annual participant data benchmarking report, Reference Point.

The report also found that the percentage of participants who took a hardship withdrawal fell for the ninth consecutive year, declining from 1.9% in 2010 to 1.3% in 2018. Meanwhile, both loan balances and the average amount of hardship withdrawals increased.

Additional findings include:

  • Participation declined slightly. The participation rate dropped by nearly 2% from 2017 to 2018. Plans that did not have auto-enrollment saw participation drop at more than twice the rate of those without auto-enrollment.
  • Auto-enrollment continued to significantly impact positive participant behavior. Participation was over 40 percentage points higher in plans with auto-enrollment compared with plans without it.
  • Pretax deferral rates continued to rise. The average pretax deferral rate increased slightly to 8.6%, reaching the all-time high for a second year in a row.
  • Employer match increased. Plans offering a 4% employer match surpassed those offering a 3% match for the first time. The reduction of the corporate tax rate due to tax reform may have contributed to the increase.
  • Plan adoption and participant usage of target date products reached an all-time high. Plan adoption of target date products reached an all-time high at 95%. Participant usage also increased in 2018 across all age groups but was highest among younger workers. Additionally, the percentage of participants with their entire account balance in a target date product has grown by 20% since 2014.
  • 401(k) Roth contributions increased. The number of participants making Roth contributions increased by nearly 10% compared with 2017; however, overall usage remains low at 7.6%. Millennials age 30–39 are using Roth the most, at nearly 10%, with younger workers age 20–29 following at 8.8%. In 2018, nearly 75% of plans offered the Roth option.

Data are based on the large-market, full-service recordkeeping universe of T. Rowe Price Retirement Plan Services, Inc., retirement plans (401(k) and 457 plans), consisting of 657 plans and over 1.8 million participants, from January 1, 2007, through December 31, 2018.

Securian to offer individual annuities in the bank channel

Securian Financial has entered the bank distribution channel for individual annuities with customized products and a new sales team, Chris Owens, Securian Financial’s national sales vice president for retail life insurance and annuities, announced this week.

According to LIMRA, bank channel individual annuity sales in the U.S. were $41.5 billion in 2018, an 18% increase over 2017 sales, Securian said. Banks “have many risk-averse clients who traditionally purchase CDs. Annuities are an increasingly attractive alternative for bank advisors interested in generating a higher return on their clients’ investments,” said Owens in the release.

Securian Financial hired Kate McLees Hannon and Karl Krause as regional sales vice presidents. The company plans to hire four more regional sales vice presidents for the bank channel by year’s end.

Securian Financial will offer bank customers all of its individual fixed, indexed, variable and immediate income annuities, as well as annuities with accelerated death benefit features for clients concerned about the potential costs of chronic or terminal illness. Securian Financial is also developing specific annuity products for banks.

Securian Financial’s immediate income annuity, underwritten by Minnesota Life Insurance Company, was ranked by Barron’s magazine as the best product in the three varieties of immediate income annuities the publication researched: immediate life only annuity, immediate 10 year-certain annuity and immediate cash installment refund annuity. Securian Financial’s MyPath Ascend 2.0 variable annuity, underwritten by Minnesota Life Insurance Company, was ranked the third-best product in the variable annuity category by Barron’s.

Securian Financial describes itself as the eighth largest life insurance company in the United States based on total life insurance in force. The company had $78.5 billion in assets under management at the end of 2018 and ranked #462 on the 2018 Fortune 500.

Securian Financial has a 95 Comdex ranking, which puts it in the top 5% of companies with a Comdex rating, the release said. The Comdex rating is an average percentile of a company’s ratings from independent rating agencies that analyze the financial strength and claims-paying ability of insurance companies.

‘Bucketing’ software, by subscription, for professionals and amateurs

Investment Link, a Southfield, MI-based registered investment advisor (RIA) and financial software firm, has launched a subscription-based web-based decumulation planning platform that employs the “bucket” or time-segmentation system to create retirement income,

The service, intended for advisors and investors, is called The Retirement Buckets Income Plan. The advice consists of two parts: Planning Advice with risk management through Retirement Buckets, and Investment Advice with risk management through Target Volatility Portfolios.

Investment Link is led by Henry Ilyasov, a 46-year-old certified financial planner who worked for Ameriprise from September 2004 to March 2018, when he started his current company, according to his LinkedIn page.

The subscription service is available at three price points: The basic “registered” service, at no monthly fee, includes a Social Security calculator and “savings advice.” A “standard” service ($23.99 a month or $239 per year) offers those services plus “planning advice.” A “premium” service ($29.99 a month or $299 per year) that in addition offers “investment advice.”

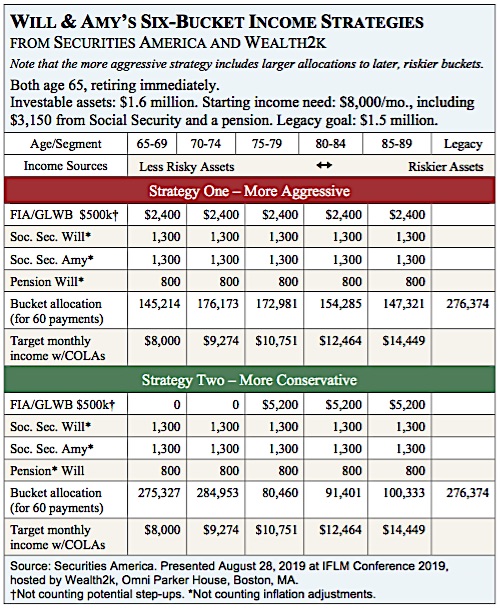
Bucketing platforms for advisors have been around for some time. The Income for Life Model (IFLM) from Wealth2k has been available for over a decade. WealthConductor, which offers the IncomeConductor bucketing software, was founded in 2017.

© 2019 RIJ Publishing LLC. All rights reserved.
Top earners in US own mid-sized businesses

Most households in the top 0.1% of the income distribution receive more income from their human capital than from their financial capital, according to a new paper from the National Bureau of Economic Research.

But, according to the paper, Capitalists in the Twenty-First Century (NBER Working Paper No. 25442) by Matthew Smith, Danny Yagan,Owen M. Zidar, and Eric Zwick, tax planning by business owner-managers has obscured understanding of how typical top earners make money. Their human capital income may reflect “socially beneficial hard work or socially harmful rent capture and uncompetitive behavior,” they wrote.

The primary source of top income is usually not recorded as wage income, but as tax-favored private business profit. The researchers estimate that 75% of the business profits reported by this group can be attributed to human capital— namely, returns on business owners’ intellectual and physical efforts, whether socially beneficial or not—rather than financial capital investments.

They derive this figure by comparing the performance of firms that have lost their owners through retirement or premature death with that of comparable firms that have not experienced these shocks.

IRS changes dating back to the 1980s provide an incentive for owners of pass-through businesses—partnerships and S-corporations—to receive income as business profits rather than wages. To the extent that pass-through profits are in fact disguised wages, they can distort traditional measurements of labor and capital income.

Today, up to the 99th percentile of the income distribution, wage income dominates. At the very top of the distribution, in the top 0.1%, business income is more important than either wage income or investment returns. In this elite group of households, fewer than 13% rely primarily on interest, rents, and other capital income.

Who are the human-capital rich? More than 70% are under age 60. They own mid-size companies in the white-collar, skilled service industries. Near the top—the 99th to 99.9th percentile—they typically own single establishments that offer consulting, legal, medical and other highly specialized services. Among the top 0.1%, above the 99.9th percentile, the typical company is an auto dealership, beverage distributor, or large law firm.

The researchers acknowledge that elite earners could be erroneously labeled as human-capital rich if they are drawing money from a family-owned pass-through company to avoid estate taxes. To identify top earners who are unlikely to be wealthy heirs, they examine the earnings of parents of top earners born from 1980 to 1982. Children whose parents were in the bottom 99% of the income distribution are unlikely to be wealthy heirs. The researchers find that most young top earners are children of parents from the bottom 99%, so their results are unlikely driven by erroneously labeled wages of wealthy heirs.

The growth of income from pass-through entities has contributed to widening income inequality in the last two decades. The profits of pass-through owners rose during the 2001-14 study period, as they benefited both from increased labor productivity and from their widening share of the value added by their workforces. In other words, owners claimed an increasingly large slice of a growing pie. Among top 1% firms, that slice grew from 37% to 48%; for top 0.1% firms, it grew from 40% to 52%.

© 2019 National Bureau of Economic Research.

Wages are rising, but so is productivity

The ADP survey (see chart below) shows an impressive correlation with the private sector portion of the payroll employment data to be released a couple of days later. And well it should. ADP, or Automatic Data Processing, Inc. is a provider of payroll-related services. Currently, ADP processes over 500,000 payrolls, for approximately 430,000 separate business entities, covering over 23 million employees. The survey has been in existence since January 2001, and its average error has been 65 thousand. So while it is not perfect, it does have a respectable track record.

The ADP survey said that employment jumped 275,000 in April after having risen 151,000 in March after having climbed by 220,000 in February. In the most recent 3-month period employment has risen 215,000. On Friday we expect the BLS to report that private sector employment rose about 190,000 in April.

Jobs in goods-producing industries rose 56,000 in April after having fallen 1,000 in April. Construction employment rose 49,000, mining fell by 2,000, and manufacturing rose 5,000. Service providers boosted payrolls by 223,000 in April after having climbed 152,000 in March. The April increase was led by an increase of 59,000 in professional and business jobs, 46,000 in health care, 25,000 in administration and support, 9,000 in education, 53,000 jobs in leisure and hospitality, 37,000 jobs in trade, transportation, and utility workers, and 6,000 in financial services.

With the labor force rising very slowly, employment gains of 200,000 or so will continue to slowly push the unemployment rate lower. The unemployment rate currently is 3.8%, well below the full employment threshold. As a result we are beginning to see more and more shortages of available workers.

However, at this point most of the upward pressure on wages is being countered by a corresponding increase in productivity. Over the past year unit labor costs, or labor costs adjusted for the increase in productivity rose 1.0%. Despite the seemingly tight labor market there is little upward pressure on the inflation rate.

The stock market has rebounded and is now at a record high level. Interest rates will remain steady through the end of the year. Consumers remain confident. Corporate earnings are solid. The economy is still receiving some stimulus in the form of both individual and corporate income taxes. Thus, our conclusion is that the economy will expand by 2.7% in 2019 after having risen 3.0% last year.

The Conference Board reported that consumer confidence jumped 5.2 points in April to 129.4 after falling 7.2 points in March. This series reached a high of 137.9 in October. It is somewhat lower than that currently, but its level remains solid and is roughly in line with where it was for most of last year.

Lynn Franco, Director of Economic Indicators at the Conference Board said, “Overall, consumers expect the economy to continue growing at a solid pace into the summer months. These strong confidence levels should continue to support consumer spending in the near-term.”

Confidence data reported by the Conference Board are roughly matched by the University of Michigan’s series on consumer sentiment. As shown in the chart below, trends in the two series are identical but there can be month-to-month deviations. Both series remain at very lofty levels.

The consumer should continue to provide support for overall GDP growth in 2019. The stock market struggled for several months late last year but has rebounded and reached a new record high level. The economy continues to crank out 190,000 jobs per month. Consumer debt in relation to income remains low. Interest rates remain low and the Fed has now ceased its series of rate hikes. We anticipate GDP growth of 2.7% in 2019 after having risen 3.0% last year.

The employment cost index for civilian workers climbed at a 3.0% rate in the first quarter after climbing at a 2.7% pace in the fourth quarter. Over the course of the past year it has risen 2.8%. Thus, the labor market continues to get tighter, and to attract the workers that they want firms are having to work employees longer hours, and offer higher wages and/or more attractive benefits packages.

With the unemployment rate at 3.8% and full employment presumably at 4.5%, it is not surprising that we are beginning to see a hint of upward pressure on compensation.

Wages climbed at a 3.0% race in the first quarter following a 2.4% gain in the fourth quarter. Over the course of the past year wages have been rising at a 2.8% pace. Benefits climbed at a 2.6% pace in both the fourth quarter of last year and in the first quarter of 2019. As a result, the yearly increase in benefits is now 2.7%.

What happens to labor costs is important, but what we really want to know is how those labor costs compare to the gains in productivity. If I pay you 3.0% more money but you are 3.0% more productive, I really don’t care. In that case, “unit labor costs”—labor costs adjusted for the change in productivity—were unchanged.

Currently, unit labor costs have risen 1.0% in the past year as compensation rose 2.8% while productivity increased by 1.8%. We expect compensation to climb to about the 3.7% mark this year, but at the same time we expect productivity to rise by 1.9%. Thus, unit labor costs at the end of 2019 to be rising at a 1.8% rate which means that there will be little if any upward pressure on the inflation rate in 2019 stemming from the tight labor market. A 1.8% increase in ULC’s is clearly compatible with the Fed’s 2.0% inflation target.

© 2019 Numbernomics.

Honorable Mention

UK pensions race to de-risk before Brexit

Prudential Retirement, a unit of Prudential Financial, Inc., has concluded about $2.6 billion in previously undisclosed longevity reinsurance contracts in the U.K. pension risk transfer market so far in 2019. As part of these transactions, Prudential Retirement is assuming the longevity risks of approximately 16,000 pensioners.

Many UK pensions are seeking to close agreements prior to the original March 29 Brexit deadline, a Prudential release said. But the recent extension of the Brexit deadline to late October, pensions have an unexpected window to move forward and de-risk.

Demand for de-risking solutions has also been driven by the robust funded status of U.K. schemes, which have improved markedly since 2016, the release said. The funding level of the average U.K. pension scheme stood at 100.1% on March 29.

“Pension schemes that can afford to de-risk have raced forward in the opening months of 2019, taking advantage of the window before Brexit to reduce their risks and lock in gains,” said Amy Kessler, head of longevity reinsurance at Prudential Financial, in the release. “Brexit brings increasing levels of uncertainty that could wash away recent market gains and funding improvements, putting de-risking out of reach for those with lower hedge ratios. But with funding at the highest levels in a decade, pensions are de-risking at an unprecedented pace.”

“Another impetus to de-risk is the notable decline in U.K. mortality rates during the last 10 months,” said Christian Ercole, vice president at Prudential Financial. “The resulting level of market activity favors insurers and reinsurers who have invested in their pricing and analytics teams, and it also favors pension funds that come prepared with credible and complete data.”

Prudential said it has completed more than $60 billion in international reinsurance transactions since 2011, including the largest on record, a $27.7 billion transaction involving the BT Pension Scheme.

‘The environment’ ranks low when choosing investments: Allianz Life

When deciding whether to invest in or do business with a company, U.S. investors give its social and governance behavior as much or more weight than its environmental record, according to Allianz Life’s ESG Investor Sentiment Study.

The study also found that most consumers believe companies focused on ESG issues have better long-term prospects.

When asked about the importance of a variety of ESG topics in their decisions to invest in a company, 73% of American consumers noted environmental concerns like natural resource conservation or a company’s carbon footprint/impact on climate change.

However, the same percentage emphasized social issues such as working conditions of employees or racial/gender equality, and 69% highlighted governance topics like transparency of business practices and finances or level of executive compensation.

About a third (34%) of respondents said a company’s stance on social issues was the most important factor in their decision to do business with a company, followed by 27% who ranked corporate governance issues as the top priority. Only 22% cited a company’s record on environmental issues as their chief concern.

Nearly 80% of those surveyed said they “love the idea of investing in companies that care about the same issues” they do, and 74% believe an ESG investment strategy is “not only one that you can feel good about, but one that makes long-term financial sense.” A full 71% percent also said they would stop investing in a company if it behaved in ways they consider unethical.

A significant gap still exists, however, actions and words. More than three-quarters of respondents (76% to 84%) said safe working conditions for employees, transparency in business practices and finances, living wages to employees, quality health insurance offerings, and natural resource conservation were important to them. Yet, fewer than half (40% to 44%) said they chose to invest/not invest based on those same business practices.

Investors more often choose to reward companies for good behavior rather than punish them for bad behavior.

Among the 16 ESG issues highlighted in the study, 11 issues were more influential in investors’ decision to actively invest, including carbon footprint/impact on climate change, charitable contributions, and involvement in reducing poverty and wages provided to employees. Only two issues were more influential in causing people to stop investing in a company: animal testing and donations to political candidates/PACs.

A complete list of ESG issues that impact investment decisions, as well as additional data from the ESG Investor Sentiment Study, can be found at www.allianzlife.com/ESG.

OASDI reserves rise $3 billion and gain a year of viability

The financial health of the OASDI (Old Age and Survivors Insurance and Disability Insurance) program improved a bit last year, its Board of Trustees announced this week. The combined asset reserves of the OASI and DI Trust Funds increased by $3 billion in 2018 to a total of $2.895 trillion.

The Social Security reserves are projected to run out in 2034, the same as last year’s estimate, with 77% of promised benefits payable at that time. The DI reserves are estimated to run out in 2052–20 years from last year’s estimate of 2032–with 91% of benefits still payable.

In their 2019 Annual Report to Congress, the Trustees announced:

In 2020, for the first time since 1982, the total annual cost of the program is projected to exceed revenue. The cost will remain higher throughout the 75-year projection period. Reserves are expected to decline during 2020. Social Security’s cost has exceeded its non-interest income since 2010.

The year when the combined trust fund reserves are projected to become depleted, if Congress does not act before then, is 2035 – gaining one year from last year’s projection. At that time, there would be sufficient income coming in to pay 80% of scheduled benefits.

“The Trustees recommend that lawmakers address the projected trust fund shortfalls in a timely way in order to phase in necessary changes gradually and give workers and beneficiaries time to adjust to them,” said Nancy A. Berryhill, Acting Commissioner of Social Security.

“The large change in the reserve depletion date for the DI Fund is mainly due to continuing favorable trends in the disability program. Disability applications have been declining since 2010, and the number of disabled-worker beneficiaries receiving payments has been falling since 2014.”

Other highlights of the Trustees Report include:

Total income, including interest, to the combined OASI and DI Trust Funds amounted to just over $1 trillion in 2018, including $885 billion from net payroll tax contributions, $35 billion from taxation of benefits, and $83 billion in interest. Total expenditures from the combined OASI and DI Trust Funds amounted to $1 trillion in 2018.

Social Security paid benefits of nearly $989 billion in calendar year 2018. There were about 63 million beneficiaries at the end of the calendar year.

The projected actuarial deficit over the 75-year long-range period is 2.78% of taxable payroll – lower than the 2.84% projected in last year’s report. During 2018, an estimated 176 million people had earnings covered by Social Security and paid payroll taxes.

The cost of $6.7 billion to administer the Social Security program in 2018 was a very low 0.7% of total expenditures. The combined Trust Fund asset reserves earned interest at an effective annual rate of 2.9% in 2018.

The Board of Trustees usually comprises six members. Four serve by virtue of their positions with the federal government: Steven T. Mnuchin, Secretary of the Treasury and Managing Trustee; Nancy A. Berryhill, Acting Commissioner of Social Security; Alex M. Azar II, Secretary of Health and Human Services; and R. Alexander Acosta, Secretary of Labor. The two public trustee positions are currently vacant.

View the 2019 Trustees Report at www.socialsecurity.gov/OACT/TR/2019/.

CBO expects slower real GDP growth in 2019

In CBO’s projections, the federal budget deficit is about $900 billion in 2019 and exceeds $1 trillion each year beginning in 2022. Over the coming decade, deficits (after adjustments to exclude shifts in the timing of certain payments) fluctuate between 4.1% and 4.7% of gross domestic product (GDP), well above the average over the past 50 years.

CBO’s projection of the deficit for 2019 is now $75 billion less—and its projection of the cumulative deficit over the 2019–2028 period, $1.2 trillion less—than it was in spring 2018. That reduction in projected deficits results primarily from legislative changes—most notably, a decrease in emergency spending.

Because of persistently large deficits, federal debt held by the public is projected to grow steadily, reaching 93% of GDP in 2029 (its highest level since just after World War II) and about 150% of GDP in 2049—far higher than it has ever been. Moreover, if lawmakers amended current laws to maintain certain policies now in place, even larger increases in debt would ensue.

Real GDP is projected to grow by 2.3% in 2019—down from 3.1% in 2018—as the effects of the 2017 tax act on the growth of business investment wane and federal purchases, as projected under current law, decline sharply in the fourth quarter of 2019. Nevertheless, output is projected to grow slightly faster than its maximum sustainable level this year, continuing to boost the demand for labor and to push down the unemployment rate.

After 2019, annual economic growth is projected to slow further—to an average of 1.7% through 2023, which is below CBO’s projection of potential growth for that period. From 2024 to 2029, economic growth and potential growth are projected to average 1.8% per year—less than their long-term historical averages, primarily because the labor force is expected to grow more slowly than it has in the past.

© 2019 RIJ Publishing LLC. All rights reserved.
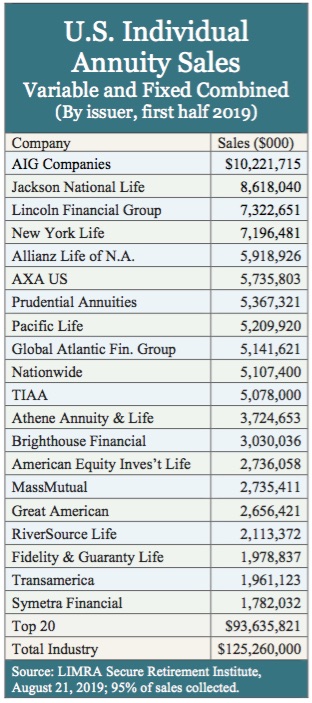
The Reason for SPIAs, from Pfau and Finke

The benefits of using income annuities in retirement is the topic of a new whitepaper, written by Michael Finke and Wade Pfau of The American College and sponsored by Principal Financial Group. This paper provokes a couple of observations.

First, Principal is a publicly held retirement company. It’s promoting income annuities. That’s slightly counter-intuitive, since public life insurers usually don’t promote income annuities. They prefer indexed or variable annuities.

Second, the whitepaper provides a rationale for income annuities that we’ve all heard many times before, from the same credible sources. Why does the income annuity story need constant retelling?

Let’s address that second observation first. Does the Boomer audience not understand the value of longevity risk pooling? Are they not listening? Are the competing voices simply louder? Or has the no one yet written a slogan or tag line powerful enough to compel near-retirees to think about buying an annuity—any annuity?

As a writer of annuity marketing/educational materials for nine years, I struggled to compose a phrase or a sentence whose mere utterance would buckle knees nationwide, and awaken people in cities, towns, suburbs, and rural villages to the atomic power of mortality credits.

I tried humor. I paired an existing tag line (“We guarantee you won’t outlive your income”) with the vintage photo of a 19th century lynch mob about to hang a horse thief from a cottonwood tree. No one thought that was even worth sharing with the rest of the marketing team, let alone the compliance department. “Don’t eat cat food in retirement!” was more popular.

But sometimes I felt close to a solution. There were days when I thought phrases like “personal pension” or “retirement paycheck” would begin to open doors and close deals. I tried concepts like:

Annuities: The most income, the lowest cost.

Get more bang for your retirement buck.

As much income as the 4% rule, at two-thirds the cost.

Put half your money in an annuity–and invest the rest in stocks.

Cut the cost of retirement by 30%. Here’s how.

Is retirement keeping you up at night? An annuity can help you sleep tight.

But none had the stuff that makes a slogan immortal. I wanted to convey what few people realize: that the monthly payments from a fixed income annuity contain a bit of appreciation, a bit of principal and a risk-pooling credit that accrues not only to those who live an extra long time, but to every contract owner in every payment, starting with the first one. You get “cash back rewards” from dead people even if you don’t outlive them!

Well, you can see why I left marketing and went back to journalism.

Principal’s whitepaper reinforces what is largely self-evident by now—that longevity insurance can lower your risk of running short of money in your old age—with mathematical projections and Monte Carlo simulations from two of America’s leading retirement professors.

In the paper, Finke and Pfau, the chief academic officer and director of the Retirement Income Certified Professional program at The American College, respectively, offer three hypothetical cases:

  • Case 1: A married couple ten years before retirement.
  • Case 2: A married couple at their retirement date.
  • Case 3: A widow ten years into retirement.

In each case, the clients were assigning $100,000 to the creation of a monthly income. Finke and Pfau demonstrated that if they put half of that money into either a deferred income annuity (Case 1) or a single-premium immediate annuity (Cases 2 and 3) they could produce the desired income (from annuity payments and distributions from savings) with much less risk of running short of money by age 95 than if they put the entire $100,000 in a 40% stock, 60% bond portfolio.

Pfau and Finke’s calculations showed that even if future market returns were either average or above-average, the half-annuity strategy still produced more residual wealth at age 95 than the systematic withdrawal plan did. (The argument for an all-investment approach might have looked stronger if the allocation to stocks were 60% instead of 40% and the expected longevity was 85 instead of 95. But that would have made the market risk and longevity risk of that approach higher than the risks of the half-annuity approach.)

The dilemma facing income annuity issuers is that few investors hear this kind of presentation. Some advisors do offer income annuities when a client clearly can’t meet his income goals without one. But most agents and advisers would rather sell products that pay higher commissions; they may also avoid recommending income annuities because they can’t charge a management fee on their value.

So retirees rarely see side-by-side comparisons of several income-generation methods at once. At the same time, most public life insurers would rather sell variable or index annuities, which are more profitable. As a result, captive or affiliated agents at mutual companies tend to sell most income annuities.

So why does Principal, a public company, promoting income annuities? Because, despite having gone public in 2001, it still behaves like a mutual. It also still has an affiliated cadre of advisor representatives, Principal Advisor Network, in addition to third-party distribution.

“For a long time, we were a mutual insurance company in the heart of the Midwest, with Main Street values,” said Sri Reddy, senior vice president of retirement and income solutions at Principal since last summer. “We’re a public company that’s still based on the idea of serving Main Street America. That ethic guides the way we behave. Our products—SPIAs, DIAs and our Personal Pension Builder for retirement plans—are plain vanilla. There are still a lot of mutual-era people here. Our chairman and CEO, for instance, has been here for 35 years.”

Hence Principal’s sponsorship of a whitepaper on SPIAs and DIAs. “We said, ‘Let’s have some academics take a look at this problem and see if you can drive the efficient frontier up to the left a bit with income annuities,” said Reddy. In other words, could income annuities help deliver more income in retirement for the same or less risk than a balanced investment portfolio?

Before joining Principal nine months ago, Reddy was a senior executive in Prudential Retirement, in charge of promoting IncomeFlex, a guaranteed lifetime withdrawal benefit for plan participants. Now he’s promoting income annuities to advisors and to Principal’s plan participants. (Principal’s recent acquisition of Wells Fargo’s retirement business makes it the third largest US retirement plan provider in numbers of participants, after Fidelity and Empower.)

“The guaranteed lifetime withdrawal benefit has a role to play for investors in the years leading up to retirement,” Reddy told RIJ. “It takes market risk off the table. But the income annuity is for people entering retirement today and creating income today.” I noticed, by the way, that the title of Principal’s whitepaper is It’s more than money. As annuity tag lines go, that’s not bad.

© 2019 RIJ Publishing LLC. All rights reserved.

A retirement readiness tool from Alliance for Lifetime Income

The Alliance for Lifetime Income, a retirement industry trade group that includes most of the publicly held life insurers, as well as Milliman, the actuarial firm, have created an online wizard to help people quantify their retirement preparedness.

The Alliance needs an immediate publicity boost. Its sponsorship of the Rolling Stones “No Filter” U.S. tour is hampered by Mick Jagger’s illness, which forced the band to announce last month that it couldn’t begin the tour on April 20 in Miami as planned. A press release said the Stones expected to reschedule the tour.

Called the “Retirement Income Security Evaluation,” or RISE Score, it’s one in a series of efforts by the Alliance to promote products that generate guaranteed lifetime income. The Alliance represents 24 life insurers, asset managers and other firms in the retirement industry.

Based on responses to questions about guaranteed income sources, savings, and expenses in retirement, the RISE Score ranges from 0 to 850, analogous to a FICO credit score. (One person used the tool and received a “good” score of 650-699. The wizard also told the user that her “Income Coverage” ratio was 74% to 87%. In other words, her expected income in retirement from all sources, including portfolio withdrawals, could

“cover 87% of expenses in average scenarios and 74% of expenses in the worst 10% of scenarios. The expected income in retirement, excluding portfolio withdrawals, may cover 58% of expenses in average scenarios and 58% of expenses in the worst 10% of scenarios.”

According to a press release from the Alliance, all inputs to the RISE Score are anonymous and the tool doesn’t require consumers to provide any personally identifiable information.

To learn more about the RISE Score, please visit retireyourrisk.org/rise-score.

The Alliance for Lifetime Income members include insurers AIG, AXA, Allianz, Brighthouse, Global Atlantic, Jackson National Life, Lincoln Financial, MassMutual, Nationwide, Pacific Life, Protective, Prudential Financial, State Farm, TIAA, Transamerica and T. Rowe Price. Asset managers include Capital Group/American Funds, Franklin Templeton, Goldman Sachs Asset Management, Invesco, J.P. Morgan Asset Management, Macquarie, and State Street Global Advisors. Another member, Milliman, an actuarial firm, is a risk management consultant for many of those companies.

© 2019 RIJ Publishing LLC. All rights reserved.