Archives: Articles

IssueM Articles

In Defense of the Fed

I have not been a fan of the policies of the US Federal Reserve for many years. Despite great personal fondness for my first employer, and appreciation of all that working there gave me in terms of professional training and intellectual stimulation, the Fed had lost its way. From bubble to bubble, from crisis to crisis, there were increasingly compelling reasons to question the Fed’s stewardship of the US economy.
That now appears to be changing. Notwithstanding howls of protest from market participants and rumored unconstitutional threats from an unhinged US president, the Fed should be congratulated for its steadfast commitment to policy “normalization.” It is finally confronting the beast that former Fed Chairman Alan Greenspan unleashed over 30 years ago: the “Greenspan put” that provided asymmetric support to financial markets by easing policy aggressively during periods of market distress while condoning froth during upswings.

Since the October 19, 1987 stock-market crash, investors have learned to count on the Fed’s unfailing support, which was justified as being consistent with what is widely viewed as the anchor of its dual mandate: price stability. With inflation as measured by the Consumer Price Index averaging a mandate-compliant 2.1% in the 20-year period ending in 2017, the Fed was, in effect, liberated to go for growth.

And so it did. But the problem with the growth gambit is that it was built on the quicksand of an increasingly asset-dependent and ultimately bubble- and crisis- prone US economy.

Greenspan, as a market-focused disciple of Ayn Rand, set this trap. Drawing comfort from his tactical successes in addressing the 1987 crash, he upped the ante in the late 1990s, arguing that the dot-com bubble reflected a new paradigm of productivity-led growth in the US. Then, in the early 2000s, he committed a far more serious blunder, insisting that a credit-fueled housing bubble, inflated by “innovative” financial products, posed no threat to the US economy’s fundamentals. As one error compounded the other, the asset-dependent economy took on a life of its own.

As the Fed’s leadership passed to Ben Bernanke in 2006, market-friendly monetary policy entered an even braver new era. The bursting of the Greenspan housing bubble triggered a financial crisis and recession the likes of which had not been seen since the 1930s. As an academic expert on the Great Depression, Bernanke had argued that the Fed was to blame back then. As Fed Chair, he quickly put his theories

to the test as America stared into another abyss. Alas, there was a serious complication: with interest rates already low, the Fed had little leeway to ease monetary policy with traditional tools. So it had to invent a new tool: liquidity injections from its balance sheet through unprecedented asset purchases.

The experiment, now known as quantitative easing, was a success – or so we thought. But the Fed mistakenly believed that what worked for markets in distress would also spur meaningful recovery in the real economy. It raised the stakes with additional rounds of quantitative easing, QE2 and QE3, but real GDP growth remained stuck at around 2% from 2010 through 2017 — half the norm of past recoveries. Moreover, just as it did when the dot-com bubble burst in 2000, the Fed kept monetary policy highly accommodative well into the post-crisis expansion. In both cases, when the Fed finally began to normalize, it did so slowly, thereby continuing to fuel market froth.

Here, too, the Fed’s tactics owe their origins to Bernanke’s academic work. With his colleague Mark Gertler of NYU, he argued that while monetary policy was far too blunt an instrument to prevent asset-bubbles, the Fed’s tools were far more effective in cleaning up the mess after they burst. And what a mess there was! As Fed governor in the early 2000s, Bernanke maintained that this approach was needed to avoid the pitfalls of Japanese-like deflation. Greenspan concurred with his famous “mission accomplished” speech in 2004. And as Fed Chair in the late 2000s, Bernanke doubled down on this strategy.

For financial markets, this was nirvana. The Fed had investors’ backs on the downside and, with inflation under control, would do little to constrain the upside. The resulting “wealth effects” of asset appreciation became an important source of growth in the real economy. Not only was there the psychological boost that comes from feeling richer, but also the realization of capital gains from an equity bubble and the direct extraction of wealth from the housing bubble through a profusion of secondary mortgages and home equity loans. And, of course, in the early 2000s, the Fed’s easy-money bias spawned a monstrous credit bubble, which subsidized the leveraged monetization of housing-market froth.

And so it went, from bubble to bubble. The more the real economy became dependent on the asset economy, the tougher it became for the Fed to break the daisy chain. Until now. Predictably, the current equity market rout has left many aghast that the Fed would dare continue its current normalization campaign. That criticism is ill-founded. It’s not that the Fed is simply replenishing its arsenal for the next downturn. The subtext of normalization is that economic fundamentals, not market-friendly monetary policy, will finally determine asset values.

The Fed, it is to be hoped, is finally coming clean on the perils of asset-dependent growth and the long string of financial bubbles that has done great damage to the US economy over the past 20 years. Just as Paul Volcker had the courage to tackle the Great Inflation, Jerome Powell may well be remembered for taking an equally courageous stand against the insidious perils of the Asset Economy. It is great to be a fan of the Fed again.

© 2018 Project Syndicate.

When the Fed tightens, emerging market borrowers feel the pinch

Roughly 80% of cross-border loans to emerging market economies are estimated to be denominated in U.S. dollars. Dollar-denominated credits make up 60% of Europe’s emerging market economies’ cross-border lending and over 90% of foreign banks’ loans to emerging market economies in Africa, Asia, and the Americas. Foreign bank loans account for about half of all emerging market economies’ external liabilities.

In a new research paper, “U.S. Monetary Policy and Emerging Market Credit Cycles” (NBER Working Paper No. 25185), authors Falk Bräuning and Victoria Ivashina find that when the Federal Reserve lowers U.S. interest rates, the volume of cross-border loans by global banks goes up, particularly to emerging market borrowers.

Studying the 1980-2015 period, they find that a four percentage point cut in the Federal Reserve’s target interest rate (a typical decrease during an easing cycle) raised loan volumes in emerging markets by 32% relative to the volumes in developed markets. This was true even after accounting for differences in GDP growth, inflation, and forecast future economic performance.

Loan volumes also respond to the yield spread — the difference between the 10-year U.S. Treasury yield and the federal funds rate. As the spread narrows and banks rebalance their lending portfolios toward riskier assets, a one percent decrease in the U.S. spread increases emerging market economy lending volumes by about 16%. This effect was particularly relevant earlier this decade, when the Federal Reserve kept the federal funds rate at zero and eased monetary policy through unconventional measures that directly impacted long-term rates.

Monetary policy easing also is associated with higher loan volumes to riskier firms. In response to a 25 basis point decrease in the U.S. federal funds rate, firms with a one percentage point higher borrowing cost than their country average experienced a one percent higher increase in loans than that afforded to average borrowers.

When U.S. monetary policy tightens, the pendulum swings the other way. Increases in the federal funds rate of 25 basis points were associated with a 4.2 percentage point larger overall decline in dollar credit for emerging market firms than for developed market firms. Local bank lenders do not offset a contraction in foreign bank credit. Rather, local dollar credit also contracts. A 25 basis point increase in the federal funds rate leads to a 3.5 percentage point drop in local credit.

Changes in eurozone rates affect the volume of euro-denominated cross-border lending of U.S. banks to non-euro borrowers, but they do not affect the volume of dollar-denominated credits. “Foreign monetary policy is relevant only for the loans in the corresponding foreign currency,” the researchers concluded.

The researchers used data from the Thompson Reuters DealScan database on global syndicated corporate loan issues. It showed the same result for non-U.S. banks and for banks with portfolios that have little exposure to the United States. The results apply to borrowers in non-tradable industries and those in countries having little trade linkage with the United States, even when controlling for individual borrowers, their home countries, loan amounts, currency, maturity, interest rates, and lenders in the loan syndicate.

© 2019 RIJ Publishing LLC. All rights reserved.

In Austria, earlier retirement was associated with earlier death

Many workers dream of retiring as early as possible to pursue travel, leisure, sport, and other pursuits. But new research suggests that some individuals, particularly men, might want to postpone retirement. They might live longer.

Austrian men who took advantage of a temporary change in unemployment insurance rules and retired early experienced an increased risk of premature death, according to “Fatal Attraction? Extended Unemployment Benefits, Labor Force Exits, and Mortality,” NBER Working Paper (No. 25124). The effect wasn’t seen in women.

Researchers Andreas Kuhn, Stefan Staubli, Jean-Philippe Wuellrich, and Josef Zweimüller analyzed a unique public program in Austria in the late 1980s and early 1990s that was adopted when that nation’s steel sector underwent dramatic layoffs. To cushion the economic blow to older workers, the Austrian government implemented the Regional Extended Benefits Program (REBP).

This program effectively allowed workers in some regions of Austria to take early retirement via disability insurance or old-age pension programs. It induced a significant increase in early retirement.

Using information from the Austrian Social Security Database, the researchers compiled information on 310,440 men and 144,532 women—excluding those from the steel sector—and compared data from REBP-eligible regions and nearby non-REBP regions. They compared the employment histories, incomes, gender, age, retirement dates, and age at death of those who took early retirement and those who were eligible but did not.

The researchers found that an additional year in early retirement increased a man’s probability of death before age 73 by 1.85 percentage points — equivalent to a relative increase of 6.8%—and reduced the age at death by an average of about 10 weeks. For women, early retirement was not associated with elevated mortality, a finding that is in line with previous research by others.

They also found that the changes in lifetime income associated with early retirement were negligible, particularly when generous government old-age benefits were counted, and that they could not explain the increased mortality among certain groups of the population. Thee researchers suggest that lifestyle changes may explain the study’s mortality findings.

Men in blue-collar occupations, men with low-work experience, and men who had some pre-existing health impairment displayed higher mortality effects than men in white-collar occupations. An additional year in early retirement increased the probability of death before age 73 by 1.91 percentage points for blue collar men, 3.45 percentage points among men who have spent some time on sick leave, and by 2.42 percentage points among men with low work experience.

To check the robustness of their findings, the researchers analyzed data from before and after the early retirement program and found no differences in mortality and early retirement trends between those two periods.

© 2019 RIJ Publishing LLC. All rights reserved.

JPMorgan Chase to pay $135 to settle SEC charges

JPMorgan Chase Bank N.A. will pay more than $135 million to settle charges of improper handling of “pre-released” American Depositary Receipts (ADRs), the Securities and Exchange Commission announced.

ADRs, which are U.S. securities that represent foreign shares of a foreign company, require a corresponding number of foreign shares to be held in custody at a depositary bank. The practice of “pre-release” allows ADRs to be issued without the deposit of foreign shares, provided brokers receiving them have an agreement with a depositary bank and the broker or its customer owns the number of foreign shares that corresponds to the number of shares the ADR represents.

The SEC’s order found that JPMorgan improperly provided ADRs to brokers in thousands of pre-release transactions when neither the broker nor its customers had the foreign shares needed to support those new ADRs.

Such practices resulted in inflating the total number of a foreign issuer’s tradeable securities, which resulted in abusive practices like inappropriate short selling and dividend arbitrage that should not have been occurring.

This was the eighth action against a bank or broker, and the fourth action against a depositary bank, resulting from the SEC’s ongoing investigation into abusive ADR pre-release practices.  Information about ADRs is available in an SEC Investor Bulletin.

“With these charges against JPMorgan, the SEC has now held all four depositary banks accountable for their fraudulent issuances of ADRs into an unsuspecting market,” said Sanjay Wadhwa, Senior Associate Director of the SEC’s New York Regional Office.  “Our investigation continues into brokerage firms that profited by making use of these improperly issued ADRs.”

Without admitting or denying the SEC’s findings, JPMorgan agreed to pay disgorgement of more than $71 million in ill-gotten gains plus $14.4 million in prejudgment interest and a $49.7 million penalty for total monetary relief of more than $135 million.  The SEC’s order acknowledged JPMorgan’s cooperation in the investigation and remedial acts.

Philip A. Fortino, William Martin, Andrew Dean, Elzbieta Wraga, Joseph P. Ceglio, Richard Hong, and Adam Grace of the New York Regional Office are conducting the SEC’s continuing investigation, with supervision by Sanjay Wadhwa.

© 2019 RIJ Publishing LLC. All rights reserved.

Medicare premiums for 2019

The Centers for Medicare & Medicaid Services (“CMS”) has announced the Medicare Part A deductibles and Part B premiums for 2019. Medicare Part A covers inpatient hospital and hospice care, while Part B covers outpatient services such as doctors’ visits.

According to a Wagner Law Group bulletin:

  • The Part A deductible for inpatient hospital expenses will be $1,364 in 2019, a $24 increase over the prior year.
  • For the 61st through 90th day of hospitalization, the per diem coinsurance cost will be $341.
  • Hospital stays over 90 days will cost $682 per day.
  • Daily coinsurance for the 21st to 100th day in a skilled nursing facility will cost $170.50 in 2019.
  • The standard Medicare Part B monthly premium for 2019 will, for most individuals, be $135.50.
  • Single beneficiaries with incomes over $85,000 and married couples with incomes of over $170,000 will pay a higher Part B premium, based on a sliding scale, as required by the Medicare Modernization Act.

© 2019 RIJ Publishing LLC. All rights reserved.

Honorable Mention

Transamerica sued by its own 401(k) participants

In a federal class action suit, the participants in Transamerica Corporation’s own $1.7 billion 401(k) plan have sued the giant financial services firm, accusing it of violating its fiduciary duties by offering proprietary Transamerica funds that significantly trailed their benchmarks.

The suit was filed December 28 in the U.S. District Court of Northern Iowa by the law firm of Sanford Heisler Sharp, LLP. The complaint alleges the company invested employees’ retirement savings in multiple funds that consistently underperformed their investment benchmarks and other similar collective investment funds, resulting in the loss of millions of dollars in potential savings.

“Transamerica retained too many poor-performing investment options on the plan,” said David Sanford, chairman of Sanford Heisler Sharp and counsel for the plaintiffs and the proposed class, in a release.

According to the complaint, Transamerica offered the plan’s participants “substandard investment options” that were managed by a Transamerica affiliate, Transamerica Asset Management that “consistently underperformed their benchmarks” between 2008 and 2017.

The funds named in the lawsuit are:

  • Transamerica International Equity Portfolio
  • Transamerica Small Core Portfolio
  • Transamerica Large Value Portfolio
  • Transamerica Large Growth Portfolio
  • Transamerica High Yield Bond Portfolio
  • Transamerica Mid Value Portfolio

“During the 2008-2017 time period, the International Equity Portfolio underperformed its benchmark, the Morgan Stanley All-World Country Index ex-USA, by approximately 30%. During the same period, the Small Core Portfolio underperformed its benchmark, the Russell 2000 Index, by over 15%,” the complaint said.

According to the plan documents dated September 1, 2018, “the International Equity Portfolio, the Small Core Portfolio and the Mid Value Portfolio each underperformed their respective investment benchmarks for the past one, five, and ten-year periods. The Large Value Portfolio, the Large Growth Portfolio, and the High Yield Portfolio each underperformed their respective investment benchmarks for the past five and ten-year periods,” the suit said.

Plaintiffs Jeremy Karg, Matthew R. LaMarche, and Shirley Rhodes each filed the case individually and as representatives of approximately 17,000 plan participants in Transamerica’s 401(k) plan. Named as defendants are the Transamerica Corporation and the committees and their members that provide investment advice and services to the plan.

Plaintiffs and the class are asking for compensation for financial losses to plan participants and beneficiaries resulting from the plan’s underperforming investments; divestiture of imprudent investments; and the removal of the fiduciaries who may have violated their duties to the plan’s participants and beneficiaries under ERISA.

What a difference a month makes

For U.S. mutual funds and ETFs, November was the calm before the storm.

Mutual fund assets grew by just 0.6% in November, according to the December 2018 issue of The Cerulli Edge – U.S. Monthly Product Trends Edition. Assets stood $14.5 trillion with one month left in the year.

Net negative flows of $49.5 billion undermined asset growth, but November saw a rebound of sorts, with total assets increasing about 2.9%. Year-to-date total assets have increased 4.9%.

For exchange-traded funds (ETFs), net flows returned to a healthy level in November, with ETF products cumulatively adding more than $47.0 billion. This total was the second largest in any month of 2018 thus far.

Financial wellness. While the term financial wellness can be ambiguous, at its most fundamental level it emphasizes holistic advice and goes beyond a participant’s workplace retirement savings account.

While it is no small task for providers to integrate the myriad financial wellness components, Cerulli views this as a worthwhile initiative, and potential competitive advantage, as plan sponsors (and their advisors/consultants) begin to evaluate these offerings more closely.

Target-date Funds. As the target-date fund category continues to evolve, there are several instances of new products that are no longer pure target-date strategies in the sense of a strictly age-based asset allocation solution, but to refer to them as managed accounts would be overstating their ability to customize for the end-investor.

To create some structure around this hybrid target-date/managed account emerging category, Cerulli references two sub-categories: dynamic qualified default investment alternative (QDIA) and personal target-date fund.

Alight and Advizr in financial wellness partnership

Alight Solutions, a provider of “technology-enabled health, wealth and human capital management solutions,” has added Advizr WorkPlace, a set of financial management and planning tools, as an option among Alight’s suite of financial well-being solutions for the employees of its benefits administration clients.

Three Alight clients, representing over 500,000 employees, have implemented Advizr Workplace, according to a news release. Advizr Inc. is a financial wellness technology company based in New York, NY. Its software supports 401(k) plan participants. It also produces Advizr Core, which advisors can use to help grow their practices.

Advizr is designed to help employees with debt management, budgeting, protection, college savings, and retirement planning. Help from an Alight investment advisor representative is also available, with some restrictions. Advizr Workplace is available as a stand-alone solution to Alight’s benefits administration clients.

According to the release, Advizr allows users to “assess spending, manage debt, evaluate life insurance coverage needs, prioritize and track goals and build a plan for their unique financial objectives and to evaluate ‘what if’ scenarios.

“Research continues to prove that reducing financial insecurity leads to improved employee productivity, morale and retention, while lowering rates of absenteeism and healthcare expenditures,” the release said.

AIG buys Ellipse, a UK group life insurer

American International Group, Inc., announced that AIG Life Limited, a UK subsidiary of AIG Life & Retirement, has completed the previously agreed acquisition of Ellipse, a specialist group life, critical illness and income protection provider in the UK, from Munich Re.

“AIG believes Ellipse’s group protection expertise, alongside its technology-enabled business model, makes it a strong strategic fit with the existing AIG Life Limited operation in the UK,” according to an AIG release.

AIG Life will now distribute both group and individual protection insurance products to UK consumers through financial intermediaries, employee benefits consultants and partnerships.

© 2019 RIJ Publishing LLC. All rights reserved.

Money Myths, Legal Realities

Aside from knowing that money doesn’t grow on trees, do we really understand where it comes from? Banks supposedly create money out of thin air just by lending. The Federal Reserve magically found trillions of dollars to resolve the financial crisis. But how? And for whose benefit?

That second question—for whose benefit do the banks and the Fed create money—was front and center at the Harvard Law School a few weeks ago. During a two-day conference called, “Money as a Democratic Medium,” a parade of academics presented the case that money over recent decades has been co-opted, even hijacked.

“We’ve allowed money creation to be privatized,” said Morgan Ricks, a professor at Vanderbilt School of Law, who spoke at the conference.

If you’re of a libertarian, gold-loving, neoliberal bent, you’d probably say that industrious people create money and politicians confiscate it through taxation. If so, you’d have been lonely at this conference. Many of the historians and economists there believed that bankers, abetted by lawyers, have stolen the public’s purse.

Law, in fact, is essential to the story. One law professor showed that US law has been explicitly written to prevent blacks from accumulating wealth. A Columbia law professor explained how lawyers invent new kinds of collateral and play regulatory arbitrage. A Connecticut banker described his ongoing legal battle to deposit client money in an interest-bearing account at the Fed.

An all-but-invisible presence at the conference was Modern Monetary Theory, or MMT. MMT is a type of chartalism, a branch of macroeconomics that describes today’s money as circulating government debt, given legitimacy by a government, and financed by taxes. Christine Desan, Ph.D., who organized “Money as a Democratic Medium,” spoke at an MMT conference in late September. The mere fact that Harvard hosted this conference may signal a breakthrough in recognition for MMT, which most mainstream economists consider fringy.

Money and the law: Inseparable

Held in Wasserstein Hall on the law school campus, the free conference featured more than 50 presenters and was attended by hundreds of academics and Harvard students. Several of the presenters offered evidence that, historically and up to the present day, US banks and courts have created byzantine rules that privilege certain parties—often the ones who write the rules—and disadvantage others.

One of the first speakers was Katharina Pistor, a professor at Columbia Law School and the author of the forthcoming The Code of Capital (Princeton, 2019). If you like the current banking system, Pistor had good news: The status quo is protected by a deep moat of securities laws, bankruptcy laws, and contract laws. Globalization makes it harder than ever for national governments to stop securities lawyers from creating exotic new negotiable assets, like a CDO-squared.

“In times of globalization the idea that we could control money top down is problematic,” said Pistor, who seemed appalled by the situation. “Lawyers have pushed the limits on creating new types of assets. It’s hard to regain control over these processes. It’s hard to dislodge control at the national or even the global level. Only the US and the UK acting together could roll back some of the excesses.”

Mehrsa Baradaran

In a presentation that drew a standing ovation, Mehrsa Baradaran, a banking law specialist at the University of Georgia and author of The Color of Money: Black Banks and the Racial Wealth Gap (Belknap, 2017), made a richly-documented case for the idea that African-Americans have been systematically marginalized from the larger economy, with restricted access to banks, credit and homeownership, a traditional path toward capital accumulation.

After the Civil War, the government created the Freedman’s Bank. But the bank failed in the Panic of 1873, taking with it $75 million in savings from 80,000 depositors and leaving many American blacks with an ingrained mistrust of financial institutions, Baradaran said. Injustices continued into the modern era. In its early versions, Social Security didn’t cover domestic workers, many of whom were black women. After World War II, blacks were barred from buying homes in Levittown, the archetypical suburbia that was financed with federally insured loans.

Another speaker was James McAndrews, a former Federal Reserve researcher and a faculty member at University of Chicago’s Booth School of Business. McAndrews is also CEO of The Narrow Bank, or TNB USA, which was founded in Connecticut in 2016 to perform one function. TNB would accept large deposits from institutions and transfer the money to an account at the Fed.

McAndrews wanted to cash in on the Fed’s policy, introduced after the 2008 crisis, of paying member banks 1.95% on their excess reserves. Those banks are not passing those earnings through to depositors, however. McAndrews saw an opportunity to get an account for TNB at the Fed, and pass through 1.90% of that 1.95% to his depositors, taking a five basis-point service fee ($500 per $1 million).

But the Federal Reserve Bank of New York denied TNB USA a Master Account. So last September, McAndrews sued the Fed. The Fed won’t say why it won’t give TNB an account. But, as TNB says in its lawsuit, “If successful, TNB would place competitive pressure—primarily on large banks—to raise depository interest rates for all depositors.”

What about wampum?

Desan, the organizer of the conference, is a law professor who, after setting out to write a legal history, ended up writing a history of English money because, as she told an audience in New York in late September, the English legal system and English money grew up together. A nation’s money, she found, is a legal construct—a creature of the law, a contract.

But what about wampum, cowry shell money and especially gold, which many consider the only true money? Didn’t primitive people create so-called “commodity money” to ease the frictions of barter? Didn’t “goldsmith bankers” invent paper money by circulating gold receipts? Isn’t money a private matter?

Those are well-preserved fictions, Desan explains in Making Money: Coin, Currency and the Coming of Capitalism (Oxford, 2014). The immense abstract quantities of national currencies that now exist did not evolve from the exchange of gold coins between private traders, she says. According to her book (and a growing shelf of financial histories with a similar theme), money in the modern sense appeared when kings and parliaments, to mobilize unprecedented sums for war or infrastructure, began spending IOUs whose value depended on the future redemption of those same IOUs as taxes.

“Making money, a phenomenon almost impossible to explain if we limit our field of vision to individuated exchange, becomes easily comprehensible once we enlarge that lens to include the collective activity that links individuals and communities,” Desan writes. “Money is a way to mark and mobilize material value that can start at the center, work selectively and with limited information, and yet enlist the contributions of a broad group.” If you read this book, you’re bound to look at money in an entirely new way.

© 2019 RIJ Publishing LLC. All rights reserved.

The Economic War-of-Choice on China

The brewing conflict between the United States and China is typical of zero-sum contests among countries, firms, and individuals. The US is acting under the implicit assumption that if China’s GDP were to surpass that of the US in nominal dollar terms, US economic prospects would be reduced by an amount equal to the margin of China’s gain.

The idea that there needs to be a battle over trade or technological dominance at all is very much in keeping with US President Donald Trump’s approach to economic and foreign policy. The recent arrest of Huawei CFO Meng Wanzhou in Canada itself raises the notion that the Trump administration is resorting to increasingly cutthroat methods to get its way.

Yet lost behind the spectacle of high-profile arrests are a few basic economic facts. For starters, one country’s gain is not necessarily another’s loss. Both the US and China could have vibrant tech sectors that benefit from each other’s innovations. Moreover, China’s economy is a key driver of growth in many other countries, including the US. And given that its economy is already larger than America’s in terms of purchasing power parity, the fear that it will surpass the US in terms of nominal GDP – which is not the same thing as wealth – seems rather beside the point.

It is only natural for a dominant power that finds itself in second place to experience self-doubt or a loss of confidence. But the US will just have to get over it, as the rest of the world did when America became the single largest economy. Besides, the two primary factors behind long-term economic growth are the size of a country’s working-age population and its productivity. China has a significantly larger population than the US does, so it stands to reason that it will surpass the US in nominal size at some point (unless it were trapped in a permanent state of poor productivity). The same is true for India.

Another factor that has been overlooked is the Chinese consumer. For many businesses in a given economy, the size of the domestic consumer market is the strongest determinant of potential growth. At the start of this decade, Chinese government statistics showed that domestic consumption accounted for 38% of GDP; by the end of 2017, that figure had risen to 42-43%. In nominal terms, China’s consumer market is now around one-third the size of America’s, which is why iconic US companies like Apple sell so many iPhones there.

Ten years after the global financial crisis, US domestic consumption remains at around 70% of GDP. But it is unlikely that the global and US economies will be able to rely on this source of demand for another decade, which is precisely why the Chinese market’s rapid growth should be welcomed by all – not least Western companies, whose bottom lines will increasingly depend on Chinese consumers. Given its growth potential, the Chinese consumer market will continue to attract US companies and investors, including from Silicon Valley. So far, Chinese regulations do not seem to have discouraged the big US-based tech companies. Even Google, which left China eight years ago, is reportedly developing a censored search engine to meet the Chinese government’s conditions for re-entering the market. Similarly, leading Silicon Valley investors such as Sequoia have been highly active in Chinese venture-capital start-ups for years

Other countries can certainly disagree with China’s approach to domestic governance. But as a sovereign country, China is justified in pursuing the policies that it sees fit, at least until evidence emerges that its own people object to the course it has charted for itself. The widespread adoption of digital applications such as WeChat – a broader Chinese version of WhatsApp – suggests that Chinese consumers are not particularly put off by government controls, and quite enjoy the wealth of new platforms at their fingertips. Moreover, there has been evidence that some US tech companies appear not to have full control of their own platforms. China’s more controlling line on corporate behavior might not suit freewheeling businesses, but may have some social benefits.

As for the Huawei case, if it turned out that the company did indeed violate contractual obligations not to transfer US technology to Iran, then it is only reasonable that there should be consequences. That is true for any exporting business: US secondary sanctions mean that companies and governments everywhere must consider whether their business with Iran is more important than their business with the US.

But the US also needs to think carefully about its own actions. At some point, the dollar’s status as a global means of payment and reserve currency could be challenged. If the US is too aggressive in its enforcement of secondary sanctions, other countries might either develop payment systems of their own or forbid their companies from doing further business with US firms.

Whether China can become the world’s largest economy without also achieving technological dominance is an open question. But it is not one that other countries should be obsessing over at the expense of their own economic growth and long-term stability.

© 2018 Project-Syndicate.

Numbernomics’ Forecast for 2019

Stock market jitters are making investors nervous. We understand why. The expansion is approaching its 10-year anniversary, which makes it geriatric. GDP growth overseas has slowed. Home sales have been shrinking steadily for a year.

However, we believe the stock market’s fears are overblown. For 2019 we expect:

  • GDP growth of 2.8%.
  • Inflation should be steady with the core CPI rising 2.3%.
  • The Fed will boost the funds rate twice in 2019 to 2.75%.
  • The stock market should reach a new record high level.
  • Sustained rapid growth in investment spending will quicken productivity and boost the economy’s speed limit to 2.8% by the end of this decade.
  • This expansion will not end in the foreseeable future.

To forecast GDP growth, we break it down into its major components – consumer spending, investment, trade, and government spending.

Consumer spending

Consumer spending, which is about two-thirds of the GDP, is likely to grow 2.6% in 2019.  While the stock market has fluctuated wildly for two months consumer confidence has been unfazed. Why? Jobs. The economy continues to crank out 190,000 new jobs per month. Job creation generates the income that allows us to spend.

Some economists note that consumer debt has climbed to a record high level. But consumer income has also risen and, as a result, debt in relation to income is near a record low level. Consumers are not saddled with excessive debt. If we were, delinquency rates should have begun to climb. That has not happened.

Bottom line: Look for consumer spending to grow 2.6% in 2019. Remember, consumers account for two-thirds of GDP.

Housing

The housing market has declined steadily throughout the year. While disquieting, we had a similar drop in 2014. Ex-Fed Chair Bernanke said that the Fed planned to slow its purchases of its U.S. Treasury bonds. The markets panicked. Long-term interest rates spiked and home sales got crushed. But eventually reality sank in and sales rebounded. We expected something like that to happen again. Is the recent decline attributable to a drop-off in demand? Or is it a supply constraint? We argue it is primarily the latter.

The National Association of Realtors (NAR) reports that there is currently a 4.3-month supply of homes available for sale and that a six-month supply is necessary for supply and demand to be in balance. Hence, there is a considerable shortage of homes available for sale. Realtors cannot sell what is not for sale. If enough homeowners were to put their houses on the market so that there was six-month supply, sales would be 5.8-6.0 million versus 5.2 million currently. Thus, the problem is largely a supply constraint.

Some economists contend that the combination of rising home prices and higher mortgage rates has made housing unaffordable. That is not true for most potential home buyers. The NAR’s housing affordability index, which includes prices, mortgage rates, and consumer income, has been rising steadily.

This index tells us that consumers have 45% more income than is necessary to purchase a median-priced home. In 2007 that same number was 14%. Housing was expensive at that time. That is not the case today.

On the demand side, the average length of time between listing a home and its sale is 33 days. In 2011 the comparable figure was 95-100 days. Clearly the demand for housing remains robust.

For builders the primary constraint seems to be a labor shortage. They cannot find an adequate supply of workers. That puts a lid on how many homes they can produce. Our sense is that housing will climb about 4.0% next year, but that is not fast enough to alleviate the extensive housing shortage.

Investment

Investment spending is another 15% of the GDP pie. Business confidence is soaring. That is true for manufacturers, non-manufacturing firms, small businesses, and big businesses. Small business confidence is particularly noteworthy since it has reached a 35-year high. Why? The tax cuts. All measures of confidence surged immediately after the November 2016 election. The combination of tax cuts, repatriation of overseas earnings at a favorable tax rate, and the elimination of unnecessary, overlapping, and confusing regulations has buoyed business optimism.

That confidence has stimulated investment spending, which surged in the first quarter of 2017 and continues to this day. While some economists suggest this is a short-term development triggered by the tax cuts, we do not share that view. A reduced tax rate and further deregulation will spur investment spending for years to come.

Also, the 3.7% unemployment rate is the lowest in 50 years. Labor shortages are extensive. If firms cannot hire an adequate number of new workers, they might contemplate spending money on technology to make the company’s existing workers more productive. This will provide further stimulus for investment. Thus, we expect investment spending to grow 6.5% for the next several years.

Trade

Trade has gotten lots of attention recently. All economists support the notion of free trade. All countries benefit. But free trade is not fair trade. Not all countries play by the rules. Some cheat. The primary culprit is China, which does not respect intellectual property rights, steals trade secrets, and forces companies who want to do business in China to share their technology. The object of the trade negotiations is to encourage China to reform.

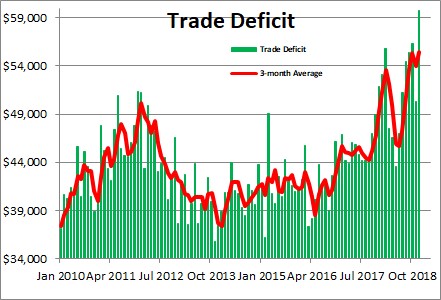
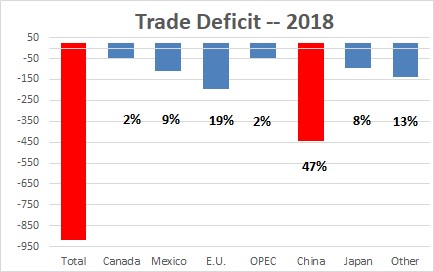
But Trump initially said he was concerned about the size of the trade deficit and wanted to shrink it. To that end, he imposed steel and aluminum tariffs on our neighbors, friends, and allies as well as China. They retaliated. Suddenly a trade war was underway.

While all countries lose as the result of a trade war, not all countries lose equally. As investors scoured the globe to find which countries might fare best in a trade war, their answer was the U.S. After all, trade only represents about 10% of the U.S. economy, versus about 50% elsewhere.

As a result, money has poured into the U.S. stock and bond markets since January. The dollar has climbed 9%. Tariffs imposed by other countries will reduce growth of U.S. exports, but the flood of money into the U.S. by foreign firms who start new businesses here and hire American workers will limit the damage.

That is not the case for emerging economies. They generally import the raw materials required by their manufacturing sector. But those commodities are all traded in dollars. When the dollar rises, their cost of goods sold increases. It becomes more difficult for them to compete in the global marketplace. As a result, their currencies decline. Their stock markets plunge. Indeed, the emerging markets stock index has fallen 23% since February. Slower GDP growth lies ahead.

In October the IMF lowered its projection of 2019 GDP growth for emerging economies by 0.3%. Growth in China should slip to 6.5% this year, the slowest rate of expansion since 1990. Even slower growth is expected in the years ahead. This slower pace of growth outside U.S. borders – China in particular – is one factor weighing on the U.S. stock market.

As growth prospects dim for these countries and the pain intensifies, there is increasing pressure on their leaders to strike a trade deal with the U.S. Thus far that has happened with Mexico and Canada. A deal with Europe seems close. China, not so much. But if Trump broadens and further raises tariffs on Chinese goods at the end of this year the pressure on both sides will intensify. We believe that by spring the U.S. and China will reach an agreement with both sides claiming victory.

Unfortunately, previously imposed tariffs on U.S. goods by China and other countries will reduce growth in U.S. exports, cause the trade gap to widen, and the trade component will subtract about 0.2% from U.S. GDP growth in 2019.

GDP expectations

When we combine these GDP components, we come up with projected GDP growth for 2019 of 2.8%. Our GDP forecast for the next several years differs from others because we expect rapid investment spending to continue for years, which will boost productivity growth and, eventually, raise our economic speed limit to 2.8%. Most other economists expect investment growth to fade soon and potential growth to remain at 1.8%.

Nobody knows exactly what the economy’s potential growth rate is, but we estimate it by adding the growth rate of the labor force to growth in productivity. If we know how many people are working and how efficient they are, we should be able to estimate how many goods and services they can produce.

In the 1990’s potential growth was believed to be 3.5%, consisting of 1.5% growth in the labor force and 2.0% growth in productivity. The economy grew at that rate for a decade and we concluded that in the good times the economy should grow by at least 3.0%.

But in recent years potential growth rate has slipped to 1.8%. The baby boomers are retiring, and labor force growth has slipped to 0.8%. Productivity growth has faded to 1.0% following a growth spurt triggered by the introduction of the Internet in the mid-1990’s and the cloud and apps in the early 2000’s.

While GDP growth of 1.8% is disappointing, it does not have to remain there forever. But to increase it we need to boost either growth in the labor force or growth in productivity. Labor force growth is unlikely to accelerate because the baby boomers will continue to retire for another decade. Fortunately, productivity growth is determined to a large extent by growth in investment. Our bet is that sustained rapid growth in investment will boost productivity growth from 1.0% in recent years to 2.0%, and the economy’s potential growth rate will climb from 1.8% to 2.8%. That means that the economy can grow at a steady 2.8% pace without triggering an upswing in inflation.

Core inflation

We estimate that the core inflation rate will edge upwards from 2.2% this year to 2.3% in 2019. There are components, like housing, that will put upward pressure on the inflation rate. Rents, which represent about one-third of the entire CPI index are growing by 3.3% which reflects the shortage of rental units.

But there are two factors that have kept inflation in check which are not widely discussed.

First, is the role of technology. Whenever we buy anything, we shop first on Amazon and can find the lowest price anywhere in the world. As a result, goods-producing firms in the U.S. have absolutely no pricing power. In the past year prices of goods have risen 0.2%. Prices of services have risen 2.9%. This means that inflation is virtually non-existent for one-third of the economy.

Second, productivity growth is countering most of the faster growth in wages. Given the tight labor market wage growth has accelerated from 2.0% to 3.0%. Most economists worry that this will cause an upswing in inflation. But they are looking at the wrong thing.

If employers pay their workers 3.0% higher wages because they are 3.0% more productive, they don’t care. They are getting 3.0% more output and have no incentive to raise prices. Workers have earned their fatter paychecks. Thus, we are supposed to look at “unit labor costs” which are labor costs adjusted for the increase in productivity. In the past year unit labor costs have risen 0.9%. The Fed has a 2.0% inflation target. As a result, the seemingly tight labor market is not putting upward pressure on the inflation rate.

Fed policy

If productivity continues to climb, it will help to keep the inflation rate in check.

If in 2019 we end up with 2.8% GDP growth and inflation is relatively steady at 2.3%, the Fed will be cautious about further rate hikes. For years the Fed thought that a “neutral” funds rate was about 3.0%. But recent speeches by Fed governors make it clear that the Fed is rethinking that objective and may lower it to 2.75%. Given that the funds rate currently is 2.2%, that implies only two rate hikes in 2019. The Fed is getting close to where it wants to be.

When will the expansion end? We do not know, but probably not before 2022. We want to see two things to happen before we call for a recession:

  • The funds rate should be at least 5.0%.
  • The yield curve must invert, meaning that short rates are higher than long rates.

We have found that the U.S. economy has never gone into recession until the funds rate has been above the 5.0% mark. If the Fed raises the funds rate to 2.75% by the end of next year and leaves it there, a 5.0% funds rate will not happen for the foreseeable future.

We have also found that when the yield curve (which we define as the difference between the yield on the 10-year note and the funds rate) inverts, a recession follows within a year. Today the 10-year note is 3.0%, the funds rate 2.2%, so the yield curve has a positive slope of 0.8%.

By the end of next year, we expect the funds rate to be 2.75% and the yield on the 10-year note to be 3.4%. The curve will have a positive spread of 0.65%. By the end of 2019 (and for 2020 and 2021), we expect neither of our preconditions for recession to be met.  For this reason, we believe the expansion will continue at least until 2022.

Positive scenario

We have described a very positive scenario. Potential GDP growth rises from 1.8% to 2.8%. Inflation remains steady at 2.3%. The Fed raises rates only twice more and the funds rate peaks at 2.75%. The stock market will climb to a record high level during 2019. But for this to happen, investment spending must continue to grow rapidly, and productivity must sustain a 2.0% pace.

© 2018 Numbernomics.

BlackRock, Microsoft & Retirement: What’s Up?

Microsoft and BlackRock, have formed a partnership “to make it easier for people to both save for retirement and achieve the lifetime income they need through their employers’ workplace savings plan,” according to a press release the two companies issued December 13.

That sounds significant. An global tech firm and an global asset management firm are strategizing to analyze and manage some of the trillions of dollars of Boomer savings that reside in 401(k) funds. The Wall Street Journal first elaborated on the deal.

The two companies didn’t exactly commit themselves to the guaranteed lifetime income business, however. According to a report in Bank Investment Consultant that cited the Journal article,the envisioned Microsoft-BlackRock platform will offer “target-date funds and other investments like annuities.” “Like,” in this case, could easily mean “similar to” rather than “such as.”

BlackRock didn’t seem to announce anything very new. According to the press release the firm “intends to offer the platform” to retirement plan participants “in connection with next generation investment products that it will design and manage.” It would give participants “more regular engagement with their retirement assets so they have a clearer picture of how their contributions today will translate to long-term retirement income.”

BlackRock already is known to do those things. It offers LifePath dynamically managed target date funds to plan sponsors, it offers the “LifePath Spending Tool” that estimates how much a retiree can spend every year, and it offers the CoRI tool. This tool help pre-retirees figure out how much safe income (based on current bond yields rather than annuity payout rates), their savings can produce.

*                        *                        *

The newest news here may be the entry of Microsoft into the retirement space. And the catchiest part may be the Ex Machina sexiness that any mention of artificial intelligence (AI) implies. “Seems like [BlackRock and Microsoft are] hoping to get ahead of the AI curve,” one trade group executive told me.

When I observed that neither BlackRock nor Microsoft are 401(k) recordkeepers, and don’t have direct access to a mountain of big data, the executive said: “There are lots of ways to gather/access big data. The bigger question is what to do with it once you have access, which is where Microsoft comes in.”

The announcement was “short on details, by design,” said a DCIO executive. “This is more about positioning. It’s not about making a big bet. BlackRock has been putting a bet on every chip, but this is not about making a big new bet.” He was referring to BlackRock’s bets on fintech with the purchase of Future Advisor and stake in Acorns, on data analysis with the creation of Aladdin, on institutional investments with LifePath TDFs, and on registered investment advisors with its recent purchase of 5% of Envestnet. BlackRock also has a new deal to integrate its iRetire income support service with eMoneyAdvisor, the Fidelity-owned planning software firm.

“The press release put ‘retirement income’ pretty strong,” he added. “The moral imperative is always hard on income. But I don’t believe this is a reincarnation of SponsorMatch.” That was a reference to an aborted 2007 partnership between MetLife and Barclays Global Investors (purchased by BlackRock for $13.5 billion in June 2009) to offer plan participants an option that combined investments with incremental purchases of future guaranteed income.

Another source was more positive. He told RIJ that BlackRock CEO Larry Fink is serious about partnering with an insurance company on an investment product, such as BlackRock’s target date funds, with a lifetime income benefit and piloting it in the next year or two with a plan sponsor.

BlackRock, according to that version of the story, wants to persuade at least one life insurer that its future in the defined contribution space lies in putting insurance inside a BlackRock investment wrapper, so to speak, where the insurance part isn’t so visible and scary.

“The best way for the insurance industry to be successful is for the asset management industry to see [its products] as another asset class. All of a sudden, you’re no longer on the other side of the fence. The advisor will see [annuities] as a natural component in the portfolio. Then the opportunity for you to grow will be ten-fold. If insurance folks are smart, like the Alliance for Lifetime Income seems to be, they will be the first in line to support the mentality we’re starting to see from BlackRock.”

That might be overestimating both the enthusiasm of the life insurers for the defined contribution space, where Prudential’s IncomeFlex has gotten little penetration, as well as their appetite and capacity for a lot of new equity-linked risk. While the big variable annuity issuers support the Alliance for Lifetime Income’s public relations effort, the variable-annuity-with-lifetime-income-rider business has been shrinking since 2014.

Others are not convinced that BlackRock wants to take on the complexities of retirement risk mitigation. “On first pass, it looks RINO—retirement in name only—a defined contribution savings and investment (for retirement) play, not a process to manage risk exposures in retirement,” said Francois Gadenne, chairman and executive director of the Curve Triangle & Rectangle Institute and a long-time observer of the retirement industry landscape.

“I think BlackRock’s deal with Microsoft is similar to [Ric] Edelman’s deal with Financial Engines as well as Envestnet’s deal with Yodlee. All three cases are efforts to pair a monetization engine with client-data fuel. The next question becomes: Who in the financial industry will do the matching deals with Facebook, Apple, Netflix, Google, etc.?”

An executive acquainted with the challenges of introducing income solutions into the define contribution space told RIJ, “The news release doesn’t say much beyond the fact that Fink and Nadella met and agree that there’s a retirement crisis and that by using investments and technology they might be able to solve for it. But there’s a bunch of tools out there already; the issue isn’t tools but utilization.

“Also, BlackRock doesn’t have a retirement platform, so I don’t know how they can get access to participants. If they want to partner with someone, it would have been better to partner with Intuit, which owns Mint.com. Microsoft got rid of Microsoft Money [in 2009]; if it wanted data it wouldn’t have done that. I’m not sure what the point of the press release was. Maybe just to cause distraction.”

*                        *                        *

BlackRock’s announcement could also be interpreted as a cry for help. The big DCIO [defined contribution investment-only] mutual fund and ETF firms are at risk of being marginalized out of the $27 trillion retirement income space. Their skills are getting automated and their fees are being compressed. In contrast to Vanguard, Fidelity and other full-service plan providers, they are razor blade makers without their own razor.

But, while they fit well into the pre-retirement space, they don’t line up as well against the post-retirement challenge. That’s because the asset managers are by nature risk sellers, and retirees, whether they know it or not, are inherent risk sellers too. They need a counterparty that will buy some of their risk.

The beauty of the asset management business is that the customer owns the risk. (This is not true for asset managers who also invest on their own behalf; that’s another business.) The asset managers can offer retirees products that diversify risks (balanced mutual funds), that carry smaller risks (bonds and bond ladders), that hedge risks (managed-volatility, dynamically-allocated funds), and that charge almost nothing for risk (exchange-traded funds).

But asset managers don’t buy risk. They can’t buy risk; it’s not how they make money. That hinders them in the retirement income space, where millions of mass-affluent retirees arguably need to sell some of their longevity risk. (The asset managers have, it’s true, entered the longevity game via variable annuities with living benefits. But the life insurers themselves have retreated from that game, preferring to wrap income riders around less volatile indexed annuities.)

Life insurers, on the other hand, are longevity risk buyers. They match up well with longevity risk sellers. Instead of upside potential, they offer mortality credits. So far, it’s mainly the mutual companies with career agent forces, like New York Life, that have a big appetite for the risk inherent in plain vanilla income annuities.

That reflects a difference in business models. Publicly held life insurers must sell products with bigger profit margins than conventional income annuities generate. Those same insurers also tend to distribute through third-parties, most of whom don’t earn enough on the sale of life annuities to take a big interest in selling them. But that’s fodder for another day.

In short, retirees need long-term counterparties who buy or share longevity risk. The DCIO asset managers like to date their clients, and even go steady. But they shy away from deep commitments. They’re not the marrying kind. The life insurers are better equipped to form long-term relationships with Boomers. Ironically, they have an even tougher time getting into the defined contribution space than asset managers do.

© 2018 RIJ Publishing LLC. All rights reserved.

New Jersey to establish auto-enrolled IRA for workers without plans

The New Jersey Assembly on Dec. 17 passed a bill that would establish a state-run employment plan for private-sector employees whose employers have not offered a retirement plan in the preceding two years, NAPANet reported this week.

In a 52-24 vote, the Assembly approved A 4134, a bill that would establish the New Jersey Secure Choice Savings Program. A December 10 statement from Assembly Appropriations Committee described the program as “an automatic enrollment payroll deduction Individual Retirement Account for certain private sector employees.”

Like similar initiatives in California and Oregon, New Jersey’s plan requires employers who don’t currently offer a retirement plan to “establish a payroll deposit retirement savings arrangement to allow its employees to participate in the plan.” Employees are auto-enrolled but can opt-out of the plan.

States where Democrats control the legislatures have taken the lead in establishing these plans. Legislators there and in other states hope to address the problem that too many of their states’ workers don’t have access to a retirement savings. Those workers are at risk of under-saving for retirement and relying on public services in their old age.

The private retirement plan industry has been ambivalent about these plans. Some industry members expect mandates to drive employer adoption of private retirement plans. Others resist competition from a “public option” in the retirement plan space. Still others worry that such plans will produce a “patchwork” of retirement plans across the 50 states. But the Trump administration has abolished the Obama Administration’s MyRA national auto-enrolled IRA program.

“Open multiple employer plans,” which are the subject of legislation currently before Congress, are a private-sector alternative to the state plans. Some believe that these open MEPs could shrink the coverage gap that state plans are addressing. At any given time, only about half of U.S. workers have access to a retirement plan at work. Low-income and minority workers are especially likely to work at small firms that don’t offer retirement plans.

The New Jersey plan may offer a variety of to-be-determined investment options, the bill said, but the default investment will be a target-date “lifecycle” fund. Fees can’t exceed 75 basis points per year. Businesses less than two years old and businesses that have employed fewer than 25 people in the past calendar year don’t have to participate in the program but they can.

Further details about the program will be established by a New Jersey Secure Choice Savings Board and the finances of the program will be paid out of a New Jersey Secure Choice Administrative Fund.

The bill established penalties for covered employers who don’t help their employees participate in the program or who mishandle funds. The penalties start with a warning, and include a $100 fine for not enrolling employees who haven’t opted out, and become as severe as $5,000 for employers who collect employee contributions but don’t remit them to the savings fund.

The bill was introduced by Assembly members Roy Freiman (D-Hunterdon, Mercer, Middlesex and Somerset), Raj Mukherji (D-Hudson) and Carol Murphy (D-Burlington). The Assembly Financial Institutions and Insurance Committee reported A4134 favorably on Oct. 15, and the Assembly Appropriations Committee followed suit on Dec. 10.

The Senate version, S. 2891, was introduced on Aug. 27. The Labor Committee of the New Jersey Senate approved the bill on Dec. 3 and referred it to the Senate Budget and Appropriations Committee.

© 2018 RIJ Publishing LLC. All rights reserved.

Prudential surveys ethnic, gender finances

Averages are of little or no use for demographic studies. They show you how many numbers are above or below a halfway line, but they don’t tell you anything about people. They can mask a dramatic situation. They can be used to mislead. Averages are more of a crime than a law.

Medians aren’t ideal for demographic analyses either, but they do take humans into account. They show you how many people are above or below a halfway line. In its new study of incomes of various ethnic and gender groups in the U.S., Prudential Financial uses median figures.

Prudential has just published “The Cut: Exploring Financial Wellness Across Diverse Populations,” a follow-up to its 2018 Financial Wellness Census. Both documents support Prudential’s recent emphasis on financial wellness programs in retirement plans.

All of the major retirement plan providers have jumped on the financial wellness bandwagon as a way to extend, integrate and make stickier their product offerings to plan participants, whose post-employment flow into rollover IRAs they’d like to slow or capture.

In “The Cut,” Prudential offers comparative survey data on six groups: Asian-Americans, Black Americans, Latino Americans, Women, members of the Lesbian-Bisexual Gay-Transgender community (LBGT), and Caregivers (people who are employed but who also provide care for an elderly, ill or disabled person at home). These groups are benchmarked against Prudential’s statistics on “the general population.”

Asian-Americans

While Asian-Americans represented only about one in 20 American in 2015, Prudential’s 2017 survey found that they had the highest median incomes of any ethnic group. The median household income for Asians was about $81,000, or 19% above the median for non-Latino whites.

Foreign-born Asian-Americans were concentrated at the high end of this group, possibly due to “foreign-born Asians skewing older as well as immigration regulations favoring highly-skilled immigrants.” Immigrants from India, the Philippines and Japan had the highest household incomes. Immigrants from Bangladesh, Nepal and Burma had the lowest, according to Pew Research Center data cited by Prudential.

Asian-Americans are the biggest savers, the most likely to send money to relatives overseas and the most likely to act as caregivers. Foreign-born members of this group save or invest 47% of their monthly income in accounts marked for growth or retirement, and are the group most likely to use a workplace retirement savings plan.

For U.S.-born Asians, the percentage was 36%. For the general population, the figure was just 10%. “Asian-Americans spend only about 20% of their monthly income on necessities, while the general population spends 46% on average,” Prudential said.

African-Americans

Despite the palpably high representation of African-Americans in television commercials for financial services and luxury goods, Black Americans, along with Latino Americans, lag behind the general population in savings and preparation for retirement, Prudential’s survey showed. But there was an indication that conditions for Black Americans are changing.

“Nearly half of higher-income black households surveyed [those with incomes above $60,000 a year] are Gen X, for example, while less than one in five are Baby Boomers,” Prudential found. “Among the general population, the reverse is true: Boomers accounted for 42% of higher-income households and Millennials only 24%.”

About 60% of Black Americans have incomes below $50,000, while about 10% have incomes over $100,000, according to charts in The Cut. Those with incomes over $60,000 have an average of about $54,000 saved for retirement compared with an average of $276,400 for the general population that has income over $60,000.

Caregivers

People of color are more likely to be caregivers, Prudential found. While more than 30% of Black, Asian, and Latinos reported providing caregiving services, only 22% of white Americans did. Thirty-eight percent of caregivers said they don’t think they would ever be able to retire, for example, versus only 25% of non-caregivers.

The circumstances of caregivers depended in part on whom they cared for. “Those caring for someone other than a parent, spouse or child are more likely than other caregivers (28% versus about 21%) to have household incomes under $30,000 per year, and are notable exceptions. Those caring for spouses tended to be older and have slightly higher incomes than other caregivers.

Income data for Latino-American and LBGT households was lower than that of the general population, in part because those groups skew younger than the general population and are not as advanced in careers. More than half of LBGT women have children, versus 17% of LBGT men.

“The average annual income for women in our sample was $52,521, compared with $84,006 for men—a difference of 37%,” Prudential said. “Women are earning about 63 cents for every dollar earned by men. Lower incomes mean less money available today for saving and investing, and lower Social Security benefits tomorrow for retirement—a double whammy for women after they leave the workforce.”

© 2018 RIJ Publishing LLC. All rights reserved.


Honorable Mention

Fed raises benchmark rate by 25 basis points

The Federal Reserve raised its benchmark interest rate on Wednesday and signaled that it expects additional rate increases next year in a display of measured confidence in the economy that came despite financial market worries and political pressure to suspend rate increases, the New York Times reported.

Jerome H. Powell, the Fed’s chairman, emphasized the continued strength of economic growth at a news conference after the announcement. He acknowledged new strains in recent months, including weaker growth in Europe and China and a downturn in stock prices, and he said the Fed expects slightly slower domestic growth and fewer rate increases next year.

But he defended the Fed’s decision to increase rates. “We think this move was appropriate for what is a very healthy economy,” Mr. Powell said. Mr. Powell’s remarks were described by one analyst as a dose of “tough love” for financial markets.

Mr. Powell insisted on the wisdom of the Fed’s plans to raise borrowing costs while investors dumped their holdings. Stock prices fell when the Fed released its policy statement at 2 p.m., and dropped again as Mr. Powell spoke. The S&P 500 was down 1.5% on the day and is now down 6% on the year.

The decision to raise rates for the fifth consecutive quarter, by a unanimous vote of the Federal Open Market Committee, amounted to a rejection of the view that the Fed should continue to stimulate the economy in the hope of increasing employment and wage gains. The benchmark rate will now sit in a range from 2.25% to 2.5%, abutting the lower end of what Fed officials consider the neutral zone: the region in which rates would neither stimulate nor restrain the economy.

“Policy at this point does not need to be accommodative,” Mr. Powell said of that milestone.

A.M. Best affirms the ‘A’ ratings of AXA Equitable Life

A.M. Best has removed from under review with developing implications and has affirmed the Financial Strength Rating (FSR) of A and the Long-Term Issuer Credit Rating (Long-Term ICR) of “a+” of AXA Equitable Life Insurance Company.

In March 2018, the ratings of AXA Financial, Inc. and its life insurance subsidiaries were placed under review with developing implications following AXA S.A.’s announcement that the group had entered into an agreement to acquire 100% of XL Group Ltd (XL) for a cash consideration of $15.3 billion (EUR 12.4 billion).

In May 2018, AXA S.A. executed a partial IPO of AXA Equitable Holdings, Inc., a new U.S. holding company with and into which the former AXA Financial, Inc. was merged.

AXA S.A. completed this partial IPO of the U.S. operations on September 12, 2018 and made a secondary offering of AXA Equitable Holdings, Inc. common stock in November 2018, allowing A.M. Best to conclude its assessment of the impact of these events.

Regarding AXA Equitable Holdings’ variable annuity business, A.M. Best said:

While AXA Equitable intends to maintain its very strong risk-adjusted capital profile going forward, it remains exposed to equity market pressures on both sides of the balance sheet.

These pressures emanate from its investment in AB and through its variable insurance products with guaranteed benefits, as well as potential volatility in revenue from asset fees as a result of market value changes in its large separate account book of business and derivative activity.

A.M. Best notes that the exposure from VA guarantees is managed effectively through reinsurance and hedging programs. In recent years, AXA Equitable has developed and introduced new and innovative products with the objective of offering a more balanced and diversified product portfolio while reducing product design risk. More recently, the company is looking to expand its product offering with product solutions tailored to the employee benefits marketplace.

According to A.M. Best, the new ratings reflect AXA Equitable’s balance sheet strength, which A.M. Best categorizes as very strong, as well as its strong operating performance, favorable business profile and appropriate enterprise risk management (ERM).

AXA Equitable’s rating affirmations are attributable to its very strong and improved risk-adjusted capitalization, strong financial flexibility, sophisticated risk management practices and its position as a leading variable annuity (VA) and universal life writer and global asset manager.

A.M. Best notes that in advance of AXA Equitable Holdings, Inc.’s partial IPO earlier this year, AXA S.A. made a capital contribution of more than $2 billion to the U.S. operations, resulting in a material improvement in its stand-alone risk-adjusted capital position.

AXA Equitable also benefits from a diversified and productive distribution model, which includes a recently increased ownership stake in AllianceBernstein (AB), a large publicly traded global investment management firm.

Also, AXA Equitable post-IPO continues to maintain an appropriate ERM framework with a focus on hedging strategies to protect its statutory and economic capital.

In anticipation of being a stand-alone U.S. entity, the company has updated its economic capital model to be more U.S.-centric by shifting away from Solvency II framework to a U.S. economic and risk-based capital/contingent tail expectation-centric capital model.

Additionally, asset risk consists of a well-diversified portfolio of invested assets, which are considered to be well managed.

A.M. Best notes that a deviation of methodology applies to the determination of the ratings of the following four subsidiaries of AXA Equitable. These subsidiaries were afforded rating enhancement from AXA Equitable despite the fact that it is not currently the lead rating unit as defined by Best’s Credit Rating Methodology (BCRM).

AXA S.A. (the ultimate parent), which is currently the lead rating unit for the group, has publicly made its intention clear to divest its majority interest in the U.S. operations over the near term, at which point it is A.M. Best’s expectation that AXA Equitable will become the lead rating unit, enabling it to afford rating enhancement to these four subsidiaries as per BCRM:

  • The FSR of A (Excellent) and the Long-Term ICR of “a” have been affirmed and assigned a stable outlook for MONY Life Insurance Company of America (Phoenix, AZ), another subsidiary of AXA Equitable.
  • The FSR of B+ (Good) and the Long-Term ICR of “bbb-” have been affirmed and assigned a stable outlook for AXA Corporate Solutions Life Reinsurance Company (Delaware).
  • The FSR of A (Excellent) and the Long-Term ICR of “a” have been affirmed and a stable outlook assigned for U.S. Financial Life Insurance Company (Cincinnati, OH).
  • The ratings have been removed from under review with developing implications and the FSR has been downgraded to B++ (Good) from A- (Excellent) and the Long-Term ICR downgraded to “bbb” from “a-” and assigned a stable outlook for AXA Equitable Life and Annuity Company (Denver, CO).
DPL Financial’s insurance platform for RIAs to offer no-commission Security Benefit annuity

DPL Financial Partners, the insurance product sales platform for registered investment advisors (RIAs), has agreed to begin offering a four-year version of Security Benefit’s Advanced Choice fixed-rate annuity to RIAs nationwide.

Advanced Choice is Security Benefit’s multi-year guarantee rate annuity (“MYGA”) product and the four-year guarantee period version is being offered commission-free exclusively through DPL, a release by the two companies said.

Security Benefit’s Advanced Choice Annuity can be purchased as an IRA, Roth IRA, 403(b) rollover or non-qualified contract. The product is available now through DPL.

Contaminated baby powder could lead to ERISA suit against Johnson & Johnson

Zamansky LLC, a Manhattan-based law firm specializing in securities and investment fraud, is investigating Johnson & Johnson Inc. for potential violations of the federal Employee Retirement Income Security Act (“ERISA”) related to the recent lawsuit filed against Johnson & Johnson over possible asbestos contamination of its iconic baby powder.

The firm wants to find out if Johnson & Johnson failed in its ERISA-mandated fiduciary duties by continuing to offer J&J stock as an investment option to the participants in the J&J Retirement Savings plan while it knew of liability exposure related to the powder.

On December 14, 2018, Reuters reported that internal Johnson & Johnson documents produced in a lawsuit involving cancer-causing asbestos found in baby powder reflect that company senior officers and lawyers knew for many years about the contaminated talc.

The documents showed that raw talc and finished powders sometimes tested positive for asbestos, and company executives, line managers, scientists, doctors and lawyers fretted over the problem and how to address it while failing to disclose the problem to regulators or the public while discussing it internally. These revelations caused Johnson & Johnson stock to fall by 10% in mid-December.

BNY Mellon to buy back more shares

BNY Mellon has received approval from the Federal Reserve and its board of directors to immediately increase its repurchase program of common stock by up to an additional  $830 million through the second quarter of 2019. These repurchases augment the company’s repurchase of $2.4 billion of common stock previously announced on June 28, 2018.

As of September 30, 2018, BNY Mellon had $34.5 trillion in assets under custody and/or administration, and $1.8 trillion in assets under management. BNY Mellon can act as a single point of contact for clients looking to create, trade, hold, manage, service, distribute or restructure investments. BNY Mellon is the corporate brand of The Bank of New York Mellon Corporation (NYSE: BK).

Single retirees need retirement advice: LIMRA SRI

The clichéd images of white-haired couples combing beaches together or canoodling in his-and-hers Adirondack chairs don’t apply to the millions of single retirees, but those soloists need just as much help from advisors as couples do, according to LIMRA Secure Retirement Institute.

There are 7.6 million single pre-retiree and retiree households (aged 55 and over) with assets of $100,000 dollars or more, according to LIMRA SRI. In total, U.S. post-retirees have about $6 trillion in savings. Only 38% of single retiree households work with an advisor.

Single retirees require special attention in retirement planning, a LIMRA release said. As a group, they are measurably less confident than married retirees. Only about two-thirds (64%) are confident that they “can live the lifestyle they want” in retirement, compared with 71% of retirees in couples.

Four in ten single retirees believe their savings won’t last if they live to age 90, but only about one third of married or partnered retirees feel the same way, the release said. Just 57% of single retirees are living the retirement they pictured, compared with almost 70% of married retirees.

© 2018 RIJ Publishing LLC. All rights reserved.

Life/annuity industry upgraded to stable from negative by A.M. Best

A.M. Best has revised its market segment outlook for the U.S. life/annuity (L/A) industry to stable from negative for 2019, citing increased profitability, improved regulatory and tax environments and a strengthening U.S. economy, along with overall reduced balance sheet risk due to a proactive approach taken by companies in recent years.

A series of Best’s Market Segment Reports includes a discussion of A.M. Best’s outlook revision and views on the entire L/A industry, as well as the individual life insurance and annuity segments. Overall, the stable outlook reflects the improved risk-adjusted capitalization and liquidity of L/A industry participants.

Although volatility ratcheted up in the second half of 2018, A.M. Best expects the equity markets and interest rate movements to be net positives for operating performance. Business profiles in general are stronger, as companies continue to focus on core business lines and make use of alternative risk transfer mechanisms to shed risk. Enterprise risk management programs also continue to evolve to further identify and manage current and evolving risks.

The market segment reports outline other factors that are driving the outlook revision, including the following:

Products such as indexed universal life, which offer higher potential crediting rates under favorable equity market conditions, and other protection-based products continue to sell well despite overall flat premium trends in the life insurance segment.

Individual annuity sales increased 11% through third-quarter 2018, following three years of declines. A.M. Best views the impact of the SEC’s proposed “best interest” legislation as likely to be limited given the industry’s progress in preparing for the changes previously proposed under the vacated U.S. Department of Labor’s fiduciary rule.

Lower effective tax rates going forward will improve U.S. L/A insurers’ earnings, albeit partly countered by a decline in deductibility for absolute tax reserves.

Modestly rising interest rates, coupled with a relatively benign credit environment for the coming year, should bolster portfolio returns, which should restore investment spreads to equilibrium as new money yields gradually approach existing portfolio returns.

Insurers continue to take on greater risk in their investment portfolios, through either higher credit risk or lower liquidity, but many have done so by employing a barbell strategy. A.M. Best believes this approach works in a modest economic downturn but could have a greater negative impact on surplus if a more recessionary environment unfolds.

The divide between technologically superior companies and much smaller, less tech-savvy companies is getting wider. However, insurers overall acknowledge their shortcomings with respect to innovation. A.M. Best believes companies that take a measured, methodical approach to identifying where innovation can best help them now and in the future will compete effectively.

© 2018 RIJ Publishing LLC. All rights reserved.

Survey shows how advisors generate income for clients

Over 70% of financial advisors believe it will take a significant correction in the equity markets to wake all investors up to the portfolio benefits of fixed income investing, according to a new survey released today by Incapital LLC, an underwriter and distributor of fixed income securities.

The survey of 200 financial advisors found that investors generate income primarily from dividend-paying stocks and equity income mutual funds.

The average asset allocation among the clients served by the advisors surveyed was:

  • Equities: 46%
  • Fixed income: 27%
  • Cash: 14%
  • Alternatives: 9%
  • Other: 4%

Half of the surveyed advisors expect their clients to increase allocations to fixed income or cash over the next 12 months; 29% expect an increase in equities. Principal protection has become a top priority for their clients, according to 76% of the advisors surveyed.

“With increased volatility in the market, we believe investors will now be far more receptive to assessing some of the potential benefits that are typically associated with fixed income. This is especially true among investors who have taken equity risk for income, and those who now may be focused on principal protection and a fixed and predictable stream of income,” said Paul Mottola, managing director and head of capital markets at Incapital, in a release.

Advisors surveyed seek three top benefits from fixed income investing for clients:

  • A predictable rate of income: 53%
  • Portfolio diversification: 51%
  • Return of principal at maturity: 38%

Eighty percent of advisors surveyed said they were bullish on bond ladders as an aid to managing interest rate risk. The risk of rising rates was the advisors’ top-ranked concern with fixed income investing, followed by finding attractive yields and generating income without adding portfolio risk.

Almost two-thirds (64%) of advisors said that bond ETFs (exchange-traded funds) have changed the definition of fixed income investing away from predictable income and return of principal to fixed income exposure. But bond ETFs do not provide all of the benefits of individual bonds, Mottola said.

“Most bond ETFs provide many important benefits, such as portfolio diversification and market liquidity. However, their income is generally not fixed, and in many cases their interest rate sensitivity remains constant over time, unlike a bond, which declines over time as the maturity date grows closer. This is an important consideration, especially given the risk of rising interest rates,” he said.

Among the investments typically used by advisors to generate income for clients, dividend-paying stocks led the way at 51%. Individual bonds were used 38% of the time.

  • Dividend-paying stocks (51%)
  • Equity income mutual funds (43%)
  • Annuities (43%)
  • Bonds (38%)
  • Bond mutual funds (39%)
  • Bond ETFs (29%)

Asked what would get them to use more individual bonds in their clients’ portfolios, 38% of advisors surveyed said “a rate increase.” They also want:

  • A simplified process to access bonds (32%)
  • Access to better online tools for evaluating bonds (28%)
  • Better education on bond investing (24%)

Almost two-thirds of the advisors surveyed (63%) believe that the bull market in bonds is over, or will be within 12 months.

Q8 Research LLC conducted the online survey for Incapital. A total of 200 financial advisors across channels completed the survey between September 20 and October 1, 2018. Advisors from wire houses, regional dealers, independent dealers, banks and registered investment advisors were surveyed. All respondents had three or more years’ tenure as financial advisors and were involved in portfolio construction decision-making with clients.

© 2018 RIJ Publishing LLC. All rights reserved.

The Newest Retirement Income Fintech

It’s not unusual for male founders of retirement-oriented fintech companies to say that their entrepreneurial inspiration came from watching their pension-less mothers or grandmothers struggle with the complexities of retirement income planning.

Rhian Horgan, a former managing director at J.P. Morgan in New York, told RIJ that she was inspired to start her retirement oriented fintech firm, Kindur, after watching her father struggle with his transition into what, in industry jargon, we sometimes call the decumulation stage.

“My father is 69. He was part of the Boomer generation who delayed their retirements because of the 2008 financial crisis,” said Horgan, who received $9 million in venture funding this week, and plans to open for business in January 2019. When she talked to her father about his finances, she discovered that his problem wasn’t a savings shortfall but a complexity surplus.

Her parents owned about eight different retirement and brokerage accounts, all custodied in different institutions, she said. Her dad kept track of them all in his head. Her mother, silo-ed in traditional domestic affairs, knew little about the couple’s finances.

Rhian Horgan

Horgan, who joined J.P. Morgan in 1999 from William & Mary College, eventually rising to head of alternative investment strategies in the asset management division, looked for applicable solutions but found no online tools that fit. “Most of the talk in the fintech world was about saving—about getting people to retirement,” she told RIJ. “My dad’s problem was happening later in the process.”

So she decided to start her own fintech company, calling it Kindur (with a short i). Over the past two years she assembled a 16-member team not of young coders but of people with experience building asset allocation models or trading exchange-traded funds at firms like Fidelity Investment, Capital One, and J.P. Morgan. Other team members came from Earnest, which refinances student loans, and Seamless, the food delivery app. Kindur’s offices are in Manhattan’s Flatiron district, not far from Betterment, the accumulation-oriented fintech that started about four years ago—an eternity in fintech time.

Kindur, by contrast, is designed for people who are about to retire or have recently retired. It will help them generate steady retirement paychecks from savings of $500,000 to $2 million. About 25% of Boomer households, excluding the wealthiest one percent, have accumulated savings in that range, Horgan said.

A press release this week called Kindur “a new kind of financial services company designed to help baby boomers navigate their complex financial lives. Through straightforward digital advice and its signature retirement paycheck, Kindur makes sense of savings, insurance, social security and healthcare costs so users can focus on enjoying a hard-earned retirement with confidence.”

Kindur is a registered investment advisor with insurance licensing, and the paychecks will come partly from annuity payouts and partly from flexible withdrawals from an investment portfolio. Horgan is withholding details about her life insurance partner and the type of annuity she’ll offer until January. But she described the contract as a fixed annuity—not fixed indexed or fixed income—with an income option that clients can turn on when they want to. It sounds like a guaranteed lifetime withdrawal benefit, but she wouldn’t confirm that.

Clients can get occasional help from a Kindur “coach” but they’ll deal mainly with a self-service, algorithm-driven advice engine. “This is not going to be a customized financial planning service,” Horgan said. “But a coach is there to help answer questions about Social Security, for instance.” Horgan’s research shows that her target market hangs out on Facebook, her research shows, so Kindur plans to use the (increasingly controversial) social media giant to reach it.

As for Kindur’s revenue model, “We don’t generate any revenue from sales of specific investments. Instead, we align our interests with our customers by charging fees on an assets-under-management basis,” Horgan told RIJ. The specific fee levels will be available at launch in 2019, she added. “You can expect to see an offering which allows our customers to save versus their current fund fees and enables them to use these additional savings to keep funding their retirement.”
On December 12, Kindur announced the close of a $9 million Series A round of financing, including investments from Anthemis, Point72 Ventures and Clocktower. Anthemis has made previous investments in Betterment and many highly specialized fintech startups in banking, insurance, payments, and wealth management. Point72 Ventures has investments in, among many other start-ups, the “micro-investing” app Acorns.

A Series A round is typically a company’s first significant round of venture capital financing. The name refers to the class of preferred stocks sold to those investors. It is usually the first series of stock after the common stock and stock options issued to founders, friends, family and angel investors.

© 2018 RIJ Publishing LLC. All rights reserved.

FIA sales will exceed VA sales by end of 2021: Cerulli

Fixed-indexed annuities (FIAs) and structured annuities are expected to see improved sales growth over the next few years, according to new research from Cerulli Associates.

“This finding could create new growth for insurance carriers looking for new opportunities to innovate their product offerings. Today, only 22% of surveyed carriers offer structured products,” a Cerulli release said.

Cerulli projects that FIAs will grow to 40% of total annuity production by 2023, which would put them on track to exceed sales of traditional variable annuities (VAs) by year-end 2021. Insurers continue to develop and enrich FIAs as many believe they offer advantages in almost any market environment: if interest rates rise, insurers can raise crediting rates; if rates are low, clients can focus more on index strategies, knowing they have downside protection.

“Indexed and structured annuities will likely fuel overall annuity industry sales growth over the coming years, although a rebound to the record years of 2007 and 2008 is unlikely to come any time soon,” said Donnie Ethier, director at Cerulli, in the release.

“As already seen to an extent in 2018, rising interest rates will add to the value proposition of traditional fixed annuities and income annuities. Any market downturn would also help FIAs continue to outpace VA sales.”

Total annuity industry sales were down in 2017, as a result of downward pressure from the Department of Labor Conflict of Interest Rule. However, the delayed implementation and subsequent repeal of the rule fueled a sales recovery, specifically for FIAs and VAs. Now insurers need to watch potential state-specific decisions.

“Cerulli forecasts that annuity sales will become more balanced across the major product types over the next five years,” explains Ethier. “Indexed annuity sales are expected to grow steadily and outpace traditional VA sales by 2021.” Ethier said, “Although a few VA carriers have increased the attractiveness of their optional guarantees, Cerulli does not see the sales trend reversing unless a greater number of VAs follow.”

Cerulli’s latest report, “U.S. Annuity Markets 2018: Remaining Well Capitalized and Adaptive,” analyzes the U.S. annuities marketplace, including distribution, product development, and asset management opportunities.

FIA sales, VA assets hit record highs in 3Q2018: IRI

Fixed index annuity sales ($18 billion) and variable annuity assets ($2 trillion) hit record quarterly highs in the third quarter of 2018, according to the Insured Retirement Institute (IRI), Beacon Research and Morningstar, Inc.

“While sales dipped a bit in the third quarter, we believe annuity sales will continue to improve given the reduction in disruption and uncertainty following the demise of the DOL fiduciary rule last spring,” said IRI President and CEO Cathy Weatherford, in a release. “We expect fourth quarter sales to remain strong and continue into 2019.”

For the entire fixed annuity market, there were approximately $17.9 billion in qualified sales and $13.9 billion in non-qualified sales during the 2018 third quarter.

“We expect all fixed annuity product types to continue showing robust growth in 2019 in an investment environment that is likely to be marked by higher interest rates and increased market volatility,” said Beacon Research CEO Jeremy Alexander.

Variable annuity net assets rose in the third quarter as the bull market in equities continued to drive higher valuations in subaccount assets, according to Morningstar. Assets reached $2.0 trillion, up 1.9% from the second quarter and up 2.4% from the year-ago third quarter. Net asset flows in variable annuities were again in negative territory, at -$19.4 billion in the third quarter, but that was an 8.1% improvement over -$21.1 billion in the second quarter of 2018.

Within the variable annuity market, there were $14.9 billion in qualified sales and $8.1 billion in non-qualified sales during the third quarter of 2018. Qualified sales fell 3.7 % from second quarter sales of $15.5 billion, while sales of non-qualified variable annuities were down 5.5 % from second quarter non-qualified sales of $8.6 billion.

“Strong market performance pushed assets under management past [a record] $2 trillion,” said Michael Manetta, Senior Quantitative Analyst at Morningstar. “While we still see weakness in VA sales, levels are recovering from record lows reached last year, and sales should continue to improve in 2019 as rising interest rates have a positive effect on lifetime income benefit features and insurer risk capacity.”

Total annuity sales
  • $54.9 billion. Industry-wide annuity sales in the third quarter of 2018
  • 0% decrease from sales of $56.0 billion during the second quarter of 2018
  • 20% higher versus third quarter of 2017 sales of $45.8 billion
  • $159.3 billion. Year-to-date total annuity sales
  • Up 7.1% from 2017 third quarter year-to-date sales of $148.8 billion
Fixed annuity sales
  • $31.8 billion in 2018 third quarter fixed annuity sales; flat compared to second quarter
  • Up 40.9% from 2017 third quarter sales of $22.6 billion
Variable annuity sales
  • $23.0 billion in 2018 third quarter variable annuity total sales
  • Down 4.4% from 2017 second quarter sales of $24.1 billion
  • 1% higher than 2017 third quarter VA sales of $20.9 billion
Fixed indexed annuity sales
  • $18.0 billion in 2018 third quarter sales, a record
  • 1% increase versus 2018 second quarter sales of $17.6 billion
  • 7% higher versus 2017 third quarter sales of $13.0 billion
  • At $7.0 billion, book value annuities sales were virtually flat in 2018 third quarter
  • 2018 third quarter sales 56.4% higher versus 2017 third quarter sales of $4.4 billion
  • $4.1 billion in market value adjusted (MVA) annuities sales, down 4.3% from 2018 second quarter sales of $4.3 billion
  • Up 53.3% from third quarter 2017 sales of $2.7 billion
Income annuity sales
  • 8% decrease from 2018 second quarter income annuity sales of $2.9 billion
  • 3% higher than 2017 third quarter income annuity sales of $2.5 billion

© 2018 RIJ Publishing LLC. All rights reserved.