Archives: Articles

IssueM Articles

Vanguard uses blockchain to share index data

In a pilot program, Vanguard, the Center for Research in Security Prices (CRSP), and Symbiont are cooperating to use blockchain technology to “simplify the index data sharing process,” Vanguard announced this week. Index data will move instantly between index providers and market participants over one decentralized database.

“Investment managers will be able to instantly distribute, receive, and process index data, resulting in better benchmark tracking and significant cost savings,” said Warren Pennington, a principal in Vanguard’s Investment Management Group, in a release.

For several months, CRSP has distributed daily index data to Vanguard in a testing environment through Symbiont’s blockchain platform. Delivering the data via a blockchain and automating workflows with smart contracts has served to expedite data delivery, eliminate the need for manual updates, and reduce risks.

Currently, index data transmission, which is essential to many operations within the financial services industry, including portfolio construction and strategy execution, relies on multiple parties and distribution channels to reach investment professionals.  

The success of this initial pilot will enable automation of CRSP index data delivery and intra-day updates over the private blockchain network in early 2018. Vanguard, Symbiont, and CRSP will also use the results of this initiative to influence future blockchain efforts.

© 2017 RIJ Publishing LLC. All rights reserved.

Honorable Mention

Fujitsu settles excessive fee case for $14 million

In the settlement of a class action lawsuit over excessive retirement plan fees, Fujitsu Technology and Business of America, Inc., has agreed to pay $14 million to the participants of the Fujitsu Group Defined Contribution and 401(k) Plan. The settlement equals about $600 per class member and about one percent of plan assets, NAPA Net reported this week.

In addition to the payout, Fujitsu agreed to undertake a request for proposal (RFP) process “to reduce the amount of recordkeeping expenses paid by the Plan and already has voluntarily taken steps to reduce the amount of investment management fees paid by the Plan.”

In the suit, filed in 2016 in the U.S. District Court for the Northern District of California plaintiffs claimed that in 2013, total fees amounted to approximately 0.88% of plan assets (about $11,400,000), and that in 2014, total fees amounted to approximately 0.90% of plan assets (about $11,900,000) – fees that they claimed were almost three times higher than the average for plans of similar size – and that the suit alleged made it one of the five most expensive defined contribution plans out of approximately 650 plans with assets of more than $1 billion.

Holland ponders the effect of raising its pension age

If the Dutch government raised the country’s state pension age in line with life expectancy, it would mean that if people were to live till 110, they would have to work past their 90th birthday, according to the Netherlands Bureau for Economic Policy Analysis, or CPB.

The director of the CPB, Laura van Geest, called such an increase “unrealistic.” The Dutch government has already decided to increase the retirement age to 67 in 2020. One year later, the AOW age will increase again by another three months.

In a new report on working longer, the government’s accountants have warned that low-paid workers and the fast-growing group of self-employed workers (known as zzp’ers in the Netherlands) could face serious problems if the state pension (AOW) age keeps rising.

The government opted for this solution as a way of keeping the state pension affordable, with state finances under pressure since the financial crisis. Van Geest proposed a more gradual increase of the AOW age – for example an annual rise of three months – to enable the current generation of older workers to prepare for working longer.

According to Van Geest, such a slowdown of the rising retirement age would cost the government €1.1bn in 2021, but would be almost budget-neutral in the longer term.

The CPB also said that many self-employed hardly saved for their pension and that most of them had no short-term disability insurance, in contrast to full-time employees. This meant zzp’ers lacked a social safety net if they couldn’t work any longer before retirement age. Van Geest also suggested that the government should assess whether self-employed workers could be persuaded or forced to insure themselves.

“Although the government has made different choices for zzp’ers, research has shown that people don’t think properly about their future and don’t expect to get ill,” she said. “If they do get ill, it is too late to arrange something.”

If the retirement age rises, it would be cost-effective for the government to help people take better care of themselves, she added. Life expectancies of lower-educated workers was at least four years less than that of higher-educated employees because of higher rates of smoking, drinking, eating unhealthy food and not exercising, van Geest said. 

T. Rowe Price offers cash flow management tool to participants  

To enhance its “financial wellness” services for plan sponsors and participants, T. Rowe Price Retirement Plan Services has integrated a third-party online cash flow management tool, DoubleNet Pay, into its Workplace Retirement website.

Participants can use DoubleNet Pay to manage their “competing financial priorities by automating their spending and saving for short- and long-term goals,” according to a T. Rowe Price release.

With more plan sponsors becoming aware of the adverse impact of financial anxiety and retirement un-readiness on productivity and workforce management, major plan providers have been adding these types of functionalities to their menus of online participant services. Such tools are increasingly perceived as competitive necessities for plan providers.  

Users of DoubleNet Pay can set up regular deductions from their bank accounts to pay bills, manage debt and fund an emergency savings account. “Each month the identified dollar amounts will be automatically deducted from an individual’s paycheck so they can clearly see and understand their disposable income,” the release said. 

“DoubleNet Pay was created to help people easily pay their bills on time and to start a savings fund before spending their money on discretionary items,” “The tool is significant because individuals are able to enroll in the service annually for less than the cost of a bounced check or the late fee on a credit card,” said Brian Cosgray, DoubleNet Pay’s founder and CEO, in the release.

Quebec raises contribution, replacement rates of DC plans

TowersWatson, the benefits consulting firm, issued a report last week on a recently proposed Canadian law that would raise mandatory contributions to the Quebec Pension Plan (QPP), an earnings-related pension program within the Canadian social security system.

Bill 149, introduced in November, would increase benefits and employer/employee contributions gradually over a seven-year period starting January 1, 2019. It will also amend the Supplemental Pension Plans Act (SPPA), which applies to employer-provided plans in Quebec.

The proposed enhancements mirror those enacted by the federal government in December 2016 for the Canada Pension Plan (CPP), which applies to workers in the other Canadian provinces. Bill 149 calls for these changes to the QPP:

  • From 2019 to 2023, the income-replacement rate at retirement for a Quebec worker will increase in stages from 25% to 33.33% of pay, up to the year’s maximum pensionable earnings (YMPE).
  • From 2019 to 2023, a 2% increase in contributions (1% by employers and 1% by workers) up to the YMPE will be phased in to fund the above benefit enhancements.
  • Covered earnings for determining benefits and contributions under the QPP will be extended by 7% of the YMPE in each of 2024 and 2025, resulting in a final ceiling of 114% of the YMPE.
  • The resulting increased benefits will be funded, from 2025, by an 8% contribution (4% by employers and 4% by workers) on pay above the YMPE.

Bill 149 would also enact changes to the SPPA, affecting employer-provided pension plans registered in Quebec, notably the following:

  • Contributions made to reduce a letter of credit will be accounted for in the employee reserve maintained by the employer.
  • The appropriation and allocation of surplus assets during the life of a pension plan would become increasingly flexible, according to rules that differ from the current default provided under the SPPA.

“Employers and pension plan sponsors will be able to analyze how these changes impact costs, their labor forces’ retirement preparations and the goals they set for their pension programs,” a TowersWatson release said.

Quebec Bill 149 received its first reading on November 2, 2017; however, with the planned changes to the CPP coming into effect in 2019, it is expected that the QPP will be amended to follow suit, TowersWatson said.

U.S. collective investment trust assets reach $2.8 trillion in 2016

Assets in collective investment trusts (CITs) grew to roughly $2.8 trillion as of year-end 2016, representing a year-over-year growth of approximately 11.6%, according to Cerulli Associates, the global research and consulting firm.

The increase reflects the “increasing demand for lower-cost vehicles among institutions,” said Christopher Mason, senior analyst at Cerulli, in a release. “CITs can often be priced lower than mutual funds.”

“Nearly 95% of plan sponsors value the cost savings compared to mutual funds as one of the most important attributes of CITs. Similarly, roughly 90% of consultants feel that the cost savings compared to mutual funds is a very important attribute of CITs.”

“Managers that do not offer CITs should consider doing so, particularly for asset classes or strategies in which cost savings can be passed on to the end-investor,” says Mason.

Cerulli’s latest report, “North American Institutional Markets 2017: Strategies for Implementing Customized Services Across Client Segments,” provides coverage of the rise of institutional custom solutions, particularly liability-driven investing among corporate defined benefit plans, the increased use and adoption of CITs, and the ongoing influence of investment consultants.

Savers want safety and freedom in retirement: Wells Fargo

The Wells Fargo/Gallup Investor and Retirement Optimism Index held steady in the fourth quarter at +140, statistically unchanged from +138 in the third quarter. The index is near its September 2000 high of +147. 

Three-quarters of non-retired investors in the survey have a 401(k) plan, and 57% say the most valued feature of their plan is the “match contribution from their employer.” The next most valued feature is the tax deferral on the money they contribute, which was noted by 33%.

Forty-six% say they would “save less” or “stop saving” in their 401(k) if the tax deferred status of their plan was taken away, whereas 42% say they would “save the same amount.” The survey was conducted by telephone with 1,015 U.S. investors Nov. 1–5, 2017, 67% of whom are non-retired and 33% of whom are retired.

Nearly all non-retired investors agree that “it is important to have a guaranteed income stream in retirement, in addition to Social Security,” but about half of investors are unsure about what products offer guaranteed income throughout retirement.  

Six in ten (61%) want a guaranteed monthly income stream that lasts as long as they need it, even if that meant “giving up access to some of their money.” But 75% of non-retired investors also want the freedom to spend their money as they wish in retirement, even if that means they may run out of money “too soon.”

About half of non-retired investors (53%) have a savings “number” in mind for retirement. Non-retired investors with a specific number in mind say $1 million (median) is the right objective, although 29% say $500,000 or less.

Forty-one percent of non-retired investors have a specific savings number in mind and can also estimate what that sum will generate annually in retirement, but many of these estimates are unrealistic. 

Nineteen percent of non-retired investors have a savings goal in mind and a somewhat realistic assumption of withdrawing up 1 to 5% of their savings every year throughout retirement. The rest are unsure about what their annual draw down would be, or they estimate more than a 5% annual withdrawal rate.  

Wells Fargo Asset Management estimates that a five percent inflation-adjusted annual distribution carries a 20%–30% risk of running out of money in retirement, assuming a well-diversified investment portfolio. 

Investors who say they need to save $1 million or more expect to draw 5% per year, on average, while those who say they need to save less than $1 million expect to draw an average of 7% per year.   

© 2017 RIJ Publishing LLC. All rights reserved.
Cannex Launches Annuity Comparison Tools

“Apple-to-apples” comparisons between annuity contracts or between different types of annuities have always been difficult to make. If it were easier for advisors to determine which contracts are the most “suitable” or in the “best interest” of a client, more of them might recommend annuities.     

Cannex Financial Exchanges, the Toronto-based data company that serves the annuity industry in the U.S., and Canada, wants to remove that barrier to sales. The company has for many years offered a wizard for comparing SPIAs (single premium immediate annuities). It now offers tools for evaluating the relative merits of variable annuities (VAs) and fixed indexed annuities (FIAs).

The tools are called Cannex VA Analysis and Cannex FIA Analysis. Besides helping individual advisors match the right annuity contract or annuity rider with the right client, the product is designed to help brokerages and insurance marketing organizations pick contracts for their shelves and enable life insurers to perform competitive benchmarking.

Cannex, which serves more than 300 broker-dealers, banks, IMOs and other institutions employing some 350,000 advisors or agents, aggregates data on an estimated 50 SPIAs and DIA contracts, 100 multi-year guaranteed-rate (MYGA) fixed deferred annuity contracts, 200 FIAs and t 200 VAs from some 30 issuers who represent an estimated 85% of total sales. The firm receives almost four million requests for quotes on SPIAs each year.  

 “This has been about seven years in the making,” Cannex president Gary Baker told RIJ. “When I joined Cannex in 2010, the first thing that certain clients asked me was, ‘I like what Cannex does with income annuities. Could you please do that with the other annuity products?

“It was difficult for advisors or firms to pull apart the structure of these bundled contracts to assess the income benefits and the death benefits. So there was pent-up demand for transparency. But it was not until we bought the QWeMA business from Moshe Milevsky that we had the elements to do that.” 

The biggest demand for these tools should come from advisors who hope to use the so-called living benefits (lifetime income riders) and death benefits of VAs and FIAs in retirement planning. These riders have turned VAs and FIAs, which once were mainly used as tax-deferred investment vehicles, into popular retirement income vehicles.

Advisors can use the tools to rank the living benefits of various contracts by their minimum monthly payment, average monthly payment (based on Monte Carlo projections of future performance), average income benefit over a lifetime (based on mortality tables) average death benefit and average “total economic benefit” (which combines living and death benefits).

To calculate those amounts, Cannex uses the S&P 500 Index whenever analyzing FIA rider values and a 60/40 stock/bond mix when analyzing VA rider values. “We’re running the same ‘electric current’ through every contract,” Baker told RIJ. “We’ve found that even if you vary the asset allocation to 50/50 or 70/30, it doesn’t seem to change a product’s score or its ranking. Some products do have ceilings on the equity allocation when a rider is chosen, and we’re in the process of adding that to the software.” The tools can compare contracts within or across product categories.

 “We’ll also be able to create a heat map with 100 cells where the advisor can see the performance of a living benefit in various deferral periods. That’s in development right now,” Baker said. For example, the map could help advisors see the optimal number of years that a client should wait before “turning on” an income rider. The heat map could also show how a client’s age at purchase might affect the relative strengths of different products.

“For the first release [of the VA Analysis and FIA analysis tools] through our platform, we decided that the simplest approach would be to look at new annuity sales [rather than exchanges of one annuity contract for another]. We do support transfers off-platform, either for a back-end compliance group that wants to evaluate a transaction, or at the point of sale,” he added.

Cannex expects brokerages and advisors to rely on its tool as evidence of their efforts to establish the suitability (under FINRA rules) or “best interest” (under the Department of Labor’s BICE or Best Interest Contract Exemption) of a contract, and as an indication of due-diligence. To that end, it has obtained a letter from the Wagner Group, the Boston-based employee benefits law firm, testifying to its applicability to that purpose.

“In our view,” the Wagner letter said, “the Cannex Methodology annuity analysis and evaluation software would qualify as an analysis and evaluation tool that registered investment advisors and their IARs [investment advisor representatives] would be able to utilize in accordance with their duty to act with the care, skill, prudence and diligence of a prudent person under (i) the BICE’s best interest standard of care as applicable to rollover advice provided to Retirement Account clients and (ii) ERISA’s Prudent Man Standard of Care as applicable to non-rollover advice provided to Retirement Account clients subject to Title I of ERISA.” 

But “even if there were no DOL rule, there would still be demand for this product,” Baker told RIJ. “The demand for this predates the DOL rule. We’ve shown the new tool to FINRA, and they gave us some feedback on how it can be used to establish the suitability of an annuity sale. A lot of companies are positioning their tools as “DOL” tools, but that’s not our position.”

© 2017 RIJ Publishing LLC. All rights reserved.

Bitcoin is a Bubble. Blockchain is a Breakthrough

Bitcoin is new and exciting. But bitcoin was developed in secrecy by a person or group of people whose identity remains unknown. Its whole purpose is to evade regulation which makes it particularly appealing to the darker side of society—drug dealers, arm sales, terrorists, sex traffickers—which gives it a close link to tax evasion and organized crime. 

While it is being billed as “money,” it is not. It is neither a medium of exchange nor a store of value. Bitcoin purchasers today are doing so solely because they seek the anonymity or because they believe the value of a bitcoin will be higher tomorrow. Thus, it seems to us that bitcoin is more like a tulip than money and does not serve any socially useful economic function.

Having said that, the underlying technology on which it is based is revolutionary and could make identity theft by hackers far more difficult, and eventually eliminate the 2-3% transaction fee typically charged today on credit card transactions. It is important to distinguish between bitcoins and the technological advancement that was used to create it. One is useful, one is not.

The origination of the bitcoin is shrouded in secrecy. It was developed in 2008 by some person or a group of people, using a pseudonym—Satoshi Nakamoto—whose identity remains unknown. That is hardly a confidence-boosting start.

Bitcoins are being billed as a new form of “money.” But money is supposed to be a “medium of exchange” which means that it is a widely accepted means of payment. However, few legitimate businesses today accept bitcoin as a means of payment. Money is also supposed to be a “store of value”. But the value of a bitcoin is wildly unstable and its value can change by 10% or more in a single day. It is hard to imagine any investor choosing to park a large portion of his or her assets in bitcoins given this extreme volatility. Thus, bitcoins do not fit any conventional definition of “money”.

The appeal of bitcoin is that the technology on which it is based makes transactions largely anonymous which explains bitcoin’s appeal to the darker side of society. Most illegal activities from drug and gun sales to prostitution and the sex trade are done in cash. But money laundering is challenging, and bitcoins offer the perfect opportunity to convert a mountain of cash into a useable form without alerting authorities.

But the illegal nature of these transactions is sure to encourage regulators to keep a watchful eye on the market and could lead them to impose regulations which would dampen its appeal. It is also going to attract the attention of crime-busters like the FBI. Silk Road was an online black market best known as a platform for selling illegal drugs. It was shut down by the FBI in 2013 but, unfortunately, many Silk Road look-alikes have emerged.

While recognizing the downside of bitcoin, the blockchain technology on which it is based is revolutionary. In today’s world transactions are cleared by banks which verify that the purchaser has the funds available and transfer the proceeds to someone else’s account. Thus, transactions are controlled by banks. But blockchain can be thought of as a giant private sector database that performs those transactions without the bank or any other central authority.

Once a transaction is recorded the bitcoin network it is encrypted by a formula that can supposedly be unlocked only through a trial-and-error process and eventually the bitcoin proceeds find their way to the seller. The transaction is both anonymous and cost-less. Those are powerful advantages.

As a result, central banks around the world are working feverishly to determine whether adoption of blockchain technology could make it harder for hackers to engage in identity theft. Furthermore, in today’s world a merchant pays a 2-3% fee when a purchaser uses a credit card. Bitcoin technology could eliminate these fees to the middleman. Thus, bitcoin technology offers the opportunity to advance the financial payments mechanism into the 21st century.

As we see it, bitcoins have no socially useful economic function. They are not money and they facilitate the ability of drug dealers, gun sellers, sex traffickers, and terrorists to finance their operations. Bitcoins are only useful to speculators—hedge funds and high-speed trading firms in particular. For these reasons, in our opinion, bitcoin has limited appeal. But the blockchain technology on which it is based is revolutionary and will both enhance cyber-security and make the current payment mechanism far more efficient.  

© 2017 NumberNomics. 

Where Defined Contribution Falls Short

Owning stocks and bonds is the most reliable way to achieve retirement security over the long run. That’s what we’re told and that’s more or less what history has demonstrated. But what percentage of Americans actually holds a retirement-worthy portfolio? The percentage is surprising low.

A few days ago, I received a new research paper by economist Edward Wolff of New York University. According to his review of surveys of U.S. household wealth and income, stock ownership is broad but not deep. About half of Americans own stocks but a small minority owns almost all of it.  

Age explains part of the story, but not all of it. Ownership of investments appears to increase with age, as expected. In 2007, pension accounts, corporate stock, financial securities, mutual funds and personal trusts represented just 10.2% of household wealth for those under age 35 but rose to 33.4% for those ages 65 to 74, according to the paper.

Defined contribution plans deserve much of the credit for that increase. Since the appearance of 401(k) plans in the early 1980s, financial assets have played a bigger role overall in personal wealth. The percent of households owning pension accounts, bonds, corporate stocks and mutual funds was just 14.7% in 1983. In 2016, it was 30.7%. Most of that increase (1.5% to 16.5%) came from the growth of defined contribution (DC) plans and IRAs. The share of all households with a DC plan more than doubled from 24% in 1989 to 53% percent in 2007.   

“Among younger households, the share rose from 31% to 50%, and among middle-aged households it went from 28 to 64%,” Wolff writes. “The average value of DC plans shot up more than seven-fold from $10,600 to $76,800 (all figures are in 2007 dollars). Among younger households, DC wealth rose by a factor of 3.3. Among middle-aged households, the average value of DC plans mushroomed by a factor of 6.5.”

Unequal equity ownership

But only a minority of Americans has become wealthy as a result. Between 1983 and 2013, the top one percent received 45% of the total growth in net worth, while the top 20% got close to 100%. The share of income held by the top 20% rose to 61.8% in 2013 from 51.9% in 1982. The share of wealth held by the top 20% rose to 88.9% in 2013 to 81.3% in 1983. 

The reality is that relatively few U.S. households today have a significant stake in the stock market. In 2016, only 36.8% had total stock holdings worth $5,000 or more, down from 40.1% in 2001; 32.0% owned $10,000 or more of stock, down from 35.1% in 2001; and only 24.6% had $25,000 or more of stocks, down from 27.1% 15 years earlier (all in 1995 dollars). Wolff’s data isn’t entirely consistent, but it all points to almost negligible average equity ownership among a solid majority of American households.

Ownership of stock is much more extensive and intensive at the high end of the wealth spectrum. According to Wolff, 94% of the top one percent of wealth holders own stock and 93% of households in the top 5.2% of income recipients ($250,000 or more) owned stock in 2016.

The top one percent of households (by income) still owns 40% of all stocks. The top five percent owns 71%, the top 10% owns 84% and the top 20% owns 93%. The paper notes that households earning $75,000 or more (the richest 35%) own 91% of all stocks and households earning $50,000 or more own 96%. In other words, only about half of households have any stocks at all. 

What conclusions can we draw from this data? You might say, “So what?” Beauty contests and stock car races always have winners and runner-ups; for every population and every metric, there will be a top 20%, a middle 60% and a bottom 20%. Outside of Lake Wobegon, Minn., not every household can squeeze into the top quintile.

Alternately, you might invoke the 80:20 “Pareto” principle as a law of nature. This rule-of-thumb suggests that, in any population, 20% will account for 80% of performance. Or you might interpret the lop-sided data as evidence that the market justly rewards risk-takers. You could even argue that it’s all relative: Even the poor in America are much richer than most people in the developing world. 

But it’s still a mystery why, even though DC plans have been available for 35 years, ownership of stock (even indirectly) remains so concentrated. My hunch is that the existing defined contribution system, despite its standardized designs, regulations and contribution limits, reproduces (and may amplify) the economic disparities in the workforce it covers (or fails to cover). If that’s true, DC may not be the ideal path to broader retirement security. 

© 2017 RIJ Publishing LLC. All rights reserved.

Integrity Life enhances Indextra FIAs

Integrity Life has added the J.P. Morgan Strategic Balanced Index as an index option on its Indextra Series fixed indexed annuity (FIA), according to an announcement this week by W&S Financial Group, the distributor of insurance products for Western & Southern Financial Group, Integrity Life’s parent.

Sales of the Indextra series exceeded $1.5 billion as of November 30, 2017, according to the release. Launched Sept. 29, 2014, Indextra had strongest first-year sales in W&S Financial Group Distributors’ product history, the release said.

The new index option, which is available in one-, two- and three-year crediting period, is designed to maintain “a stable level of risk no matter the economic cycle,” according to a W&S release. According to W&S product  literature, the J.P. Morgan Strategic Balanced Index targets a 6% volatility by investing partly in high-dividend stocks through ownership of the Power Shares S&P 500 High Dividend Low Volatility exchange traded fund (ETF) and partly in the J.P. Morgan Total Return Index, which uses ETFs to get exposure to four classes of bonds.

With this arrangement, the amount of interest that a contract owner can earn over the crediting period has no cap (which places a ceiling on earned interest) or spread (which gives the issuer the initial earnings up to a certain point, and gives the investor the yield above that), but it does participation rate. A new participation rate is declared at the beginning of each new crediting period. The owner is guarantee at least 10% of the index returns.      

This type of FIA/index combination would appeal most to investors who like the assurance of three layers of risk protection. The diversification of the index into stocks and bonds provides one layer and J.P. Morgan’s risk-management techniques provide a second layer.

A third layer is provided by the insurance carrier, who guarantees against any loss of principal (if the client holds the product to end of its seven-year surrender period). Less risk-averse investors could get sufficient risk reduction by investing directly in a balanced index fund, which could cost as little as $19 per $10,000 per year (19 basis points) to own. 

The product also offers an optional living benefit rider for a fee of 95 basis points per year for clients under age 80. The minimum premium is $10,000.

© 2017 RIJ Publishing LLC. All rights reserved.
Over one-third of U.S. households own IRAs: ICI

A new study from the Investment Company Institute, “The Role of IRAs in US Households’ Saving for Retirement, 2017,” examines contribution, withdrawal, and retirement planning activities by the 27.8% (35.1 million) of U.S. households that own traditional IRAs.

Roth IRAs were the second most common type of IRA, held by 19.7% of US households. Employer-sponsored IRAs, including SEP IRAs, SAR-SEP IRAs, and SIMPLE IRAs, were held by 6.0% of US households.

Among traditional IRA-owning households, 77% held their traditional IRAs through full-service brokerages, financial planning firms, banks and savings institutions, or insurance companies. Thirty percent held them directly through mutual fund companies like Vanguard and Fidelity and discount brokers like E*Trade and Charles Schwab.

In mid-2017, 57% of traditional IRA-owning households, or about 20 million, said their accounts contained rollovers from employer-sponsored retirement plans. Regarding their most recent rollover, most said they transferred the entire plan account balance. The most common reasons for executing a rollover were to:

  • Avoid leaving assets at a former employer (63%)
  • Keep the savings tax-deferred (59%)
  • Consolidate assets at one institution (58%)
  • Get more investment options (49%)

Traditional IRA-owning households rarely take withdrawals before retirement and often wait until they reach age 70½, when annual withdrawals are required. Among the 9.1 million households that took withdrawals for tax year 2016, 71% used the required minimum distribution (RMD) rule to calculate them. About two-thirds (64%) asked a financial adviser to calculate their withdrawal. Eighty-one percent of households that made withdrawals were retired. 

 “The Role of IRAs in US Households’ Saving for Retirement, 2017” reports information from two separate ICI household surveys. ICI’s 2017 IRA Owners Survey was conducted in June 2017. It is based on a representative sample of 3,205 US households owning traditional IRAs or Roth IRAs.

 The 2017 ICI Annual Mutual Fund Shareholder Tracking Survey was conducted from May to July 2017. It is based on a sample of 5,000 randomly selected US households, of which 34.8% owned IRAs.

© 2017 RIJ Publishing LLC. All rights reserved.

Researchers weigh impact of various Social Security solvency cures

The Social Security Trust Fund is currently projected to deplete its surplus in 2034, and policymakers know a reckoning is coming. How they respond is the hard part. To restore solvency, Congress can either cut Social Security’s pension benefits or increase the payroll taxes deducted from workers’ pay.

Both policies would affect the amount that households can spend. A new study from the Center for Retirement Research at Boston College finds that benefit reductions would have a much larger annual impact on retirees than would the higher taxes on workers. But the taxes would be spread over a longer time period.

The new study looks at four specific policies, two that cut retirement benefits and two that raise taxes. All four would have an equally beneficial effect on Social Security’s finances.

To gauge the likely effects, researchers used a model for predicting workers’ behavior. Some workers might be inclined to retire earlier if more taxes are being taken out of their paychecks. But if they knew their future benefits would be trimmed, they might decide to work longer to increase the size of their monthly checks.

The options

One option for reducing Social Security payouts would be to delay the full retirement age (FRA) (the age at which retirees are eligible to collect “full” benefits). A two-year increase in the FRA, to 69, would reduce annual consumption in retirement by 5.6% for low-income, 4% for middle-income, and 2.2% for high-income retirees.

A second option would be to trim Social Security’s annual cost-of-living (COLA) increases. The impact of COLA reductions, small at first, would compound over time. For people who live to age 90, the COLA cut would mean sharply lower consumption—10.5% less for low-income, 8% for middle-income, and 4% less for high-income retirees.

To increase the revenues going into Social Security, Congress could either raise the payroll tax rate or the dollar ceiling on workers’ earnings that are taxed. The researchers looked at the impact of increasing the payroll tax to 7.75% from the current 6.2%.

This would reduce consumption during people’s working lives by 1.55 percentage points per year. Raising the earnings amount subject to the payroll tax—to $270,000 from $127,200 currently—would have a smaller impact, decreasing consumption by 1% on Americans with very high income.

© 2017 The Center for Retirement Research at Boston College.

Research Roundup

A new batch of retirement research papers arrives here every week. Some of the articles fall into our wheelhouse—retirement financing. Periodically we glean them for insights and then condense them for our audience of advisors, plan providers, academics, insurers, asset managers and marketers.

Our latest Research Roundup includes summaries of five recent research articles. Two of the articles, “The Sustainability of U.S. Household Finances” and “The Great Debt Boom: 1949-2013”, help explain why most Americans, including the affluent, aren’t well prepared for retirement.

A third article, “Living Below the Line: Economic Insecurity and Older Americans in the States, 2016,” helps define and quantify “basic” and “essential” expenses in retirement. The last two articles address the topics of “rainy day funds” (a part of financial wellness programs) and “Rothification,” a federal revenue-generating idea that most 401(k) industry lobbyists despise.

Sustainable consumption in retirement

The finances of almost half of American households are unsustainable, if sustainability means that a household can consume at its current rate through its remaining working and retirement years without running out of money, according to research by Steven M. Fazzari of Washington University and two Federal Reserve economists, Daniel H. Cooper and Barry Z. Cynamon.

Baby Boomers, as a group, appear to be at very high risk. In a presentation at the Tipping Points II Conference in New York last June, the authors showed that more than 90% of Baby Boomer-led households were financially sustainable in the early 1980s. But that percentage dropped steadily over the next 30 years, to 31% in 2012.

Their study showed a decline in consumption sustainability over the life cycle for even the higher-income households, except for the highest one percent. Indeed, between 1983 and 2013, those in the 91st to 99th income percentile saw the largest drop in percentage of sustainable households, to 47% from 81%.

The economists created a metric they called Consumption at Risk (CAR). It is the percent of current consumption that households would have to cut in order to live within their means—that is, if they were forced to consume at a sustainable rate. Among financially unsustainable houses, the CAR in 2012 was just over 30%.

The researchers expect that many Boomer householders will have to work in retirement if they want to consume at current rates. “For the sustainability share in 2012 to be the same as in 1988, households that planned to smooth their consumption through retirement in 1988 would need to plan to cut their retirement consumption in half by 2012,” they wrote in an October 2016 paper, “The Sustainability of U.S. Household Finances.”      

From Levittown to McMansions, a story of debt

Even the rich in America, on average, are borrowing and spending at a rate that they won’t be able to sustain for their entire lives, according to “The Great American Debt Boom 1949-2013,” a September 2017 paper by three German economists. Almost all of us are over-borrowed and, ipso facto, under-saved.

The personal debt load carried by Americans has grown more than six-fold since 1949, from 15% of GDP to 100% of GDP, write Moritz Kuhn, Moritz Schularick and Ulrike Steins of the University of Bonn. Generally, the upper-middle class has over-borrowed on real estate, the middle-class for tuition and the lower-middle class just to make ends meet.

The big story is in real estate. From 1949 to the 1970s, during what might be called the Levittown boom, broader home ownership drove the rise in household debt, as the parents of Boomers eschewed urban apartments for sheetrock homes on half-acre tracts in the suburbs.

Later, as interest rates fell and the stock market rose, lending practices loosened. The McMansion boom arrived. Members of the upper middle class were able to finance much larger homes and take on unprecedented debt. Except for the subprime lending phase, this was a period of “intensive” rather than “extensive” borrowing.   

People born between 1915 and 1924 tended to start deleveraging at about age 45, but younger people have not “reduced their indebtedness as they grew older,” the authors write. For Boomers born between 1945 and 1964, “mean debt-to-income ratios even increased with age.” That may be the essence of our looming “retirement crisis.”

‘Basic’ expenses in retirement? About $40,000

When estimating your retirement cost-of-living, can you draw a line between “essential” and “discretionary” expenses? Advisors often ask that question and most people have difficult answering it.

At the Gerontology Institute at UMass Boston, economists have created a benchmark called the Elder Economic Security Index Standard, which they claim represents the amount of monthly and annual cost of basic expenses in retirement for singles and couples over age 65.

They put the basic required income for a single person over age 65 at $20,000 to $31,000 a year ($1,700 to $2,600 a month) and for a couple at $31,000 to $41,000 a year ($2,500 to $3,500 a month). Homeowners with mortgages have the highest expenses, followed by renters and homeowners without mortgages. Spending on entertainment, travel, restaurant meals, or the cost of anything else beyond essential needs is not included.   

These figures are published in “Living Below the Line: Economic Insecurity and Older Americans in the States, 2016,” by Jan Mutchler, Yang Li, and Ping Xu of the Center for Social and Demographic Research on Aging, Gerontological Institute, McCormack Graduate School of Policy and Global Studies, University of Massachusetts-Boston.

One interesting artifact of the study: Very few retired couples are truly poor, by federal poverty standards. They’re roughly half as likely as single people to be economically insecure. Very few retired couples—no more than 6.2% (in Mississippi) and only 2.6% in Vermont—have incomes below the official U.S. poverty line. 

The forecast for “rainy day” accounts

Proposals for “financial wellness” programs within 401(k) plans sometimes include an emergency fund or “rainy day” fund. If participants had a source of ready cash, the theory goes, they wouldn’t need to take hardship withdrawals or to borrow from their accounts. It would be easier for them to keep their savings “on track.”

The details, however, can be devilish. The obstacles and uncertainties that face plan sponsors or plan providers who contemplate adding a rainy day fund are explored in an October 2017 research paper aptly called, “Building Emergency Savings Through Employer-Sponsored Rainy Day Accounts.”

The paper was produced by A-list retirement researchers: John Beshears, David Laibson and Brigitte Madrian of Harvard, James Choi of Yale, and the duo of Mark Iwry and David John, who co-created the “auto-IRA” model on which state-sponsored workplace IRA plans in California and Oregon are based.

The researchers considered three potential designs for a rainy day fund: an after-tax employee contribution account within a 401(k) plan; a Roth IRA inside a 401(k) plan (aka a “deemed” Roth IRA); and an account that would live at a bank or credit union and would, if regulations allow, feed excess emergency savings back into a 401(k) plan.

Clearly, many uncertainties still exist. The paper focuses on the many questions that would face the sponsor of such a program–about how to invest the contributions, how large the fund should be, how to make sure the accounts are enhancing long-term retirement savings instead of cannibalizing them, and so forth.

The data points to a huge need for rainy day funds. “Forty-six percent of U.S. adults report that they either could not come up with $400 to cover an emergency expense” without borrowing or selling something, the authors write. “Among households whose head is age 61-70, median liquid net worth is $6,213, while the 25th percentile is $1.”

The case against ‘Rothification’  

The Center for Retirement Research (CRR) at Boston College opposes “Rothification” of 401(k) plans. Its economists consider the idea, only recently shelved by Congress, to be a revenue-generating “gimmick” rather than a good-faith attempt to improve the retirement system. 

“Many better options exist if Congress wants to focus on improving the retirement system,” write CRR director Alicia Munnell and staff economist Gal Wettstein in a brief entitled, “Dodged a Bullet? ‘Rothification’ Likely to Reduce Retirement Saving.”  

A switch to Roth 401(k)s would reverse the current system, in which contributions are tax-deductible and withdrawals in retirement are taxed as ordinary income. Eliminating the tax deduction for contributions to 401(k) plans, Munnell and Wettstein claim, might have unpleasant unintended consequences, like eliminating an important incentive to save.

For the present, Congress has dropped its original Rothification proposal, which would have cannibalized the 401(k) system for near-term tax revenue in order to pay for the large corporate tax cuts. But that’s not very comforting, since it means that they don’t intend to update the flawed 401(k) system, which covers only about half the U.S. workforce at any given time and has no provision for income-generation in retirement.

Munnell and Wettstein recommend making auto-enrollment and auto-escalation of the default contribution rate mandatory. “Changes are also required on the draw-down side so that retirees do not either spend their money too quickly and outlive their savings or spend it too slowly and deprive themselves of necessities,” they write. “And expansion of coverage is needed for the half of private sector workers who have no employer-sponsored retirement plan at work.”

© 2017 RIJ Publishing LLC. All rights reserved.

Department of Labor Declares 18-Month ‘Transition Period’ for BICE

The DOL finalized its proposed 18-month extension—from January 1, 2018 to July 1, 2019—of the Transition Period for the Best Interest Contract Exemption (“BICE”), Principal Transactions Exemption and PTE 84-24 (collectively, the “Fiduciary Compensation Exemptions” or “Exemptions”). The formal notice of DOL action was published in the Federal Register on November 29, 2017.

The DOL action leaves in place the Fiduciary Rule (which became effective as of June 9, 2017), including the revised definitions of fiduciary and “investment advice” that applies to ERISA plans and IRAs (and similar accounts). The DOL’s action continues the current status for the Exemptions. Financial services firms and others can rely on the BICE and the Principal Transactions Exemption as long as they satisfy the Impartial Conduct Standards.

PTE 84-24 will continue to be available for both fixed and variable annuities as long as the Impartial Conduct Standards are satisfied (along with the conditions in effect before the Fiduciary Rule was proposed). In short, financial advisors, broker-dealers and other financial institutions that are already in compliance with the Impartial Conduct Standards with respect to their ERISA and IRA clients do not need to take additional steps in order to comply with the Exemptions (until the DOL announces new changes). The DOL indicated that it will both complete its review and propose alternative or amended exemptions before July 1, 2019. 

DOL agrees with comments supporting fixed 18-Month extension

In announcing the extension, the DOL stated that a delay was necessary to allow the DOL to complete its examination of the Fiduciary Rule and the Exemptions, to propose changes to the Exemptions and/or propose alternate exemptions, and to coordinate with the SEC and other regulators such as FINRA and the National Association of Insurance Commissions (“NAIC”).

Notably, the DOL stated that it anticipates that it will propose in the near future a new streamlined class exemption. The DOL received numerous comments both for and against an extended Transition Period. Although many commenters expressed concern that extending the Transition Period would result in economic harm to investors and would not prompt financial services firms to comply with the Impartial Conduct Standards, the DOL stated that it “believes that many financial institutions are using the compliance infrastructure to ensure that they are currently meeting the requirements of the impartial conduct standards” and that there are adequate enforcement mechanisms in place to protect investors during an extended transition.

The DOL also agreed that a delay was necessary to give the financial services industry certainty regarding its compliance obligations and to avoid confusion or unnecessary restrictions on retirement investors that might occur if the original January 1, 2018 date was unchanged.

Current enforcement position extended

The DOL also extended the enforcement position articulated in FAB 2017-02 to July 1, 2019. FAB 2017-02 provided that the DOL would not pursue claims against investment advice fiduciaries who were working diligently and in good faith to comply with their fiduciary duties and meet the conditions of the Exemptions. The DOL stated that it was in the interest of plans, plan fiduciaries, plan participants and beneficiaries, IRAs and IRA owners to continue this approach.

The DOL emphasized, however, that diligent and good faith efforts were in fact required and that “the basic norms and standards of fair dealing” still applied during the Transition Period. The DOL further stated that as it reviews compliance efforts during the Transition Period, it will focus on the “affirmative steps” that firms have taken to comply with the Impartial Conduct Standards and reduce the scope and severity of conflicts that could lead to violations.

The DOL noted that although there is some flexibility in how to safeguard compliance with the Impartial Conduct Standards, financial services firms may look to the specific provisions of the Exemptions for compliance guidance. The DOL specifically noted that limitations on an advisor’s investment recommendations to proprietary products or investments that generate third-party payments could be structured to comply with the Impartial Conduct Standards under the BICE.

Based on this statement, it appears that reliance on other compliance principles articulated or implicit in the Exemptions can be used to demonstrate compliance with the Impartial Conduct Standards during the Transition Period ending on July 1, 2019.

Compliance during the extended transition period

Although the extended Transition Period will help financial services firms by allowing the DOL to conclude its review of the Fiduciary Rule and the Exemptions without imposing new or interim compliance obligations, the DOL release does not provide clear compliance obligations in the short term.

To the extent that financial institutions and financial advisors have already implemented policies and procedures designed to demonstrate compliance with the Impartial Conduct Standards, those policies and procedures should remain in effect. To the extent that such policies and procedures have not been adopted, financial institutions should seriously consider doing so.

Even though the DOL has stated that its enforcement posture will continue to be focused on compliance assistance, private litigants will not be and, depending on the facts, the DOL may conclude that certain compensation systems or other fact patterns are simply inconsistent with the Impartial Conduct Standards.

With respect to any additional compliance steps, the DOL has clearly signaled that firms may look to certain principles and provisions of the BICE or the other Exemptions for guidance. In a prior Alert, which can be read here, we provided a non-exhaustive list of steps that can be taken, though no single step is required by law or regulation. Note that the DOL has stated that it is broadly available to discuss compliance approaches that have been adopted or may be adopted.

© 2017 The Wagner Law Group. 

AIG launches New York’s first fixed annuity with GLWB

New Yorkers can now buy a fixed deferred annuity with a living benefit rider, but the rider will differ in an important way from versions of the product that are sold in most other states.   

American International Group, Inc. (AIG) announced this week that one of its subsidiaries, The United States Life Insurance Company in the City of New York, has issued what it described as “the first fixed annuity with a guaranteed lifetime income benefit in New York State.

The product, “Assured Edge Income Builder-NY,” was issued in other states in 2016, AIG said in a release. New York Life’s Clear Income fixed deferred annuity with a guaranteed lifetime withdrawal benefit (GLWB) is not offered in New York State, California, Delaware or Guam.

American General Life, also a unit of AIG, sells a version of the Assured Edge product. That version also has a GLWB priced at 0.95% per year. But where the non-New York product offers a 7.5% increase in the benefit base for every year withdrawals are delayed, the New York version offers a quarter of a percentage point (0.25%) increase in the withdrawal percentage.    

“We modified the design to comply with the NY requirements, which meant that we needed to have the guaranteed income amount be tied to the account value upon first lifetime withdrawal rather than tied to the annuity premium,” an AIG spokesperson told RIJ. 

“We therefore constructed the income levels and the annual income increases (0.25% as mentioned) to be as equivalent as possible with our non-NY feature, subject to also accounting for other differences in the NY product.”

All deferred annuities offer owners the right to convert the contract value to a lifetime income stream–a largely irrevocable process known as annuitization. When a GLWB rider is attached to a deferred annuity, the owners have a combination of liquidity and guaranteed income that will last until he/she/they die. GLWBs can be found on variable, indexed and fixed annuities.

The guaranteed lifetime withdrawal benefit is automatically included in the contract issue with no annual rider fee. Assured Edge Income Builder-NY is available only in New York. A suite of annuity products is available in all other states issued by American General Life Insurance Company (AGL).

© 2017 RIJ Publishing LLC. All rights reserved.

Vanguard and BlackRock/iShares dominate October fund flows

In October, investors put $27.6 billion into U.S. equity passive funds, more than doubling September’s $12.7 billion inflow. On the active front, investors pulled $18.8 billion out of U.S. equity funds compared with $18.5 billion in the previous month, according to Morningstar’s latest monthly asset flow report.

Highlights from the report include:

On the passive front, Vanguard was the top fund family, with inflows of $26.6 billion in October ($340.1 billion for one year), followed by BlackRock/iShares with inflows of $20.4 billion in October ($224.9 billion for one year). Gold-rated Vanguard 500 Index Fund attracted the highest flows of $9.0 billion and iShares Core S&P 500 ETF followed with $3.9 billion in flows.

The leaders in active flows among top U.S. fund families were J.P. Morgan with $4.6 billion and PIMCO with $3.5 billion. The active fund with the highest inflow was JPMorgan International Research Enhanced Equity Fund, with flows of $3.1 billion. Fidelity and Franklin Templeton suffered outflows from their active funds as they did in September; however, T. Rowe Price received inflows of $312.0 million.

Taxable bond remained the leading category group in October with $39.1 billion in flows overall, divided almost evenly between the passive and active side. International equity, which more than doubled to $22.2 billion in October from $9.8 billion in September, was the second leading category group.

Intermediate-term bond, foreign large blend, and large blend were the three Morningstar Categories with the highest inflows in October. The three Categories with the largest outflows were large value, large growth, and mid-cap value.

After announcing a fee increase in September, PIMCO Income, an actively managed bond fund with a Morningstar Analyst Rating of Silver, saw flows of $3.0 billion in October. On the passive front, Bronze-rated T. Rowe Price New Income suffered a $1.2 billion outflow in October, the largest outflow among active funds.

The passive fund with the largest outflow was Vanguard Institutional Index at $4.8 billion. iShares MSCI Spain Capped ETF experienced $571 million in outflows, following Catalonia’s declaration of independence from Spain.

Morningstar estimates net flow for mutual funds by computing the change in assets not explained by the performance of the fund and net flow for ETFs by computing the change in shares outstanding.

© 2017 Morningstar, Inc.

A Bitter Sandwich on Thanksgiving

Relatives of mine are experiencing a Dagwood-sized sandwich-generation moment that involves a large and unplanned expense for nursing or assisted-living care. We visited them over the Thanksgiving holiday in their comfortable, oak-forested suburban neighborhood. They weren’t feeling comfortable.

Until last September, their mother, a widow now past 80, was living independently in her Florida condo. Then she fell and struck her head. After surgery for sub-cranial bleeding, she needed physical therapy. She has lost weight, and now uses an aluminum walker with small black caster wheels. 

For her and many other older people, an injury from a fall often marks, at best, the beginning of dependency. For their adult children, it often marks the beginning of a period of logistical confusion, emotional turmoil and financial pressure.

I’ve seen many retirement income plans on computer screens. None of the colorful cash flow projections or illustrations has ever shown the sudden appearance of a $5,000 or $10,000 per month assisted living or nursing expense or any indication of how long that expense might last. Some of us know from experience that it could last for many years.

The $250,000 that this widow gained from the sale of her family home has long been spent. She and her late husband opted long ago for a single-life pension from his life-long public sector job, and they took Social Security early. Plans to buy long-term care insurance were drawn up 20 years ago but shelved. The proceeds from the sale of her West Palm Beach condo will cover no more than six months in a nursing home.

Her family can handle the five-figure cost of care for a while, but not for a decade. Her two sons are now weighing their options. Where they live, no services are cheap. Good assisted living arrangements cost $7,000 a month. Nursing home care costs $12,000 a month. They don’t plan to convert my friend’s basement to an age-in-place apartment with around-the-clock nursing care.

Just before Thanksgiving dinner, their mother arrived with her walker. A once-energetic woman, she moves hesitantly now. She had just enough strength to visit with her children and grandchildren for a few hours before returning to a rehab center, where Medicare coverage stops after 100 days.  

My relatives like to turn lemons into lemonade (or, better yet, a Tom Collins). So they’re taking this still-fluid situation as a wake-up call. They recognize that in 20 years or so, when they themselves turn thin and frail, their own children might face a similar predicament. The sandwich-generation dilemma is a bitter one, but it can remind us to prepare for what lies ahead.       

© 2017 RIJ Publishing LLC. All rights reserved.

Amid ‘Trump Bump,’ annuities go begging

Sustained low interest rates, a relentless bull market in equities and uncertainty over the regulation of annuity sales to IRA owners have all conspired to frustrate the annuity industry at the very moment in history when Baby Boomers should arguably be buying annuities for safe lifetime income. Go figure.

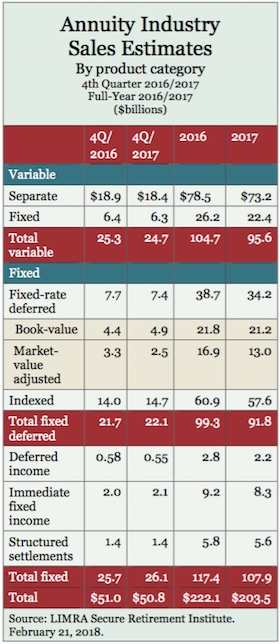
At $46.8 billion in the third quarter of 2017, total U.S. annuity sales were below the $50 billion mark for the first quarter since 2002, according to the LIMRA Secure Retirement Institute’s (SRI) quarterly retail annuity sales survey.

In the first nine months of 2017, overall annuity sales were $152.7 billion, 11% lower than in 2016. For seven straight quarters, fixed sales have outperformed variable annuity (VA) sales. That last happened nearly 25 years ago. The Institute predicts overall 2017 annuity sales to be around $200 billion.

Sales were down 13% from the same period in 2016, and fell for the sixth consecutive quarter. LIMRA expects VA sales to drop 10-15% in 2017, to below $100 billion. VA sales haven’t been below $100 billion since 1998. 

LIMRA SRI’s Annuity Research director, Todd Giesing, blamed the decline on the Department of Labor’s fiduciary rule, whose fate has been delayed until at least July 2019. “We are confident the initial implementation of the DOL’s fiduciary rule on June 9th had a negative effect on sales, particularly on IRA contracts,” he said in a release. “We expect the environment to improve in 2018.” 

For the first three-quarters of 2017, Jackson National was the top seller of VAs ($12.9 billion), New York Life was the top seller of fixed annuities ($8.5 billion) and AIG had the highest level of sales ($10.6 billion) among issuers with a balanced VA-FA offering. Allianz Life sold the most indexed annuities ($5.82 billion).

LIMRA 3rd Qtr 2017 annuity sales estimates

Variable annuities

Indeed, qualified VA sales dropped 24% in the third quarter, versus a 3% dip in non-qualified sales. Overall, third quarter variable annuity (VA) sales were $21.8 billion, down 16% from prior year. This is the 15th consecutive quarter of declines and the lowest level of quarterly VA sales in 20 years. Year-to-date, VA sales were $70.9 billion, 11% lower than in the first nine months of 2016. 

The momentum of structured (or “indexed”) variable annuities, which represent 8% of the total VA market, also flagged in the third quarter of 2017. Sales of these accumulation-focused products were $1.7 billion, up 15% from the third quarter 2016 but down 5% from the prior quarter.  

Fee-based VA product sales were $560 million in the third quarter, more than 50% higher than third quarter 2016, but a slight decline from the previous quarter.  Fee-based VA sales represent 2.5% of the total VA market.

Fixed annuities

Fixed annuity sales were not immune to the impact of the initial implementation of the DOL fiduciary rule. Third quarter sales were $25 billion, down 11% from 2016.  Year-to-date, fixed sales also fell 11% to $81.8 billion. 

Fixed indexed annuity (FIA) sales were $13.7 billion in the third quarter, 9% lower than in the third quarter 2016. In the first nine months of 2017, FIA sales were $42.9 billion, down 9% from prior year.

“A continued shift to accumulation focused-indexed products continues in the industry,” Giesing noted. “Sales of indexed annuities with a guaranteed living benefit (GLB) dropped significantly (27%) in the third quarter, compared with last year’s results; while sales without a GLB increased by 14%.”

The Institute is forecasting FIA sales to decline close to 10% in 2017, compared with 2016 sales results. In the third quarter, sales of fee-based indexed annuity products were $48 million, representing less than half of one percent of the indexed market.

“With nearly 60% of the FIA market sold through independent agents [who sell on commission], it is unlikely fee-based FIAs will experience significant growth unless regulations compel them,” the LIMRA release said.

Sales of fixed-rate deferred annuities (Book Value and MVA) fell 13% in the third quarter, to $7.4 billion. Year-to-date, fixed-rate deferred sales totaled $26.8 billion, down 14% from prior year.

Despite steady interest rates, SPIA sales fell 9% in the third quarter to $2 billion.  For the past several quarters, SPIA sales have stayed in the $2-$2.2 billion range. Year-to-date, SPIA sales fell by 14%, totaling $6.2 billion. Deferred income annuity (DIA) sales dropped 14% to $520 million in the third quarter. In the first three quarters of 2017, DIA sales totaled $1.67 billion, down 25% from prior year.

© 2017 RIJ Publishing LLC. All rights reserved.

DB-DC hybrid idea resurfaces in UK; launches in Germany on January 1

“Defined ambition,” a phrase used to describe “collective” defined contribution plans, was championed by Britain’s pension chief from 2012 to 2014. The concept is now making a tentative comeback in UK retirement policymaking circles.   

A bipartisan group of British politicians has opened a new inquiry into the “merits or otherwise” of defined ambition, which describes pension plans that are a hybrid of defined benefit plans and defined contribution plans (or “schemes” as Britons say).

For participants, these plans would provide less certainty in terms of retirement incomes than DB plans but more certainty than US-style DC plans. They would reduce the risks that employers face.

In essence, plan participants would agree to accept retirement incomes that fluctuate with market performance instead of expecting fixed payouts. Life insurance companies don’t play a role in defined ambition or CDC plans. Labor unions would need to play a role in representing participants. 

CDC schemes may be “the type of retirement saving plan with the potential to address some of the concerns that policymakers and the public have about the current pension ‘offer,’” said the Work and Pensions Committee (WPC) of the House of Commons, in an official statement this week.

The committee has asked for responses to its questions by January 8, 2018. It has posed questions about benefits to savers and the wider economy, converting defined benefit schemes to CDC, and how CDCs would be regulated. 

The politicians’ questions include:

  • Would CDC deliver tangible benefits to savers compared with other models?
  • How would a continental-style collective approach work alongside individual freedom and choice?
  • Could seriously underfunded DB pension schemes be resolved by changing their pension contract to CDC, along Dutch lines?
  • Is there appetite among employers and the UK pension industry to deliver CDC?
  • Would CDC funds have a clearer view towards investing for the long term?

“The select committee is aiming… to retain some of the best features of company schemes in a different age when employers are no longer willing or able to sustain the burden of final salary promises to employees, who could instead club together and pool the risk themselves,” said Frank Field, Labor Party member and chair of the WPC. The WPC is also inquiring into pension freedoms.

CDC is a potential source of longer- term investment in growing start-up companies, the lawmakers said. Unlocking such investment was one of the policy goals mentioned by Chancellor of the Exchequer Philip Hammond in his Budget statement this week.

Arguments made against CDC schemes, according to the committee, were that they could further fragment the pension landscape, suffer from lack of demand, or run counter to the trend towards greater individual freedom and choice in pensions.

Though common in the Netherlands and Denmark, CDC pension schemes are not allowed in the UK. But they will become possible in Germany in 2018, under certain conditions. In Germany, according to a recent Aon Hewitt report:

“Social partners [unions and employer associations] are urged to agree on an attractive and well balanced “Defined Contribution” approach. Employers who join such plans are released from any pension liability, which is transferred to the overarching pension fund. The pension fund, which is supervised and managed by the social partners, becomes responsible for the investment of pension assets and payment of pensions. The benefits are based on a “defined ambition approach” which allows for variations in the benefit levels depending on how well investment goals are achieved. Guarantees backed by insurance-type arrangements are not allowed. Further details, such as risk sharing and smoothing mechanisms between the plan participants, need to be agreed on by the social partners.”

In 2014 the UK government intended to alter pension law to make CDC plans legal, as part of a plan by then-pensions minister Sir Steve Webb for greater risk-sharing in pensions. They were even recognized as a distinct pension category in legislation created by the Conservative-Liberal Democrat coalition government. But efforts were shelved after the Tory victory in the 2015 general election.

At that time, the British government did not want to distract from other major reforms such as auto-enrolment and pension freedoms, according to Baroness Ros Altmann, Webb’s Conservative Party successor. Retirement industry representatives also opposed the CDC concept.   

© 2017 RIJ Publishing LLC. All rights reserved.

The Word of the Week Is: Thanks

We at Retirement Income Journal offer our thanks this holiday season to everyone who has contributed to our success over the past eight-plus years. Back in 2009, we saw that a new segment of the financial industry had formed in response to the Baby Boomer age wave, that this industry included annuities, investments, advice, distribution, and national borders, etc., and that it needed its own publication.

We built that publication, and the industry responded. Our newsletter audience includes executives and managers at life insurance, asset management firms and brokerages, financial advisors, insurance agents, consulting actuaries, academic economists, attorneys, and IT service providers. We have corporate, group and individual subscribers. Several of our readers and contributors are prominent authors in the field of retirement income and finance. At least one of our readers has won the Nobel Prize in economics. Thanks to all of you for your support.

We especially thank our long-standing and new corporate subscribers and advertisers, who include: Allianz Life, AXA, Cannex, CapGroup, Charles Schwab, DCF Exchange, Ernst & Young, Eversheds Sutherland, Fidelity Investments,    Great-West Life, Jackson National, John Hancock , LIMRA, MassMutual, MetLife, Milliman, Morningstar, Nationwide, New York Life, Prudential, The Principal, Protective Life, the Securities & Exchange Commission, Thrivent, TIAA, T. Rowe Price and Voya. 

In the past year, we successfully registered our brand name, Retirement Income Journal, with the U.S. Patent and Trademark Office. We have been working on a new website: in early 2018, expect to elevate an all-new WordPress website and a new payment system that will replace the Ruby-on-Rails and PayPal-based system that we’ve used since April 2009. We thought about splitting RIJ into two websites, one for manufacturers and one for distributors. But we decided to maintain a single website and dedicate a column of stories, clearly marked on the home page, to each of our major constituencies.

The retirement industry is constantly changing and RIJ will follow the changes as they emerge. We cover an eclectic range of topics within the retirement space, but our core mission has never changed. We believe that a combination of risk-free and risky products, working in tandem within a comprehensive individualized plan, offers retirees the best protection against the financial challenges they’ll face. Annuities may not be right for every retiree, but very few retirees, we believe, can afford not to become familiar with them.   

© 2017 RIJ Publishing LLC. All rights reserved.

Fixed annuity sales dipped sharply in 3Q2017

Annuities are experiencing a big chill, thanks to the Trump bull market, rising interest rates (which boosts competing sales of certificates of deposit), and possibly because of continuing uncertainty over the DOL fiduciary rule, whose provisions for indexed and variable annuity sales remain in limbo. 

The focus here and now is on fixed annuities. Sales of non-variable deferred annuity sales were over $20.2 billion in the third quarter of 2017, which was down 14.0% from the prior quarter, and 11.1% lower than in same period a year prior, according to the 81st quarterly edition of Wink’s Sales & Market Report.

The report is based on sales data from 57 fixed indexed annuity (FIA) providers, 53 traditional fixed annuity providers and 57 multi-year rate guaranteed annuity (MYGA) issuers.

Allianz Life led in non-variable deferred annuity sales, with a market share of 9.4% across all channels. The Minneapolis-based firm held an industry-leading 14.9% share of the FIA market. Its Allianz 222 Annuity, an FIA, was the top-selling non-variable deferred contract. It was also the top-selling FIA for the thirteen consecutive quarter.

WinkTable1 11232017

Other top non-variable fixed annuity sellers included New York Life, Global Atlantic Financial Group, Athene USA, and AIG, in that order. Within the FIA market alone, Nationwide, Athene USA, American Equity Companies, and Great American Insurance Group, in that order, trailed Allianz Life.

FIA sales for the third quarter were over $12.7 billion. That was down 12.6% from the previous quarter, and down 10.5% from the same period last year. Rising interest rates and rising equity prices were cause, according to Wink president and CEO Sheryl J. Moore.

“Rates have increased substantially on certificates of deposits from last quarter, and the [stock] market is on the rise,” said Moore, who is also president of Moore Market Intelligence. “There is typically an inverse relationship between CD rates and sales of fixed and indexed annuities.

“Likewise, whenever the market is on the rise, that hurts sales of these products. Despite the unfavorable market conditions for annuity sales, I still anticipate that fourth quarter will be strong,” she added. “The fourth quarter is always robust [for annuities].”

Traditional and MYGA annuities

Total sales of traditional fixed annuities, which offer a one-year guaranteed rate, were over $809.5 million in the third quarter. That was 20.7% lower than the previous quarter and 35.9% lower than the same period last year.  

Jackson National Life issued the most fixed annuities in the third quarter and held a market share of 16.5%. Modern Woodmen of America ranked second and was followed by Global Atlantic Financial Group, Reliance Standard, and Great American Insurance Group. Forethought Life’s ForeCare Fixed Annuity was the top-selling fixed annuity for the quarter, for all distribution channels combined.

Wink Table2 11232017

Sales of MYGAs, which offer a guaranteed rate for more than one year, were over $6.6 billion in the third quarter; 15.7% lower than the previous quarter and 7.9% lower than the same period last year. The top issuer was New York Life, with a market share of 25.1%, followed by Global Atlantic Financial Group, AIG, Security Benefit Life, and Delaware Life. Forethought’s SecureFore 5 Fixed Annuity was the top-selling MYGA for the quarter for all channels combined.

WinkTable3 11232017

Wink will begin reporting on sales indexed variable annuities beginning in the first quarter of 2018, the release said, and plans to report sales of immediate and variable annuities in the near future. Issuers of indexed variable annuities, a registered product, include Allianz Life, AXA, CUNA Mutual, MetLife and Voya.

© 2017 RIJ Publishing LLC. All rights reserved.