Archives: Articles

IssueM Articles

Fed Keeps Credit Throttle Wide Open

This week’s FOMC meeting was fairly substantial.

The FOMC doubled down on its near-zero rate policy despite the economic gains of recent months. This was entirely consistent with recently announced changes to the Fed’s policy strategy. In a surprise move, it enhanced its forward guidance such that the guidance is now consistent with the updated strategy. The Fed continues to lean into the downside risks for the forecast, another reason not to doubt its commitment to zero-rates in the foreseeable future.

The primary implication is that the Fed is committing to an extended period of very low and negative real policy rates even as economic activity accelerates. What are the risks here? The first risk is that the Fed retains a lot of leeway to adjust financial conditions via the asset purchase program. There are no commitments to the pace of asset purchases. The second risk is that the Fed has completely left itself open to being blindsided by a better than expected recovery.

The easiest place to start is with the economic projections:

These are substantial improvements in the outlook. The recession is less severe than anticipated and unemployment declines while inflation rises much more quickly. The median rate expectation however remains near zero for another year and now only one FOMC participant expects a rate hike before 2023. These outcomes are entirely consistent with the new strategy as I explained here in Bloomberg and earlier this week in this blog. This is how the new strategy is operationalized.

Despite these improvements, all the Fed sees are downside risks:

“The path of the economy will depend significantly on the course of the virus. The ongoing public health crisis will continue to weigh on economic activity, employment, and inflation in the near term, and poses considerable risks to the economic outlook over the medium term.”

At best, this analysis is starting to sound unoriginal. The Fed remains very, very clearly focused on the last battle. It assumes a long and slow recovery like in the wake of the Great Recession and a complete lack of inflationary pressures. I don’t think we can make these assumptions any more. This isn’t 2007-2009.

We don’t know what it is, but we do know that it isn’t 2007-2009. There was nothing wrong with the economy in January. There are no sizable misallocations of investment to overcome. The Fed didn’t let the financial sector crumble. There has been a massive improvement in household finances attributable to fiscal stimulus. And the economy is quickly growing around the virus.

I was fairly pessimistic early this year but the facts on the ground are shifting and I think you have to shift with those facts. The Fed however is focused on downside risks and locked into the zero-rate policy path for at least the near term. I think you can describe the near-term path as credibly irresponsible, which is exactly where you want the Fed to be if you want them to let the economy rip.

My preference is to let the economy rip, so I am not going to criticize the Fed. From a macro perspective, it’s a stance that should be positive for risk assets and negative for longer-term bonds (the risk on a negative outlook for bonds though is that rising rates push the Fed into more asset purchases on the long end).

The Fed further reinforced the projections with the statement:

“The Committee seeks to achieve maximum employment and inflation at the rate of 2% over the longer run. With inflation running persistently below this longer-run goal, the Committee will aim to achieve inflation moderately above 2% for some time so that inflation averages 2% over time and longer-term inflation expectations remain well anchored at 2%.

“The Committee expects to maintain an accommodative stance of monetary policy until these outcomes are achieved. The Committee decided to keep the target range for the federal funds rate at 0 to 0.25% and expects it will be appropriate to maintain this target range until labor market conditions have reached levels consistent with the Committee’s assessments of maximum employment and inflation has risen to 2% and is on track to moderately exceed 2% for some time.”

The first part of the reiterates the results of the strategy review. The reference to an inflation average is completely disingenuous because they can’t define a time-frame around average, but we all know that at this point. It’s just a game we are playing with the Fed, kind of like flirting. The last part, the commitment to holding rates at near zero until the economy is both at maximum employment AND inflation is at 2% is the unexpected enhanced forward guidance. It is really nothing more than making explicit what the Fed had already made implicitly. This though confirms Fed is locked into its current policy stance until inflation hits 2%.

This is all bullish. Run with it, don’t fight the Fed. But watch for things to go sideways. So how can they go sideways? The most obvious place is that while the Fed has committed to a rate policy path, it has not done the same for asset purchases. The Fed can very easily wind down asset purchases and claim to be maintaining accommodative financial conditions. It’s not exactly unprecedented.

Moreover, it is now all too easy to see a rapid pivot on asset purchases given that the Fed has so completely embraced the “this is 2010-2018 all over again” scenario. If unemployment and inflation continue to surprise on the upside, the Fed could be caught off guard and want to quickly pull back on quantitative easing. And what if there is a vaccine and in nine months we all book our Hawaiian vacations? (Yeah, I’m projecting.) That scenario has got to be on your radar as much as the downside scenarios.

Bottom Line: The Fed is committed to zero rates for the foreseeable future. It is not committed in the same way to the pace of asset purchases. The Fed though is not inclined to shift its current stance very easily. The bar is high for a rate hike. I suspect it is not nearly so high for the Fed to pull back on asset purchases. In the near term, that isn’t going to happen because the Fed is wedded to the bearish risks for the economy. If the forecast changes, the Fed will change with it. But it may be slow to change, and then change abruptly.

© 2020 Tim Duy. Reprinted by permission.

Honorable Mention

Retirement Income Journal takes a break

RIJ staff will take a two week vacation, starting today. We will publish next on September 17, 2020. Happy Labor Day to all.

Explaining the stock market/real economy disconnect

Many market-watchers have wondered publicly and privately why equity prices have recovered over the past five months in defiance of the weakness in the U.S. economy, as reflected by persistently high unemployment rates and uncertainty about the future impact of COVID-19.

In a recent working paper from the National Bureau of Economic Research, two MIT economists propose an answer. They say, in short, that the discrepancy is exactly what you’d expect to see when a central bank responds correctly when economy stalls because of a sudden drop in demand.

The “wide disconnect between the main stock indices and the state of the real economy in the U.S. following the Fed’s powerful response to the Covid-19 shock” is a “vivid example” of optimal central bank policy to the emergence of a “negative output gap,” write Ricardo Caballero and Alp Simsek. (A negative output gap means spare capacity in the economy as a result of weak demand.)

“Overshooting” is how they describe the rise in stock prices prior to a recovery in output and demand. “To minimize the output gap,” they write, “the central bank optimally induces asset price overshooting.” It should do so, “even if there is no output gap in the present but the central bank anticipates a weak recovery dragged down by insufficient demand.”

In a separate paper, the authors explain how the initial “supply shock,” which occurred when exports from China to the U.S. slowed last spring, led to a drop in asset prices and aggregate demand, and how the central bank’s responses have helped drive up asset prices, which help drive up aggregate demand, which fosters a broad economic recovery. The authors rejected the idea that its actions favored banks over consumers.

Noting the huge rise in the NASDAQ-100 (which is heavy on Apple, Microsoft, Facebook, Alphabet and other tech stocks) since the Fed eased rates last March, the authors remark that firms “not adversely affected by the productivity shock see their shares’ value rise above its pre-recession level since they benefit from the central bank’s attempt to boost asset prices without suffering from the decline in potential output.”

MetLife Investment Management originates $6.2 billion in private placements

MetLife Investment Management (MIM), the institutional asset management business of MetLife, Inc., today announced it originated $6.2 billion in private placement debt for the first half of 2020, across nearly 100 transactions, including $1.7 billion of investments originated on behalf of institutional clients.

MIM’s private placement debt origination for the first half of 2020 comprised $4.5 billion in corporate private placement debt transactions and $1.7 billion in infrastructure private placement debt transactions. This origination activity, which added 29 new credits, helped increase the value of MIM’s total private placement debt portfolio to $91.2 billion as of June 30, 2020.

MIM’s corporate private placement activity was diversified across industry sectors, including general industrial, healthcare, professional services, retail and utilities. “MIM was selective in its infrastructure private placement opportunities and participated in transactions that provided strong structural protections and relative value across the following sectors: electric transmission, renewable power, social housing and infrastructure, and stadiums. Investments included nearly $550 million in six transactions across the renewable power and social housing and infrastructure sectors,” an MIM release said.

As of June 30, 2020, MIM had $629.1 billion in total assets under management.

Jackson National creates insurance portal for ‘iRIAs’

Under Jackson National Life’s new digital distribution service for independent Registered Investment Advisors (iRIAs) and their clients, Jackson’s insurance-licensed distribution associates can facilitate transactions, the company said in a release today.

The new online portal, designed specifically for iRIAs, comes more than a year after Jackson began making its products available through third-party iRIA distribution partners, including DPL Financial Partners, TD Ameritrade, RetireOne and Financial Insurance Group.

The new digital service complements Jackson’s existing distribution channels, including independent broker-dealers, banks, and full-service national brokerages (“wirehouses”). These traditional channels will continue to service hybrid RIAs who maintain an affiliation with a broker-dealer, while Jackson’s six dedicated RIA consultants will serve iRIAs.

“The digital experience on Jackson.com provides clients of iRIAs with access to a suite of fee-based annuity offerings with no commissions or withdrawal charges, including Jackson Private Wealth, an investment only variable annuity; Perspective Advisory II, a variable annuity with add-on benefits; and MarketProtector Advisory, a fixed index annuity,” a Jackson release said.

“Through the launch of the new online portal, “We are highlighting our commitment to a digital-first approach, including the submission of client information as well as paperless processes all serviced by a fully licensed concierge team,” said Dev Ganguly, senior vice president and chief information officer, Jackson.

Independent RIAs can learn more at Jackson.com/ria-and-wealth-managers.html or call 800-711-7397.

DPL platform adds Principal disability and term life products

DPL Financial Partners, host of an insurance sale platform for registered investment advisors (RIAs), is offering additional products from Principal Financial Group on the DPL platform.

“Coupled with last month’s announcement of a long-term care insurance alternative, the addition of disability and term life insurance means that virtually every major financial insurance category is now available to DPL’s 1,000 member RIA firms,” a DPL release said.

Both the disability and term life products became available on the DPL platform starting Aug. 25, 2020.

Dialog needed as kids return to nest: New York Life

The proportion of Americans whose adult children moved back home with them (or adults who said that they moved back home with their parents) is relatively small; however, the data identifies a disconnect in longer-term expectations, according to a new survey by New York Life.

Parents believe that they will need to support their children for a longer period than their children believe, the survey showed. For example, 38% of adult children believe they will only need financial support for six months or less, while only 27% of parents share that sentiment.

Of the parents whose children moved back home, nearly one in three (29%) expect their kids to stay with them for three or more years. Only 14% believe their children’s stay will last three or fewer months. In contrast, just 17% of adults living with their parents expect to stay there for three or more years, whereas 22% expect to stay three or fewer months.

“This suggests a greater need to normalize family discussions about finances,” a New York Life release said, suggesting an adviser’s intervention.

New York Life commissioned Morning Consult to conduct a series of recurring surveys among a national sample of 2,200 adults. This poll was conducted online between May 29-June 1, 2020.

© 2020 RIJ Publishing LLC. All rights reserved.

Annuity sales hurt by low interest rate policy: Wink Inc.

Athene USA surpassed long-standing indexed annuity sales leader Allianz Life in the second quarter of 2020, with an 11% market share, according to Wink Inc.’s quarterly annuity sales report.

“The former frontrunner has been dethroned after more than a decade in their top-ranking position,” said Sheryl J. Moore, President and CEO of both Moore Market Intelligence and Wink, Inc., adding, “MYGA [multi-year guaranteed rate annuities] sales increased double-digits, while indexed annuity sales declined similarly; this is a new trend.”

Total second quarter sales for all deferred annuities were $45.9 billion, down 12.8% from the previous quarter and down 21.2% from the same period last year. Sales of indexed annuities were down 22% from the previous quarter and down 35% from the previous year.

The second quarter was extremely soft for annuities sales overall. Sales were evidently hurt by the Federal Reserve’s pandemic-related low interest rate policy, which reduced crediting rates of most rate-sensitive annuities. The low-rate policy has lifted stock indices and bond prices.

“As everyone adjusts to COVID-friendly selling, and the 10-year Treasury rate remains minuscule, sales will be challenged,” Moore said in a release this week.

The only annuity categories with good sales news in the quarter were MYGAs and structured variable annuities. At $12.5 billion, MYGA sales were up almost 27% from the previous quarter but down slightly from the previous year. Structured variable annuity sales were down from the previous quarter but up 9.4% from the year-ago quarter.

Rising sales of MYGAs may have reflected a flight to safety by some investors. According to Morningstar’s recent fund flow reports, bond funds have been gaining at the expense of stock funds—despite rising equity prices, ironically.

In indexed annuity sales, Allianz Life moved into second place, followed by Fidelity & Guaranty Life, AIG, and Sammons Financial Companies. Allianz Life’s Allianz 222 Annuity was the top-selling indexed annuity, for all distribution channels combined, for the twentieth consecutive quarter.

Jackson National leads overall

Jackson National Life was the overall top seller of deferred annuities, with a market share of 7.5%. New York Life, Massachusetts Mutual Life Companies, Lincoln National Life, and Equitable Financial followed.

Jackson National’s Perspective II Flexible Premium Variable & Fixed Deferred Annuity was the top-selling deferred annuity product as well as the top selling deferred variable annuity product, for all distribution channels combined, for the sixth consecutive quarter.

Total sales of non-variable deferred annuities were $25.7 billion in the second quarter of 2020; down 4.8% when compared to the previous quarter and down 22.2% when compared to the same period last year. Non-variable deferred annuities include the indexed annuity, traditional fixed annuity, and MYGA product lines.

Sixty-three indexed annuity providers, 43 fixed annuity providers, 62 multi-year guaranteed annuity (MYGA) providers, 13 structured annuity providers, and 47 variable annuity providers participated in the 92nd edition of Wink’s Sales & Market Report for 2nd Quarter, 2020.

Massachusetts Mutual Life Companies was the top carrier overall for non-variable deferred annuity sales in the second quarter, with a market share of 10.3%. New York Life, Sammons Financial Companies, Athene USA, and Global Atlantic Financial Group followed.

Massachusetts Mutual Life’s Stable Voyage 3-Year, a multi-year guaranteed annuity, was the top-selling non-variable deferred annuity for all distribution channels combined.

Total second quarter variable deferred annuity sales were $20.1 billion; that was down 21.4% from the previous quarter and down 19.9% from the same period last year. Variable deferred annuities include the structured annuity and variable annuity product lines.

Jackson National Life was the top carrier overall for variable deferred annuity sales in 2Q2020, with a market share of 16.3%. Equitable Financial, Lincoln National Life, Brighthouse Financial, and Prudential followed.

Traditional fixed annuity sales in the second quarter were $425.7 million; that was down 38.4% from the previous quarter and down 51.2% from the same period last year. Traditional fixed annuities have a fixed rate that is guaranteed for one year only.

Modern Woodmen of America was the top-ranked carrier in sales of fixed annuities, with a market share of 16.0%. EquiTrust, Global Atlantic Financial Group, Jackson National Life, and Brighthouse Financial followed. EquiTrust ChoiceFour with Liquidity Rider was the top-selling fixed annuity, for all channels combined.

Multi-year guaranteed annuity (MYGA) sales in the second quarter were $12.5 billion; that up 25.6% when compared to the previous quarter, and down 0.3% when compared to the same period last year. MYGAs have a fixed rate that is guaranteed for more than one year.

Massachusetts Mutual Life Companies was the top seller of MYGAs, with a market share of 20.3%. New York Life, Sammons Financial Companies, Global Atlantic Financial Group, and Symetra Financial followed.

Massachusetts Mutual Life Stable Voyage 3-Year was the top-selling MYGA contract for the third consecutive quarter, for all channels combined.

Structured annuity sales in the second quarter were $4.5 billion; that was down 7.1% from the previous quarter but up 9.3% from the previous year. Structured annuities have a limited negative floor and limited excess interest that is determined by the performance of an external index or subaccounts.

Lincoln National Life ranked as the top-seller of structured annuities, with a market share of 23.4%. Lincoln National Life Level Advantage B Share was the top-selling structured annuity for the second consecutive quarter, for all channels combined.

Variable annuity sales in the second quarter were $15.6 billion, down 24.7% from the previous quarter and down 25.6% from the same period last year. Variable annuities have no floor; the potential for gains or losses is determined by the performance of the subaccounts. Subaccounts may be invested in an external index, stocks, bonds, commodities, or other investments.

Jackson National Life held on to its top ranking in sales of variable annuities, with a market share of 21.1%. Equitable Financial, Lincoln National Life, Prudential, and New York Life followed.

Wink reports on sales of indexed, fixed, multi-year guaranteed, structured, and variable annuities as well as on sales of life insurance. Reporting on sales of additional product lines will follow in the future.

© 2020 RIJ Publishing LLC. All rights reserved.
The Sacrificial Payroll Tax

President Trump recently flummoxed the liberal henhouse by mentioning the possibility of stimulating the economy by legislating a payroll tax holiday—which at an annual rate would eliminate about a trillion dollars a year in revenue from Social Security and hasten its insolvency—at least technically.

On August 19, four Democratic Senators (Bernie Sanders, VT; Chuck Schumer, NY; Chris Van Hollen, MD; and Ron Wyden, OR) sent a letter to Stephen C. Goss, the Chief Actuary of Social Security, asking for his analysis of “hypothetical legislation” that cut off payroll taxes as of January 1, 2021.

In a response this week, Goss wrote that the Social Security and Disability Insurance Trust Fund reserves “would become permanently depleted by the middle of calendar year 2023, with no ability to pay OASI [Old Age and Survivors Insurance) benefits thereafter.”

But he prefaced that remark by also writing that “the projected depletion date of the trust fund reserves [~2034] would be essentially unaffected by the legislation,” if the trust funds were “held harmless” by further provisions in the legislation—as they were during payroll tax abatements in 2010 to 2012 recession.

Eugene Steuerle

Here at RIJ, this exchange naturally raised questions. As we often do, we took our Social Security questions to Eugene Steuerle of the Urban Institute, a Social Security expert with many years’ experience in the federal government. Our interview with Steuerle follows.

RIJ: When Social Security doesn’t have enough revenue to cover benefits, doesn’t it “sell” those bonds to Treasury and receive “cash” so Social Security can pay benefits (all for accounting purposes)?

Steuerle: Yes. But the trust fund doesn’t have enough bonds to pay “full” benefits after 2035 or so.  If it takes in less taxes, that date gets moved up.

RIJ: Other than interest, in what sense does the trust fund have income?

Steuerle: Trust fund income includes Social Security payroll taxes or “contributions,” plus interest from the trust fund bonds, as well as taxes collected through income taxation of Social Security benefits. The payroll taxes dominate.

RIJ: Doesn’t Social Security simply “lend” money to Treasury when there are surplus payroll taxes and then “redeem” the “debt” when there is a shortfall in payroll taxes (all strictly for accounting purposes)?

Steuerle: Yes, but eventually there will be no bonds left, and the law requires that benefits must be paid only out of the trust funds, thus preventing borrowing from Treasury absent new legislation.

RIJ: Has Social Security already begun to sell its special bonds to Treasury, thus reducing the “trust fund”? If so, when exactly did that begin? How far has the trust shrunk since its peak value?

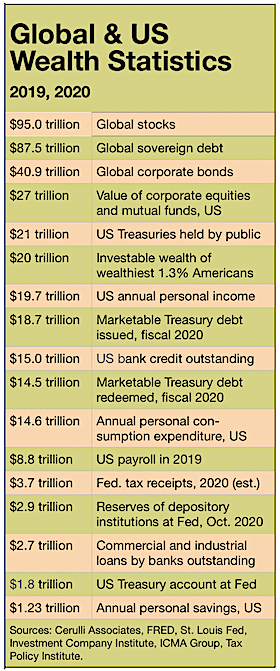
Steuerle: This past year taxes and interest just about matched benefit payments. Benefit payments are roughly $1.05 trillion; asset reserves are about $2.9 trillion. In the future, trust fund bonds will increasingly be sold. And trust fund income from all sources will increasingly fall short of benefits.

See the table below for 2019. The unemployment associated with the current pandemic and its aftermath also adds to the gap for 2020 and probably the next few years.

RIJ: So payroll tax is “income” for the trust fund? Has payroll tax ever flowed into the trust fund before being paid to beneficiaries or “loaned” to the Treasury general fund?

Steuerle: This is all definitional. The taxes come in mainly to the IRS, which credits them to the Social Security trust fund. The trust fund then holds special purpose Treasury bonds for any reserves arising from past surpluses. The federal government then “writes checks” against the trust fund balances.

RIJ: If Congress were to pass the President’s “hypothetical legislation” for a payroll tax holiday in 2021, then would Social Security have zero revenue and zero remaining trust funds within the next couple of years?

Steuerle: If you take away payroll taxes and trust fund interest, the trust funds [now at $2.9 trillion] would be depleted quickly. Losing one year of payroll taxes would deprive the trust fund about $1 trillion of income, plus future interest on that income.

RIJ: What about the previous forecast, or conventional wisdom, that Social Security, as is, can pay 100% of promised benefits to 2034 and 75% of promised benefits thereafter? Is that forecast now obsolete?

Steuerle: Yes, unless Congress would pay back Social Security for payroll tax revenue lost during a suspension. which is what has done in the past.  But the President’s authority on deferring taxes does not extend to this matter—though that appears to be what he is counting on.

In a sense, the President’s position is not very different from that of some Democrats, who seem to feel that, if they can delay reform until close to 2035, Congress would not allow everyone’s benefit to be cut by 25%. That is, at that point, there would be no money in the trust funds. Essentially all revenues would derive from the payroll tax, and those taxes could only cover 75% of scheduled benefit payments to current retirees and disabled persons.

RIJ: So Social Security will not be able to pay any benefits from 2023 onward if the hypothetical legislation passes?

Steuerle: Yes—unless, as I said, Congress pays Social Security back and the payroll taxes start flowing again.

RIJ: Can’t Congress just pass a law that says payroll tax shortfalls will be covered by appropriations from the Treasury general fund? After all, today’s retirees paid income tax in addition to payroll tax for decades.

Steuerle: Yes, Congress can convert Social Security deficits to non-Social Security deficits. The effect on the unified deficit is essentially the same.

RIJ: Why is the public still led to believe that Social Security has the same constraints as a private pension fund, when the truth is that the U.S. Treasury can always meet its obligations; that only self-imposed constraints, and not lack of resources, would stop the US Treasury from paying promised benefits?

Steuerle: This goes all the way back to the Roosevelt administration. Roosevelt himself argued that he did not believe that the system should be set up with shortfalls that would force future Congresses to legislate new tax increases on future taxpayers. He supported the “private pension” analogy. He wanted people to believe they had “earned” their benefits even though, in a pay-as-you-go system, each generation’s taxes largely go to pay their parents’ benefits and are not saved for their own. Even those who argue that ‘deficits don’t matter’ seldom if ever suggest that we run government without ever collecting taxes. Where’s the limit?

RIJ: No, that would invite inflation and eliminate a policymaking tool. But I’ll defer to you for the last word on that.

Steuerle: The bottom line is that we benefit from government and we pay for it. Leaving more bills to our children, regardless of which government account is used, doesn’t negate that fundamental logic.

RIJ: Thanks, Gene, as always.

© 2020 RIJ Publishing LLC. All rights reserved.

Reasons (Not) to Be Cheerful

Never before have I seen a market so highly valued in the face of overwhelming uncertainty. Yet today the U.S. stock market stands at nosebleed-inducing levels of multiple, whilst the fundamentals seem more uncertain than ever before. It appears as though the U.S. stock market has drunk from Dr. Pangloss’ Kool-Aid – where everything is for the best in the best of all possible worlds. It is as if Mr. Market is taking a tail risk (albeit a good one) and pricing it with certainty.

Now let me be clear, I don’t claim to know the answers to any of the deep imponderables that face the world today. I have no idea what the shape of the recovery will be, I have no idea how easy it will be to get all the unemployed back to work. I have no idea if we will see a second wave of Covid-19 or what we will do if we do encounter such an event. But I do know that these questions exist. And that means I should demand a margin of safety – wriggle room for bad outcomes if you like. Mr. Market clearly does not share my view.

Instead, as best I can tell, the driving narrative behind a V-shaped recovery in the stock market seems to be centered on “The Fed” or, even more vaguely, “liquidity creation.” It is tricky to argue for any direct linkage from the Fed’s balance sheet expansion programs to equities. The vast majority of QE programs have really been about maturity transformation (swapping long debt for very short-term debt). Nor can one claim a good link between QEs to yields to equities.

In fact, during each of the three previous waves of QE, bond yields actually rose. In addition, yields around the world are low but you don’t see other equity markets sporting extreme valuations. So, I think that Fed-based explanations are at best ex post justifications for the performance of the stock market; at worst they are part of a dangerously incorrect narrative driving sentiment (and prices higher).

The U.S. stock market looks increasingly like the hapless Wile E. Coyote, running off the edge of a cliff in pursuit of the pesky Roadrunner but not yet realizing the ground beneath his feet had run out some time ago.

Investing is always about making decisions under a cloud of uncertainty. It is how one deals with the uncertainty that distinguishes the long-term value-based investor from the rest. Rather than acting as if the uncertainty doesn’t exist (the current fad), the value investor embraces it and demands a margin of safety to reflect the unknown. There is no margin of safety in the pricing of U.S. stocks today. Voltaire observed, “Doubt is not a pleasant condition, but certainty is absurd.” The U.S. stock market appears to be absurd.

Click here to read the entire blogpost.

© 2020 GMO LLC.

Imagining the Post-Pandemic Economy

During a severe recession or financial crisis, the necessary conduct of the federal government’s fiscal policy may be metaphorically compared to the response of a homeowner whose house has caught fire because of faulty wiring. The first step is not to sue the contractor or lobby for stronger building codes; the fire has to be extinguished first.

So it is with fiscal policy at the moment. The immediate goal of fiscal policy should be to provide more stimulus; shrinking the deficit can come later. More stimulus is needed for two reasons: First, policies of social distancing and localized lockdowns reduce demand not only for services in such sectors as dining out and entertainment, but also for the goods and services that are not directly affected, because unemployed restaurant and travel sector workers cannot afford them.

Second, no one thinks that the unemployed should suffer needlessly. But how much stimulus should they receive? Consider the cost of paying 30 million unemployed an extra $600 a week for just two months. That’s about $5,000 per person, for a total of $150 billion. Unemployment is expected to drop, but how fast is highly uncertain, and it is easy to see how this figure could grow.

Similarly, the revenues of states and cities can be expected to be below normal for some time to come, and this shortfall will by no means be confined to “blue” states. Landlords, particularly small ones and small business owners, may also need assistance. So continued stimulus and a flexible attitude to providing it will be called for.

Eventually, the economy will recover, and the need for stimulus will abate. However, federal debt has already grown substantially as a percentage of GDP, and will grow further. Deficits, even with declining stimulus money, will remain high.

The federal government faces the challenge of supporting a recovery without sparking inflation. The pandemic has obviously affected household, corporate, and state and local budgets. Some, perhaps most, of these effects may be reversed as the economy recovers, but others may not, and fiscal policy must take the irreversible effects into account.

In addition, changes in the political climate may lead to pressures for new expenditure programs or expansions of existing ones. Finally, interest rates may rise, which will constrain how expansionary fiscal policy can be.

The consequences of changes in household spending patterns. A recovery in spending on dining out, travel and other pandemic-affected services is likely to occur as economic recovery takes hold. However, the rebound in spending on the directly affected services will probably not be complete.

Households who have discovered the convenience and lower cost of shopping online may not revert to their old habits. Similarly, lingering fears of contagion may keep many cautious people at home, and home-cooked meals may become a preferred alternative to eating out. Many households may also try to build up or reconstitute emergency reserves.

In addition, the increase in online teaching may not be fully reversed. If it costs less than in-person instruction, virtual education will benefit both state and local budgets. If some of the cost reduction is passed on to students and their families, it will benefit household budgets as well.

More online teaching could also entail a decline in construction of new educational facilities, especially at the university level, where online teaching is less disruptive to the work-life balance of parents. If a decline in expenditure in that area isn’t offset by increases in other areas, and if household saving increases, it could create space for more governmental spending at the federal, state and local level.

Consequences of the impact on private commercial investment: The boom in online spending will probably reduce investment in business construction. Investment in bricks and mortar retailing, already on the decline, will be further affected. This decline isn’t likely to be offset by increases in expenditure on new facilities by the big online retailers. A similar effect may occur from an incomplete reversal of the recent shift to working from home. Demand for public transportation may also decline (although car sales may increase), which would benefit state and local government budgets.

Repercussions of the current political climate: A change in administration could lead to an increase in public health expenditure, either via an expansion of the Affordable Care Act, an increase in the numbers of Americans covered by Medicare, or an improvement in the quality of that program’s coverage.

Serious steps to deal with the country’s income disparities could also lead to both increases in investment in vocational and academic education, as well as changes to the income tax system that make it more progressive. More liberalized grants and loans for students and their families are another possibility.

Interest rates: Despite the major increase in government debt, interest rates have remained low. The increase in borrowing by the federal government has been financed by increased private domestic saving (some of it generated by the increase in incomes associated with the stimulus) as well as by foreign saving. Rates aren’t likely to remain low forever, however, particularly if the economic recovery is robust.

Higher rates will restrict the options for fiscal policy because of their impact on interest expenditure and the stock of federal debt, and may crowd out some interest-sensitive private spending, like housing construction. Rising rates could be a sign that the economy is starting to overheat, sending a signal that the monetary and fiscal stance needs to be tighter.

The net effect on the fiscal stance: President Harry Truman, after listening to economists set out the consequences of alterative policies—“on the one hand… but on the other”—is famous for pining after a “one-handed economist.” But desirable though one-handedness may be, these are remarkably uncertain times, and it would be foolish to recommend a rigid course for fiscal policy.

That said, some conditional conclusions on the desirable course of fiscal policy may be drawn. It is likely, though not certain, that the pandemic’s depressing effects on private expenditure would create room for an increase in expenditure on social programs.

Continued low interest rates would argue for more spending on public infrastructure. However, we need to recognize that a strong recovery’s impact on inflation would require some tightening of monetary policy, accompanied by less government spending. Given how low inflation is at the moment, and the pain that would be inflicted on American society by a faltering recovery, it may be best to risk an uptick in inflation.

Both fiscal and monetary policy will have to be far-sighted and nimble. As time passes, it should become obvious which of the pandemic’s depressive effects on private spending will have been reversed, and by how much. The federal government’s budget is not by its nature a flexible policy instrument—at least, not compared with monetary policy—but both the overall level and composition of expenditure will need to adjust as our knowledge of the effects of the pandemic grows.

© 2020 RIJ Publishing LLC. All rights reserved.

An Income-Generating ‘Collar’

Baby boomers who are near or in retirement face particularly nasty tradeoffs these days. They need reliable income, but bond yields are low. They need upside, but the recession makes equities look doubtful—their current Fed-fueled buoyancy notwithstanding.

There are no silver-plated solutions that advisers can offer their clients in the newest “new normal.” But advisers need tools that will nudge clients into “staying the course.”

A variety of risk managed products from asset managers and life insurers might fill the bill. Nationwide’s Risk-Managed Income ETF (NUSI), launched last December, aims to check several boxes at once. Client assets are invested in the stocks of the tech-heavy NASDAQ-100. This position is overlaid with a “protective net-credit collar.”

NUSI’s most eye-catching feature, however, involves income. The fund pays out a monthly distribution composed of dividends, a premium (“net credit”) from the options trades, and, if necessary, a bit of fund’s assets; the annual expense ratio is 0.68%.

Jonathan Molchan

“The goal is to generate income, protect against market downturns, and over time to smooth the return profile so that it can support a seven to eight percent annual yield,” said Jonathan Molchan, the lead portfolio manager of NUSI at the subadvisor of the fund, Harvest Volatility Management in New York, which executes the collar strategy for Nationwide.

Since its inception last December, NUSI has paid its shareholders 0.65% of assets per month, or a respectable 7.88% per year. In addition, its NAV (net asset value) is up about 10% since January 1, for a total return of about 17%. In March 2020, when the S&P 500 dropped 30%, NUSI was down only about 10%.

How NUSI works

If you’re at all familiar with options (and if you read Nationwide’s NUSI whitepaper), NUSI won’t be hard for understand (though your clients might struggle with the concept.) It has some wrinkles that may require some re-reading, however. Here’s how it works:

Step One. The fund directly owns all 100 stocks in the NASDAQ-100 index, but not by purchasing the QQQ ETF. The five biggest stocks in this tech-heavy, non-financial index are Apple, Microsoft, Amazon, Facebook and Alphabet (Google).

Step Two. Each month, the options writer (Nationwide outsources this function to Harvest Volatility Management) sells covered calls on the NASDAQ-100 that are near-the-money or slightly out-of-the-money. In other words, the fund manager sells a counterparty the right to buy the NASDAQ-100 Index at a price slightly higher than the current price.

Step Three. The fund manager uses part of the revenue from the sale of the covered call (“covered” means that the fund already holds the underlying securities as collateral) to buy out-of-the-money puts on the NASDAQ-100. This puts a floor under the losses the fund can suffer if the NASDAQ-100 goes down.

Step Four. Investors receive monthly distributions consisting of the net credit that’s left over after selling the covered call and buying the protective put, plus the dividend yield of the stocks in the NASDAQ-100 (about 0.75% a year).

“The fund has a managed distribution of 65 basis points of month,” Molchan told RIJ. “The composition of the distribution can change; it’s comprised of premium from net gain on the options, dividends, and appreciation of the underlying investment. Based on the rules-based mechanism we use, the sale of the call and purchase of the put should always generate a net credit. If it comes up a little short, you turn to the dividends and potential capital gain.”

Step Five. Any net realized capital gains are distributed annually. Any excess premium from the sale of the covered call each month is reinvested in the fund.

What could go wrong?

Sounds good so far; what could possibly go wrong? In a rising market, any gain in the NASDAQ-100 above the strike price would normally accrue to the purchaser of the covered call—at the expense of the NUSI shareholders. To prevent that potential disaster, the NUSI fund manager (responding to a signal from NUSI’s hedging model) “closes the call option” by buying it back. (Since he used a “European call,” he can do that.) The NUSI investor benefits from any subsequent growth in the NASDAQ-100 index.

This year, NUSI paid out about 16 cents a share (0.65% of the ~$25 share price) per month. In March, during the crash, the distribution dropped to about 15 cents. During the recovery since the crash, the distribution has risen to almost 17 cents.

So someone owning 1,000 shares (worth about $25,000) would have received $150 to $170 per month. At that rate, the annual payout would be about $2,000. In addition, the fund has appreciated by about 10% so far this year. The fund’s total return since inception last December has been about 18%.

Of course, there’s the potential for disappointment or, if you prefer, Fear of Missing Out (FOMO). A NUSI investor is invested in the NASDAQ-100 stocks, but the cost of the protective collar meant that the fund captured about 60% of the 31% gain of QQQ shares so far this year.

“With the downside protection you lose less on the way down, and you have the ability to uncap in a rising market. That gives you a return profile that seeks to smooth out the distribution of returns,” Molchan said.

“This strategy is not new. Institutions and hedge funds have used it for decades. Similar strategies have been around since the 90s. It’s just an institutional quantitative twist on combining two popular options strategies and bringing them to market in an ETF wrapper. A strategy that would have involved multiple trades for an institution or hedge fund is now a packaged product for retail investors.”

The monthly reset of the options and the dynamic nature of the rules-based nature of the hedging makes the fund relatively nimble. With a monthly horizon, it also avoids the duration and credit risks of a bond fund.

Of course, the NASDAQ-100 has soared this year, and the capital appreciation has helped NUSI hit its aggressive distribution target. Could the fund continue to pay out almost 8% a year in a flat or declining market without running down principal within just a few years? “There’s a measure of downside protection every month,” Molchan told RIJ. “Whether the NASDAQ-100 return is 7% or 17%, the mechanism is designed to support the dividend, satisfy the income needs of the client, and reduce volatility.”

In a flat market, according to Nationwide illustration, NUSI’s covered call options don’t generate as much premium, because volatility is low and there’s less demand for protection. In a down market, NUSI’s downside protective put means fewer losses to overcome when markets rebound.

Alternative solutions

Nationwide is positioning NUSI as a complement to a 60/40 balanced fund, and as an alternative to other strategies that investors use when reaching for yield—high-yield bonds, emerging market bonds, real estate investment trusts, and master limited partnerships.

NUSI will presumably compete with other structured solutions that asset managers and life insurers have placed on the market. One potential competitor would be registered index-linked annuities, or RILAs, which have enjoyed steadily rising sales since they were introduced by Equitable (then AXA) in 2011.

Also known as structured variable annuities, these are general account products—the underlying assets are fixed income investments in a life insurer’s general account—that offer interest returns up to cap and down to a “floor” or “buffer.”

Their options strategy is the reverse of NUSI’s. The fund manager typically sells a put (setting a downside buffer that eliminates the first 10% in losses, say) and then uses the premium and interest from the general fund to buy a call spread (setting an upside cap on gains).

Several life insurers also sell structured ETFs. This spring, Allianz Life and New York Life both introduced these products, which use so-called FLEX options. According to the Options Clearing Corporation, these are “customizable products where the investor can set the terms for the tradable contract and have the security of an exchange-traded product.”

In addition, “The exercise style, expiration date and strike price can all be chosen by the investor to create a new product that is not currently being traded at an exchange. In general, investors set the criteria and have their brokerage firm solicit the best possible market-price from different market participants.”

Innovator Capital Management introduced the first structured ETF, based on movements of the S&P 500 Index, two years ago. These “Defined Outcome” funds use a FLEX options strategy designed by Milliman, the global actuarial consulting firm. Just this week, the Innovator 20+ Year Treasury Bond 5 Floor ETF – July and the Innovator 20+ Year Treasury Bond 9 Buffer ETF – July were launched and listed on the Cboe.

The first seeks to provide exposure to the upside performance of the iShares 20+ Year Treasury Bond ETF (TLT) to a cap and a floor against downside losses in excess of 5% over the outcome period. The second seeks to provide exposure to the upside performance of TLT to a cap and a buffer against the first 9% of price losses over the outcome period.

Any and all of these products imply a bet that volatility in equities and low interest rates will dominate the marketplace for the foreseeable future. You wouldn’t put all of your money into one of these products. But taking a modest position probably wouldn’t hurt. The future is about as inscrutable as it could possibly get.

© 2020 RIJ Publishing LLC. All rights reserved.

Low interest rates shock sales of most annuities

The Fed may have saved the stock market last spring with its zero interest rate policy, but the annuity market paid the price. Total annuity sales were $48.6 billion in 2Q2020, down 24% from 2Q2019, according to the Secure Retirement Institute (SRI) U.S. Individual Annuity Sales Survey.

Registered index-linked annuities (RILAs) were the only major product line to record positive growth in the second quarter. RILA sales were $4.5 billion in the second quarter, up 8% from second quarter 2019. This marks the 22nd consecutive quarter-over-quarter growth for RILA sales. Year-to-date, RILA sales were $9.4 billion, up 22% from the first half of 2019.

“Bank sales of RILAs dropped 15% in the second quarter while independent and full-service national broker dealers’ sales increased 7% each and represented more than half of the RILA sales for the quarter,” said Todd Giesing, senior annuity research director, SRI, in a release. “Banks traditionally have a more conservative client base, which had them gravitate to other protection-based products in response to the unfavorable economic conditions.”

“The global pandemic presented unique challenges to annuity distribution in the second quarter,” said Giesing. “Aside from the economic impact, social distancing disrupted business operations for companies and advisors over the past three months. The focus this quarter was on protection-based solutions as equity market volatility had investors seeking safety.”


Seeking shelter
Fixed-rate deferred annuity sales were $12.8 billion, down 2% from prior year. However, fixed-rate deferred sales jumped 31% compared with first quarter 2020 results. Despite the rapid declines in interest rates, year-to-date fixed-rate deferred annuity sales totaled $22.6 billion, down 20% from than prior year.

“While low interest rates dampened fixed-rate deferred annuity crediting rates, sales climbed from the first quarter as investors pursued short-term safety,” said Giesing. “We did see a significant shift in distribution in the second quarter, as the broker-dealer channels drove fixed-rate deferred sales growth.”

Broker-dealers accounted for 50% of fixed-rate deferred annuity sales in the second quarter, up 11 percentage points from 39% in the first quarter. Last year, broker dealer channels only accounted for 29% of overall fixed-rate deferred sales. “This shift suggests Americans continue to be concerned about the economic impact of the pandemic and are seeking short-term solutions to preserve and protect their savings,” Giesing noted.

In the first six months of 2020, total annuity sales were $104.4 billion, 16% lower than prior year.

Lowest VA sales since 1996

Despite the growth in RILA sales, total variable annuity (VA) sales dropped 19% in the second quarter to $20.8 billion, representing the lowest quarterly VA sales since 1996. VA sales were $46.8 billion in the first half of 2020, down 4% from the first half of 2019.

Total fixed annuity sales were $27.8 billion, down 27% from prior year, driven by a significant drop in fixed indexed annuity (FIA) sales. Year-to-date, fixed annuities totaled $57.6 billion, 24% lower than the first half of 2019.

FIA sales fell 40% to $12 billion in the second quarter, representing the lowest quarterly total for FIAs since first quarter 2015. FIA sales declined 26% in the first half of 2020 to $28.2 billion.

“In this continued ultra-low interest rate environment, accumulation-focused FIAs without guaranteed lifetime benefit riders (GLB) experienced a significant decline in the second quarter, down 42% compared with prior year,” noted Giesing. “FIA manufacturers continue to lower crediting rates, making other protection-based solutions, such as fixed-rated deferred and RILAs, more attractive.”

Low interest rates continue to inhibit income annuity sales. Single premium immediate annuities (SPIAs) were $1.4 billion in the second quarter, 48% below sales in the second quarter of 2019. This is the lowest quarterly level of SPIA sales in 13 years. Year-to-date, SPIA sales were $3.3 billion, down 40% compared with the first six months of 2019.

Deferred income annuity (DIA) sales were $353 million in the second quarter, less than half of sales recorded in the second quarter of 2019. Year-to-date, DIA sales were $823 million, 39% lower than prior year results.

Second quarter 2020 annuities industry estimates represent 95% of the total market. A summary of the results can be found in LIMRA’s Fact Tank.

To view the top 20 rankings of total, variable and fixed annuity writers for the second quarter 2020, please visit Second Quarter 2020 Annuity Rankings. To view the top 20 rankings of only fixed annuity writers for the second quarter 2020, please visit Second Quarter 2020 Fixed Annuity Rankings.

© 2020 RIJ Publishing LLC.

Honorable Mention

U.S. equity funds on pace for record outflows: Morningstar

Morningstar, Inc. this week reported estimated U.S. mutual fund and exchange-traded fund (ETF) flows for July 2020. Overall, long-term mutual funds and ETFs collected $43 billion in July, marking their fourth consecutive month of inflows. Total inflows from April through July were $164 billion, slightly more than half of the $327 billion of outflows that affected those funds in March.

Highlights from Morningstar’s report about U.S. fund flows for July 2020 include:

Taxable-bond funds continue to see strong inflows, gathering $86 billion in July. This is the group’s second-highest monthly tally behind June’s $92 billion record. In contrast, U.S. equity funds had record outflows of nearly $46 billion in July, and their $147 billion of outflows for the year to date puts the group on track for its worst annual outflows ever, surpassing 2015’s record outflows of $63 billion.

Sector-equity funds continue to attract investors and collected $3 billion of inflows in July. Investors have targeted sectors such as technology and health that could benefit from social distancing policies, work-from-home arrangements, e-commerce, and the search for a coronavirus vaccine. However, investors dropped out of sectors hit hard by government-imposed lockdowns or weak demand, including real estate and natural resources.

Commodities funds posted another strong month in July, drawing in $8 billion and bringing year-to-date total inflows to nearly $39 billion. Investors continued to seek protection in precious-metals funds, pouring $4.0 billion into SPDR Gold Shares and a total of $3.5 billion into iShares Gold Trust and iShares Silver Trust.

Morningstar debuted two environmental, social, and governance (ESG)-related data points to its fund flows analysis in July: the Morningstar Sustainability Rating and Morningstar Low Carbon Designation. U.S. equity funds with 4- or 5-globe ratings and a Low Carbon Designation have had net inflows thus far year-to-date in 2020, while most other combinations saw net outflows for the same period.

Among fund families, iShares topped the list with $19 billion of inflows in July. Much of that went into taxable-bond funds, including investment-grade and high-yield corporate-bond ETFs. The Federal Reserve continues to be active in those segments, but its purchases do not account for the majority of iShares’ flows. Meanwhile, many active managers saw outflows, including Dimensional Fund Advisors, American Funds, Oakmark, and Primecap.

Insurers remain vulnerable to bond downgrades: AM Best

Recent macroeconomic uncertainty due to the COVID-19 pandemic is a concern for insurers’ balance sheets as corporate bonds constitute a majority of the insurance industry’s assets, according to a new AM Best special report.

The Best Special Report, titled, “Corporate Bond Holdings Pose Risk to Insurers’ Balance Sheets,” states that the corporate bond sector has been hit on two different fronts.

  • First, many companies have taken advantage of the low interest rate environment, and as a result, are more highly leveraged than they were a decade ago.
  • Second, a cut in corporate earnings due to closures of nonessential businesses and the significant rise in the unemployment rate will severely hamper earnings.

Corporate bonds account for nearly 70% of the bond portfolios of each of the three insurance segments. Bonds from industries such as services, manufacturing, retail, energy and public utilities will be affected more negatively than others. Many of these sectors already had heightened below-investment-grade ratings as of year-end 2019.

According to the report, the leverage bubble may have led to a downward migration in credit quality, but the pullback in consumer demand is likely to exacerbate the credit crisis for borrowers.

State shutdowns have sparked a rise in new bond sales, driven by companies trying to borrow their way through the economic downturn. The shutdowns also have driven a surge in the number of bonds trading at distressed levels, with a greater potential for defaults. Companies with heightened exposures to the aforementioned vulnerable industries will be at a higher risk of experiencing downgrades and defaults.

In aggregate, the industry’s exposure to these sectors appears to be modest; however, individual insurers with larger allocations to these industries may face balance sheet risks.

Less than 20% of the bond portfolios of almost 90% of the property/casualty and health rating units are allocated to these sectors, versus just 47% of life/annuity (L/A) rating units. The 20 rating units with the largest exposures to the high-impact sectors are predominantly L/A companies. Some insurers also have large amounts of below-investment-grade assets in these sectors, although less than 2% of the rated companies have exposures that exceed 20% of capital and surplus.

If liquidity becomes a factor for many U.S. bond holdings, the macroeconomic environment could prompt many insurers to re-evaluate portions of their asset holdings and lead to redistribution across market sectors and risk classes.

‘Schwab Plan’ web-based planning tool unveiled

Charles Schwab has launched a free digital financial planning tool designed to help investors establish and stay on track toward their personalized retirement goals. Called the Schwab Plan, the service is available to all Schwab retail clients with no minimum asset requirement.

“With this move, Schwab is now the only large retail brokerage to offer complimentary financial planning to all clients, combined with no account minimums for individual investors, zero commission online equity, option and ETF trades, and a satisfaction guarantee,” a Schwab release said.

To begin the planning process, clients complete a short questionnaire, and in as little as 15 minutes they can generate a retirement plan that shows retirement goals and probability of funding those goals, a comparison of an individual’s current asset allocation to a recommended allocation based on plan inputs, and suggested next steps.

Schwab Plan can also aggregate and factor in accounts held outside of Schwab. While Schwab Plan is available to clients at no cost, any investments they ultimately make may incur costs such as fund operating expenses and advisory fees.

Schwab Plan’s algorithm considers a range of variables, such as desired retirement age, retirement goals, social security expectations, portfolio risk profile and asset allocation, and various income sources.

In conjunction with the launch of Schwab Plan, Schwab has also created an online Financial Planning Hub that features an array of goals-based calculators, tools, and educational planning content to help investors get quick answers on topics such as retirement, saving for college, and buying a home.

Investors can find out if they are saving enough for retirement, determine how much they can afford to withdraw in retirement, get an estimated monthly college savings goal, and plan for a home purchase using a mortgage calculator. The Financial Planning Hub is available to both Schwab clients and non-clients.

In March 2019, Schwab, in its capacity as a registered investment advisor, introduced Schwab Intelligent Portfolios Premium, a digital subscription-based financial planning and automated investing service which provides unlimited access to a Certified Financial Planner, interactive planning tools, and a personalized roadmap for reaching financial goals.

Schwab Intelligent Portfolios Premium charges an initial one-time $300 fee for planning and a $30 monthly subscription after that ($90 billed quarterly), which does not change at higher asset levels. Investors who prefer a more in-depth or one-on-one planning experience can work with a financial consultant in a local Schwab branch.

Fidelity retirement accounts keep growing

Stock market gains and steady investor behavior drove a 20% increase in contributions to traditional and Roth IRAs in the second quarter of 2020, Fidelity Investments reported this week. Contributions to 401(k) and 403(b) accounts, from employees and their employers, remained steady.

“Nearly 90% of employers continued to offer matching contributions to their employees over the last quarter, despite the unsteady business landscape,” said Kevin Barry, president of Workplace Investing at Fidelity Investments.

Highlights from Fidelity’s Q2 2020 analysis include:

The average IRA balance was $111,500, up 13% from 1Q2020 and slightly higher than the average balance of $110,400 a year ago. The average 401(k) balance increased to $104,400 in Q2, a 14% increase from Q1 but down 2% from a year ago. The average 403(b) account balance increased to $91,100, an increase of 17% from last quarter and up 3% from a year ago.

More than three quarters (76%) of workers received an employer contribution in Q2, with the average employer contribution reaching $1,080. Over the last four quarters, a record 88% of 401(k) savers received an employer contribution, with employers contributing an average of $4,030 per account over the last 12 months.

While organizations across the country were taking steps to address the financial impact of the economic downturn, Fidelity found that only 11% of employers suspended their 401(k) company match in Q2. Of the 11% of employers that suspended their company match, 32% indicated they plan to reinstate their match in the next year and 48% plan to reinstate as soon as financially possible. Only 6% of employers indicated they currently have no plans to reinstate their match.

Extended tax season saw record flows into IRAs and other retail retirement accounts. Investors continued to leverage IRAs and other retail retirement accounts, including SEP, SIMPLE and Rollover IRAs, as the extended tax season helped contribute to a record $82.1 billion going into these accounts through July of 2020.

IRA contributions in the first half of 2020 were up 22% from this time last year, with an 18% increase in the number of contributing accounts. Contributions to Roth IRAs were up 33% and participation up 25% from the same time last year. Overall, new IRA accounts opened in the first half of 2020 were up 33% over last year.

Almost nine out of 10 individuals (88%) contributed to their 401(k) in Q2, a slight drop from last quarter’s record high of 89% but still in the top five averages since 2002. Less than one percent (0.8%) of 401(k) savers stopped saving in the quarter, while 9% increased their contribution rate.

Among 403(b) accounts, 96% of individuals either maintained or increased their contribution rate in Q2. Among 403(b) accounts specifically in the health care industry, which includes workers at hospitals and health networks, 96% of individuals maintained or increased their contribution rate in Q2.

The past quarter saw Millennials maintain a focus on contributing to their retirement accounts, with the number of IRA accounts owned by Millennials in Q2 2020 increasing by 23% since Q2 2019. In particular, Millennials continued to prefer investing in Roth IRAs, with a 36% year-over-year growth in the number of contributing accounts and a 50% increase in the amount of Roth IRA contributions.

Investors continue to use managed accounts for retirement savings. More than 25,000 individuals enrolled in Fidelity’s Personalized Planning and Advice at Work managed account solution in Q2, bringing the total number of enrollees to more than 60,000 year to date and representing over $3 billion in 401(k) assets. In addition, visits to Fidelity’s Planning and Guidance Center, which helps create a strategy for retirement savings, increased 22% in Q2 compared to a year ago. In June alone, visits to Fidelity’s website for individuals saving within a 401(k) or 403(b) increased 42% over June of 2019.

The CARES Act was signed into law in late March 2020 in response to the economic fallout of the COVID-19 pandemic. By early April, 98% of Fidelity’s workplace clients had adopted the CARES Act distribution provisions, which allowed their employees to tap their savings to cover financial needs related to the economic downturn.

As of the end of Q2, 711,000 individuals had taken a CARES Act distribution from their retirement account, which represents 3% of eligible employees on Fidelity’s workplace savings platform.

The overall average withdrawal amount was $12,100, while the median withdrawal amount was $4,800. Individuals continued to seek out information on the CARES Act and COVID-19 issues, as Fidelity’s COVID-19 information website was viewed more than 1.3 million times in the quarter.

Prudential assumes Boise Cascade pension risk

Prudential Retirement, a unit of Prudential Financial, Inc. (NYSE: PRU), has completed its fourth and final pension de-risking transaction with Boise Cascade Company (NYSE: BCC), the Idaho-based wood products manufacturer and building materials distributor.

Prior to this final transaction, Boise Cascade had transferred U.S. pension plan assets to Prudential in three phases: $152 million in April 2018; $125 million in August 2018; and $20 million in September 2019.

“The final transaction in our three-year engagement with Boise Cascade represents the first time a plan sponsor has been able to guarantee the cost of a plan termination early in the lengthy termination process by transferring all of the risks to an insurer,” Peggy McDonald, senior vice president and actuary, Prudential Retirement’s Investment & Pension Solutions, said in a release.

The transaction used one of three structures for plan termination examined by McDonald and the Prudential Retirement Pension Risk Transfer team. Those structures will be described in an upcoming white paper, “Unlocking Value in Pension Plan Terminations.”

“Until now, plan sponsors haven’t been able to calculate the actual cost of unwinding a plan until the end of the termination process, which can take a year or more,” McDonald said. “This approach provided Boise Cascade with cost certainty early in the process by securing a buy-in contract under which Prudential assumes the lump sum election rate risk.”

SIMON adds Symetra annuities to its platform

SIMON Annuities and Insurance Services LLC has expanded its product shelf by adding Symetra Life’s fixed indexed annuities and structured variable annuities to the SIMON annuities platform and digital marketplace for wealth managers, SIMON announced this week.

Both Symetra product lines are now available on SIMON’s Marketplace, which provides pre- and post-sale analytics to financial professionals serving the retirement needs of clients. The Symetra product lineup will expand to include fixed annuities later this year.

Advisers can now explore Symetra annuity products and features, run allocation and income analytics, and access product-specific marketing literature from within SIMON’s interactive platform.


Two Cheers for DOL’s Lifetime Income Disclosure

The Department of Labor has issued a 112-page “interim final rule”—still subject to amendment in response to public comment, but final if not amended—that implements legislation requiring defined contribution plans to include “lifetime income illustrations” in an annual plan benefit statement.

These illustrations are intended to give plan participants an idea of how much monthly income their DC savings could generate, based on certain assumptions specified in the rule.

The idea—a logical idea, because policymakers have decided that participants should think of their DC savings as income, not only as lump sums—was to show participants where they stand at the moment in terms of preparing financially for retirement.

But this rule isn’t particularly helpful, and even though it might be amended after the upcoming public comment period, it might not be.

The rule merely tells participants (or a participant and spouse)—no matter if they’re 25 years old today or 65 years old or any age in between–how much income their current savings would buy if they were reaching retirement age today, and bought an annuity at today’s interest rates and annuity prices.

“Income illustrations are potentially important for our quest to expand lifetime income in the DC system,” former senior Treasury official and current Brookings Institution nonresident senior fellow Mark Iwry told RIJ this week. But he urges that Labor’s final rule also encourage plans to include income illustrations based on the projected size of account balances at retirement age, which he advocated when he served in the Obama administration.

“Labor can find authority under the SECURE Act to protect plan sponsors from liability for providing these much more helpful projections. The Act did not explicitly limit liability protection for plan sponsors to illustrations based on current account balances as opposed to both current and projected future balances.

“The language should have explicitly protected and encouraged such projections, but it was not explicit in either direction. Yes, Congress also had other fish to fry—though it wouldn’t have taken much extra effort to fry this guppy,” he said.

In any event, Iwry believes Labor has implicit statutory authority, as it did before the legislation, but “might have hesitated, at the interim rule stage, to include liability protections for appropriate projections because it first wanted to see whether the upcoming public comment process would lay a sufficient foundation in the public record regarding need, demand, and rationale.”

In its interim final rule, the DOL provides the example of a 40-year-old woman with current savings of $125,000. Then it shows that if she were 67 today (her intended retirement age), and paid $125,000 to a life insurer for an annuity today, she would receive $645 per month for life (or $533 per month if she bought a joint-life annuity for two people).

That’s a fairly useless number. It won’t help participants project the amount of savings they might accumulate by the time they retire if they keep saving at the current rate, or how much they might be able to generate from those savings.

Rough projections, though admittedly impossible to make precise because the future is unpredictable, would at least give the participant a target number to aim for, and an idea of the savings rate necessary to reach their goals.

In fact, some DC plans already do that. The Social Security Administration has done that. And the DOL even has a calculator on its website that helps people do that. But, as Iwry speculates, some of DOL’s regulation writers may feel that if Congress wanted them to include projections in the regulations, it would have been more helpful to have spelled this out explicitly and therefore DOL’s decision on this is being put off to the final rule.

There’s a back story to all this. The idea of requiring DC plans to disclosure turns out to be more controversial than it might look, for these reasons:

  • Plan sponsors’ attorneys worry that plan participants might interpret an estimate of future income as a promise of future income, and sue their employers for fooling them. [In accordance with the SECURE Act, the DOL rule assures plan sponsors that they won’t be liable for misleading participants as long as they follow the examples, instructions and model language in the rule.]
  • Fund companies don’t necessarily want participants to think about turning their savings into annuities; that would involve a transfer of money from fund companies to insurance companies.
  • Broker-dealers have the same fear; they would prefer that participants roll over their 401(k) savings to a brokerage IRA when they retire.
  • It’s hard to get a consensus on the assumptions that go into a projection. For instance, policymakers had difficulty deciding whether the hypothetical future annuity should be fixed or inflation-adjusted. Even people who buy life annuities rarely buy inflation-adjusted ones, because they cost a lot more.
  • Some people were afraid that, if rank-and-file participants saw how little income their 401(k) savings would produce, they would become discouraged and stop saving (which, as noted, is a reason to illustrate estimated income based on projected savings at retirement age).

There’s also the small problem that, for several reasons, very few Americans ever actually buy the kind of annuities that the DOL wants DC plans to illustrate. Those are fixed life annuities, either immediate (income starts soon after purchase) or deferred (income starting more than 13 months after purchase).

Someone might also mention that participants rarely read their 401(k) disclosures. The people who do probably don’t need any nudge toward saving more for retirement.

All of these issues help explain why the government has kicked this idea down the road for 11 years. It was first proposed in 2009 after Barack Obama was elected. Phyllis Borzi, then a DOL assistant secretary, and Mark Iwry, then senior advisor to the Treasury secretary, both thought it was a great idea. But in 2010 the Democrats lost control of the House of Representatives for eight years. Battles over the Affordable Care Act sidelined most retirement legislation.

Projections of future income were always envisioned. In 2013, retirement consultant, researcher and former senior Treasury official Mark Warshawsky wrote in Institutional Investor magazine:

“If a married participant aged 45 has $125,000 in her 401(k) account and the plan has a normal retirement age of 65, the projected balance would be $557,534 at retirement. Two monthly lifetime non-inflation-indexed annuity streams of payments would be shown, as if the participant were now 65 — $564, based on the current balance and estimated current annuity rates, and $2,514, based on the projected balance.”

More recently, Iwry and two Brookings Institution colleagues evaluated the income disclosure recommended by the RESA Act in 2019 (a predecessor of the SECURE Act), and warned in a whitepaper that:

“an illustration based only on the current account balance is less useful than the combination of that illustration and another that converts a projected future account balance to its income equivalent (while emphasizing the speculative nature of the assumptions and hence the merely illustrative nature of the projections).”

The new rule only indirectly addresses the idea that projections would make the required disclosure more useful in terms of helping a participant get ready for retirement. On page 60, the DOL writes:

“The ability to incorporate social security projections and IRAs; customize assumptions to see the impacts of those changes on the projected lifetime income streams; show the integrated effects of in-plan annuity investment options combined with other plan investments; estimate the gaps between projected monthly incomes at retirement and the desired monthly incomes; provide education about how to close those gaps, and personalize future draw-down strategies that incorporate social security and other retirement assets. Although these flexible and customizable features are likely to better engage participants, and thus, better prepare them for retirement, a recordkeeper can satisfy the conditions set forth in the [interim final rule] without these flexible and elaborate features. [Emphasis added.]

Still, government officials like to avoid “sacrificing the good for the perfect.” Former Labor assistant secretary Borzi told RIJ this week that the rule might encourage more savings:

“I surely hope this may provide the nudge that some folks need. The most impressive bit of research we had when I was at the DOL was a study of TSP [Thrift Savings Plan] participants. Once the TSP put a simple illustration of what the participant’s current account balance would produce as a monthly income stream on each quarterly account statement, there was a very noticeable spike in contributions.

“[The numbers] they were sufficient to overcome my concern that a lifetime income stream illustration might in fact be discouraging to some participants, particularly those who were younger and/or with shorter work histories,” she added. “I was afraid that they would feel that their monthly benefit was so small that it was almost meaningless and that they would be more likely to put their money to other uses, other than making a contribution to the TSP. But that didn’t seem to be the case.”

© 2020 RIJ Publishing LLC. All rights reserved.

Fed Puts Yield Curve Control on the Shelf

The minutes of the July 2020 Federal Open Market Committee meeting were released today. They were somewhat disappointing as they walked back expectations that further policy action would soon arrive. The Fed is moving closer to concluding its policy review:

Participants agreed that, in light of fundamental changes in the economy over the past decade—including generally lower levels of interest rates and persistent disinflationary pressures in the United States and abroad—and given what has been learned during the monetary policy framework review, refining the statement could be helpful in increasing the transparency and accountability of monetary policy.

Such refinements could also facilitate well-informed decision-making by households and businesses, and, as a result, better position the Committee to meet its maximum-employment and price-stability objectives. Participants noted that the Statement on Longer-Run Goals and Monetary Policy Strategy serves as the foundation for the Committee’s policy actions and that it would be important to finalize all changes to the statement in the near future.

The “near future” is likely the September meeting. The most significant change to the Fed’s strategy is likely to be some flavor of an average inflation target whereby the Fed attempts to allow inflation to rise above 2% to compensate for periods of time below 2%.

This differs from the current strategy in which the Fed only attempts to return to the 2% target. The practical implication of this policy shift is that the Fed will keep policy easy for longer than was the case in the last recovery.

Although the Fed had an understandably dour outlook, they are not inclined to change the forward guidance just yet:

With regard to the outlook for monetary policy beyond this meeting, a number of participants noted that providing greater clarity regarding the likely path of the target range for the federal funds rate would be appropriate at some point.

This is somewhat surprising given the outlook for inflation and unemployment; the Fed would obviously like to accelerate the recovery. That said, it appears that they still have yet to decide what shape such guidance would take:

Concerning the possible form that revised policy communications might take, these participants commented on outcome-based forward guidance—under which the Committee would undertake to maintain the current target range for the federal funds rate at least until one or more specified economic outcomes was achieved—and also touched on calendar-based forward guidance—under which the current target range would be maintained at least until a particular calendar date.

In the context of outcome-based forward guidance, various participants mentioned using thresholds calibrated to inflation outcomes, unemployment rate outcomes, or combinations of the two, as well as combinations with calendar-based guidance.

It may have been too much to expect the Fed to both change its policy strategy and its forward guidance at the same meeting. This extension was interesting:

In addition, many participants commented that it might become appropriate to frame communications regarding the Committee’s ongoing asset purchases more in terms of their role in fostering accommodative financial conditions and supporting economic recovery.

As if it was a surprise that asset purchases had already evolved past their initial rationale as supportive of market functioning. In the press conference that followed the July meeting, Federal Reserve Chair Jerome Powell said as much:

“We understand, accept, and are fine with the fact that those purchases are also fostering a more accommodative stance of monetary policy, which would tend to support macroeconomic outcomes. So it’s doing both… The programs are not structured exactly like the QE programs were in the aftermath of the last financial crisis. Those were more focused on buying longer-run securities. The current purchases are all across the maturity spectrum. Nonetheless, they are supporting accommodative financial conditions. I think it’s clear that that’s the case.”

Look for the Fed to make more explicit what Powell has already said. Also watch for the possibility that it shifts the mix of assets toward to the longer end of the curve to prove that asset purchases are more like QE than only to support market functioning.

The Fed threw cold water on the notion of yield curve control for now:

A majority of participants commented on yield caps and targets—approaches that cap or target interest rates along the yield curve—as a monetary policy tool. Of those participants who discussed this option, most judged that yield caps and targets would likely provide only modest benefits in the current environment, as the Committee’s forward guidance regarding the path of the federal funds rate already appeared highly credible and longer-term interest rates were already low.

I have argued that yield curve control was on its way at some point after the Fed embraces enhanced forward guidance. Since they have yet to make the guidance move, they weren’t going to make the yield curve control move.

That said, at this point the Fed believes that such guidance alone would be sufficient to lock down interest rates. Yield curve control would be redundant in such a world. The implication is the yield curve control would only come into play if the Fed believed that forward guidance was unable to hold interest rates in the desired range.

Bottom Line: The Fed remains focused on downside risks but as of yet is unwilling to act further to support the recovery. Maybe they won’t need to.

© 2020 Tim Duy.

A Different Way to Think about the Inflation Rate

Inflation jumped higher in July as core-CPI rose 0.6%, well in excess of Wall Street’s expectation of a 0.2% gain. This surprise gain can be attributed to a pricing rebound compared to the negative prints earlier this year and a response to temporary supply constrictions.

It certainly does not by itself indicate the U.S. economy is poised for a 70’s-style Great Inflation. That said, it opens up the possibility that disinflationary forces are less severe than initially perceived at a time the Fed has embraced the fight against disinflation.

The pop in core-CPI was as impressive as the earlier collapse:

The gains were fairly broad-based. Among the major categories, only food and piped gas services posted negative month-over-month numbers. Core goods gained sharply, as did services less rent. Even shelter has firmed in the last three months.

The conventional wisdom is that this is nothing more than a short-term bounce from earlier weakness and temporary supply constraints. My fellow Bloomberg columnist, Coner Sen, says:

Pandemic-related supply and demand dynamics are distorting price signals in the short term. While we might get hot inflation prints for a few months, we should expect them to get back to normal as production does the same.

Sen does not expect the numbers to become the inflation of a failed state, and rightly so. To get interesting inflation like that, you need to see wage inflation of a similar magnitude. We just aren’t anywhere that point; that’s a whole different dynamic.

Instead of sustained high inflation, Sen says we return to “normal.” What exactly is “normal”? This question has me thinking that the underlying inflation forces are stickier than the Fed perceives them to be. Indeed, survey-based inflation expectations have actually formed in recent months:

And recall that former Federal Reserve Governor Daniel Tarullo questioned the strength of our understanding about inflation:

“The substantive point is that we do not, at present, have a theory of inflation dynamics that works sufficiently well to be of use for the business of real-time monetary policy-making,” he wrote.

When Tarullo wrote this, he was doing so at a point in time when we were trying to explain why inflation was not rising as fast as we anticipated. The logic works both ways. We could run into a period of time when inflation does not fall as much as anticipated.

Or, to put it in a different way: In February we all came to the conclusion that the Phillips curve was dead and could not be a useful guide to inflation. Now, just a few months later, we are all using Phillips curve logic to confidently predict that disinflation is a major threat.

But if the Phillips Curve is at:

Then, just as we shouldn’t conclude that low unemployment will drive substantially higher inflation, we also shouldn’t conclude that high unemployment will drive substantially lower inflation.

So the way of thinking about inflation is not to look at the extremes, but to think of it as sticky at 2% or a notch below. That’s enough to keep the Fed focused on the possibility of disinflation even if that possibility is less of a risk than we like to believe given the unemployment rate.

The Fed has said absolutely, for sure, don’t even ask, that they aren’t thinking about thinking about thinking about raising interest rates anytime soon. Instead, all of the Fed’s energy is currently directed at looking for ways (like yield curve control) to boost the effectiveness of monetary policy and pushing for more fiscal stimulus. They can’t raise interest rates because they have basically committed to not offsetting that stimulus.

If you have inflation sticky near 2% and a Fed that is dead set to holding rates at zero for as far as the eye can see, you are looking at a sustained period of real interest rates at nearly -2%. That should be friendly for real assets, especially if you get another blast of fiscal stimulus right before a Covid-19 vaccine hits the market.

Bottom Line: The inflation numbers aren’t telling us hyperinflation is on the way, but at the same time maybe the negative inflation earlier this year might not have been signaling deflation. Maybe the reality is much more boring and inflation is stuck in its recent range. Even that has implications, though, when the central bank remains positioned to fight disinflation.

© 2020 Tim Duy. Used by permission.

Jackson National Life to go independent

Jackson National Life Insurance Co., the dominant retailer of variable annuities in the U.S., will completely separate from Prudential plc, its Asia-based parent starting next year, the Lansing, Michigan-based insurer announced this week.

“The U.S. listing is planned for the first half of 2021, and Jackson does not currently expect to remit any regular dividends to Prudential plc in 2020 or 2021 prior to an IPO,” the Jackson release said. Last March, Jackson announced that it would separate partly from Prudential plc. This week’s announcement revealed that a complete separation is commencing.

On June 18, 2020, Jackson announced an agreement with Athene Holding Ltd. (Athene) (NYSE: ATH) to fully reinsure $27.6 billion of the company’s in-force book of fixed and fixed index annuity liabilities.

Athene agreed to pay Jackson $1.2 billion in ceding commission from Athene (effective June 1, 2020) and to pay $500 million for an 11% equity stake in Jackson. Jackson CEO Michael Falcon said the recent Athene agreement strengthens Jackson’s capital position.

For the first half of 2020, Jackson reported $1.3 billion in IFRS (International Financial Reporting Standards) pre-tax operating income during the first half of 2020. Jackson also reported $9.8 billion in sales and deposits.

IFRS pre-tax operating income is based on longer-term investment returns. It excludes short-term fluctuations in investment returns, hedge results and change in value of derivatives.

Overall, the company reported an IFRS net loss of $8.5 million and a GAAP (Generally Accepted Accounting Principles) loss of $18.9 million for the first half of 2020.

Jackson’s net loss was impacted by hedging losses ($2.265 billion, net of amortization of deferred acquisition costs) incurred due to movements in interest rates and equity markets, which were not fully offset by the release of accounting reserves.

IFRS accounting for variable annuity liabilities is not necessarily consistent with the economic value of these liabilities. Jackson continues to manage its hedge program on an economic basis and is willing to accept the accounting volatility that results.

Jackson has $294.6 billion in total IFRS assets and $265.4 billion in IFRS policy liabilities set aside to pay primarily future policyowner benefits (as of June 30, 2020).

© 2020 RIJ Publishing LLC. All rights reserved.

Another Objection to DOL’s ESG Proposal

The Department of Labor (“DOL”) is poised to significantly change its rules on how ERISA plan fiduciaries should evaluate investment opportunities. The employee benefit plan community, including the Wagner Law Group, responded to the DOL’s proposed amended rule by raising concerns that it could fundamentally affect how plan fiduciaries are expected to make investment decisions.

We pointed out that it would establish new and inconsistent standards for fiduciary consideration of environmental, social and corporate governance factors (“ESG Factors”). You can read The Wagner Law Group’s Comment Letter here.

As explained in the preamble, the Proposed Rule, published in the Federal Register on June 30, 2020, would amend the DOL’s longstanding regulation titled “Investment duties,” 29 C.F.R. §2550.404a-1, to address the emergence of ESG investment funds and the DOL’s stated concern that plan fiduciaries might be improperly considering ESG Factors in making investment decisions.

The DOL recognized that over the years its advice on fiduciary consideration of incidental or secondary effects of investments has varied; the DOL proposed sweeping changes to its regulation on investment duties to “provide clarity and certainty regarding the scope of fiduciary duties surrounding non-pecuniary issues.”

The proposed rule, however, goes beyond its stated objectives to affect how fiduciaries make all investment decisions. As explained in our Comment Letter, the proposal starts by stating that fiduciaries may only consider pecuniary factors in evaluating investment options, and then defines “pecuniary factors” narrowly, thereby excluding from consideration any factor that does not fit into the definition.

This new definition of “pecuniary factor” and the DOL’s new position that fiduciary investment decisions can only be based on defined “pecuniary factors” would be impractical in application and would be a significant departure from current law and guidance which requires fiduciaries to act solely in the interests of a plan and its participants in considering the totality of relevant circumstances.

In addition, the Proposed Rule would require fiduciaries to consider “available alternative investments” in making investment decisions, without guidance as to what this would mean, and without recognizing that the best practice of comparing investment alternatives is not universally applicable to all circumstances.

As explained in our Comment Letter, we are concerned that this standard would inject uncertainty and add additional layers of analysis to investment decision-making without necessarily improving the process or the results.

The Proposed Rule does not define ESG Factors. Nonetheless, it crafts new standards treating ESG Factors as inherently non-pecuniary, and thus unacceptable considerations, unless strict higher standards are met to demonstrate pecuniary characteristics. The proposal further creates inconsistent standards for fiduciaries considering ESG Factors in selecting investment options for self-directed individual account retirement plans.

On a parallel front, the DOL has initiated investigations around the country into employee benefit plan investments that include ESG components, seeking extensive documents and information about both investment funds and the investing employee benefit plans. This development has also caused concern. It is rare, if not unprecedented, for the DOL to engage in a national enforcement effort targeting only investments with specific characteristics while there is a pending proposed regulation on the same topic, especially a proposal that changes the existing DOL guidance on the subject.

Whether or not the DOL successfully implements the Proposed Rule, the DOL’s simultaneous investigative efforts in this arena, coupled with the Proposed Rule’s shortened 30-day comment period, signal that the DOL has honed in on exploring the influence of ESG Factors in retirement plan investing.

The Wagner Law Group submitted its Comment Letter to express our concern that adopting the Proposed Rule would make it more difficult for our clients to understand how they are expected to comply with their investment fiduciary duties.

© 2020 Wagner Law Group.

Life Insurers’ Bermuda Triangle, Part II

Over the past 10 years, a new and vigorous business model has gone viral in much of the once-stodgy life insurance and annuity industry. The model encompasses three types of enterprises, all owned, in many cases, by the same financial services company, private equity firm, or holding company.

The academics, regulators, and consultants who have studied the development of this business model have a new name for it: a “liability origination” platform or “private debt origination” platform. “Liability origination” refers to the art of lending profitably to below-investment grade borrowers without getting burned.

“Asset managers, particularly private equity (PE) firms, are using the new triangular organizational structure to scale up their private debt businesses,” said a recent report by three Federal Reserve economists.

“These institutions create their organizations by acquiring a suitable existing life insurance company and then establishing an offshore captive reinsurer… Starting from virtually nothing in 2008, PE firms now control roughly 8% of U.S. life insurance industry general account assets, equivalent to more than $350 billion.”

Recent news about deal-making in the life insurance industry offers examples of this trend, though usually with little context: Voya’s sale of annuity blocks to a reinsurer, KKR’s intended acquisition of Global Atlantic Financial, and the transfer of $27.4 billion in fixed annuity assets from Jackson National to Athene. MetLife’s decision to spin off its annuity businesses as Brighthouse Financial, and Prudential Global Investment Management’s pursuit of defined benefit pension assets in the U.S. and U.K., are part of this trend as well.

In this article, the third in a series, we’ll try to describe the complex liability origination platform model. The forces driving its development—the Federal Reserve’s low interest rate policy and a decline in lending by banks to high-risk corporate borrowers—are a topic for another day. Here we’ll focus on the new model, and how it turns baby boomer savings into fuel for complex loans.

Three-part engine

The three most essential components of liability origination, usually under a single corporate umbrella, are:

  • One (or a group of) life insurance subsidiaries that acquire money by selling fixed annuities and fixed indexed annuities (FIAs), buying blocks of existing fixed annuity assets and liabilities; pursuing “pension risk transfer” deals; or borrowing funds from capital markets using unconventional debt-like instruments
  • An asset manager that, more so than a conventional life insurer investment department, knows how to originate and/or buy risky corporate loans and commercial mortgages, and bundle them into asset-backed securities, which are subsequently held by their affiliated life insurers
  • A Bermuda-based “reinsurer,” typically owned by the same holding company as the life insurers and asset manager, that allows for capital arbitrage between regulatory jurisdictions; life insurers can transfer (reinsure) blocks of fixed annuity business and reduce the amount of capital required to back the liabilities

Last February, two research reports on this model appeared. In “Capturing the Illiquidity Premium,” three analysts at the Federal Reserve Board in Washington, DC wrote:

A large number of life insurers and corporations are discarding blocks of capital-intensive long-term liabilities, such as annuities and defined benefit plans, as they struggle to find long-term assets with yields high enough to fund those liabilities. Some of the largest U.S. life insurers and private equity firms are exploiting the dislocation in the annuity markets.

These institutions redeploy the relatively stable source of long-term annuity capital to capture the illiquidity premium created by banks exiting corporate lending. Within ten years, the U.S. life insurance industry has grown into one of the largest private debt investor in the world.

In a separate report, “Liability Platform Developments,” Scott Hawkins, the insurance research director at Conning, wrote:

Since their emergence in the early 2000s, specialist insurers and reinsurers have been formed that focus on acquiring and managing insurance liabilities. By the end of 2019, there were 32 liability platforms domiciled in Bermuda, the Cayman Islands, the EU, and the United States, with the majority of the formations occurring in 2014 and later.

These platforms [fall] into two broad categories. Liability consolidation platforms, such as Monument Re, Somerset Re, or Viridium, acquire closed blocks of business from insurers who off-loaded these liabilities as they focus on their core business. These acquisitions can be through reinsurance, traditional Mergers & Acquisitions, or Part VII transfers. Liability origination platforms, such as Athene and F&G, go beyond liability consolidation and create new liabilities by selling new business.

In some cases, such as AIG and its formation of Fortitude Re, it was the desire to spin out closed blocks of business [in-force contracts] that led to the creation of a liability platform. For others, Athene being the most noticeable, the ability to have access to permanent capital led to its development of many new liability platforms. [The platforms] have focused on annuities because they have lower costs of capital than life insurance. Lower capital requirements enable investors to support more liabilities [i.e. loans], potentially generating higher profits as a result.

The humble indexed annuity

The key to these multi-billion dollar deals is, ironically, the humble individual retail fixed annuity—especially its popular variant, the fixed indexed annuity, or FIA. Simple fixed annuities are like certificates of deposit. FIAs are similar, but with a side-bet on the movement of an equity index. All offer tax-deferred growth with a guarantee against loss if held to maturity.

Fifteen years ago, FIAs were considered “Wild West” insurance products—sold by highly incentivized independent agents to older people who didn’t understand what they were buying. The pioneer, and still the top retailer, is Allianz Life. But, since the financial crisis, more insurers and distributors have built and distributed them. The assets backing in-force fixed annuities and FIAs are now worth close to $1 trillion, according to LIMRA Secure Retirement Institute.

Their stability makes them attractive sources of investable funds for private equity firms. Fixed annuities seek higher yields through longer holding periods. Purchasers invest for between three and 10 years. These “long-dated liabilities” give private equity firms and their affiliated life insurers a stable source of financing for long-term lending.

Most importantly, there’s virtually no risk that individual contract owners will suddenly want their money back until the end of the term. Athene, the most prominent private equity-owned life insurer after Allianz Life, has been the second biggest seller of FIAs in recent years.

“A life insurance company’s balance sheet is a savings mediation vehicle, and the company deploys that savings as credit into economy. Unlike a bank, a life insurer has stable long-term funding—not the short-term demands of a bank. When you have the advantage of long-time horizon, you can get creative in areas of lending where life insurers traditionally haven’t played,” Matt Armas, a portfolio manager at Goldman Sachs Asset Management, explained to RIJ in an interview.

CLOs encounters

If private equity firms find blocks of fixed annuity contracts so attractive, why do so many traditional life insurers want to get rid of theirs? The answer is falling interest rates. As rates go down, life insurers have difficulty earning enough on their new investments to cover the promises they made to fixed annuity purchasers when rates were higher.

Asset managers and private-equity firms like Guggenheim, Apollo, Goldman Sachs Asset Management, Blackstone and others were able to buy those contracts—which were tying up precious capital on the insurers’ balance sheets—at discounts. They believe they can invest the assets for higher returns than the original issuers could.

What’s their secret? A talent for “liability origination.” The asset managers at private equity-owned life insurers don’t simply buy highly rated corporate bonds off-the-rack. They buy lower-rated corporate bonds and, through the dark art of asset securitization, custom-tailor them into the relatively high-yield debt they and their customers (including their affiliated life insurers and private investors) want to own.

Among those securitizations are collateralized loan obligations or CLOs. In their latest incarnation, they are bundles of high-risk corporate loans divided (as all securitizations are) into tranches of varying risk. Owners of senior tranches get paid first, which means they’re most likely to get paid and that their tranches carry investment-grade ratings.

Senior tranches of CLOs pay higher returns than similarly rated loans. One reason for the premium, the authors of “Capturing the Illiquidity Premium” wrote, because of their illiquidity. It’s time-consuming to trade them, precisely because they are complicated, specialized and difficult for buyers to evaluate. This makes them riskier, and therefore higher yielding.

A recent white paper from Guggenheim, the global private equity firm that owns Delaware Life, defines CLOs as:

“…a type of structured credit. CLOs purchase a diverse pool of senior secured bank loans made to businesses that are rated below investment grade. The bulk of CLOs’ underlying collateral pool is comprised of first-lien senior-secured bank loans, which rank first in priority of payment in the borrower’s capital structure in the event of bankruptcy, ahead of unsecured debt. In addition to first lien bank loans, the underlying CLO portfolio may include a small allowance for second lien and unsecured debt.”

For life insurers looking for securitized debt to buy, CLOs have helped replace residential mortgage backed securities (RMBS), whose supply dropped after the 2008 financial crisis. According to the National Association of Insurance Commissioners (NAIC), “Collateralized Loan Obligations (CLOs) continue to be a growing asset class for U.S. insurers; exposure increased to about $158 billion at year-end 2019, having increased 17.5% from about $130 billion at year-end 2018.”

“The strategy is securitization, but the skill is in origination,” said Michael Siegel, a managing director at Goldman Sachs Asset Management, in an interview. “First, you’re cutting out the middleman. When I did private placement for traditional insurers, we had to look for investment-grade borrowers, focus on agent-led deals that were arranged by investment banks.”

Not to be left behind, however, large traditional life insurers have been buying or building their own sophisticated asset management teams. “The traditional life insurers are building out their infrastructures [for private debt origination], but the private equity firms were way ahead of them,” Siegel told RIJ.

Bermuda: Third leg of the triangle

The third and most mysterious aspect of the liability platforms involves captive offshore reinsurers. “Captive” means that the U.S. life insurer owns its own reinsurer. “Offshore” usually means that the reinsurer is domiciled in Bermuda, which uses a different accounting standard than the U.S. does.

U.S. life insurers can isolate blocks of fixed annuity assets and liabilities, move them to their own reinsurers in Bermuda, and get a credit—usually in the form of a line of credit from a bank—for the reduction in capital requirement. This credit “frees up,” for other asset purchases, part of the capital that, under U.S. statutory accounting rules, was dedicated to supporting the annuity guarantees.

Have the private equity companies’ ventures into the life insurance industry been healthy or not? The private equity people would say that they’ve done a lot of good by infusing capital into existing life insurers after the financial crisis, taking burdensome business off their books, and ensured that all of their policyholders get paid in full and on time.

“The private equity firms have brought about $30 billion in fresh capital into the life insurance industry, which was looking to transfer the risks of their older blocks of business. That’s a healthy evolution for the industry,” Goldman Sachs’ Armas told RIJ. (Goldman Sachs got into the insurance business as early as 2004, and eventually created Global Atlantic Financial Group in 2013, which owns a life insurer. KKR, the private equity firm, is in the process of buying Global Atlantic from Goldman Sachs.)

“One point about this new business model is that, with a growing number of retirees looking to save for retirement and turn accumulated assets into retirement income, the new capital from these players is increasing the ability of insurers to write more annuities,” said Conning’s Hawkins.

In “Capturing the Illiquidity Premium,” the authors expressed some concern about the risks embedded in the CLO tranches that life insurers are holding–which may include tranches of “combo notes.” These are CLOs built from the riskiest tranches of other CLOs.

“By holding the riskiest portions of the CLOs issued by their affiliates as well as a rapidly growing portfolio of commercial real estate loans, life insurers are vulnerable to a downturn in the credit cycle. For example, a widespread decline in the value of the loans backing the CLOs could directly wipe out the equity held by the affiliated life insurers,” they wrote.

The NAIC has issued several reports on CLOs, and has periodically assessed their riskiness in life insurer general account portfolios. “CLOs are a focus of regulatory concern, particularly as the underlying bank loans are experiencing negative rating actions as a result of the impact on certain industries from the economic disruption caused by COVID-19,” one recent report said.

But the NAIC concluded in the same report that “Since U.S. insurer exposure to CLOs is relatively small, at about 2% of total cash and invested assets as of year-end 2019, and the vast bulk of these investments are rated single A or above, we do not believe that the CLO asset class currently presents a risk to the industry as a whole.”

One life insurance industry stakeholder, who asked not to be identified by name, said that they and their peers are concerned about life insurers who own fixed annuity assets and liabilities and operate liability platforms but don’t sell annuities to the public and may have no incentive to serve their existing policyholders properly.

“Industry representatives are especially concerned about the run-off blocks of business, where the insurance company isn’t engaged in the current sale of insurance and doesn’t have the same concerns about reputation,” the source told RIJ. “That whole run-off area has been booming over last decade, and the PE companies are big players in it. Some are responsible; but their incentives are not as aligned with policyholder as someone writing business.”

© 2020 RIJ Publishing LLC. All rights reserved.
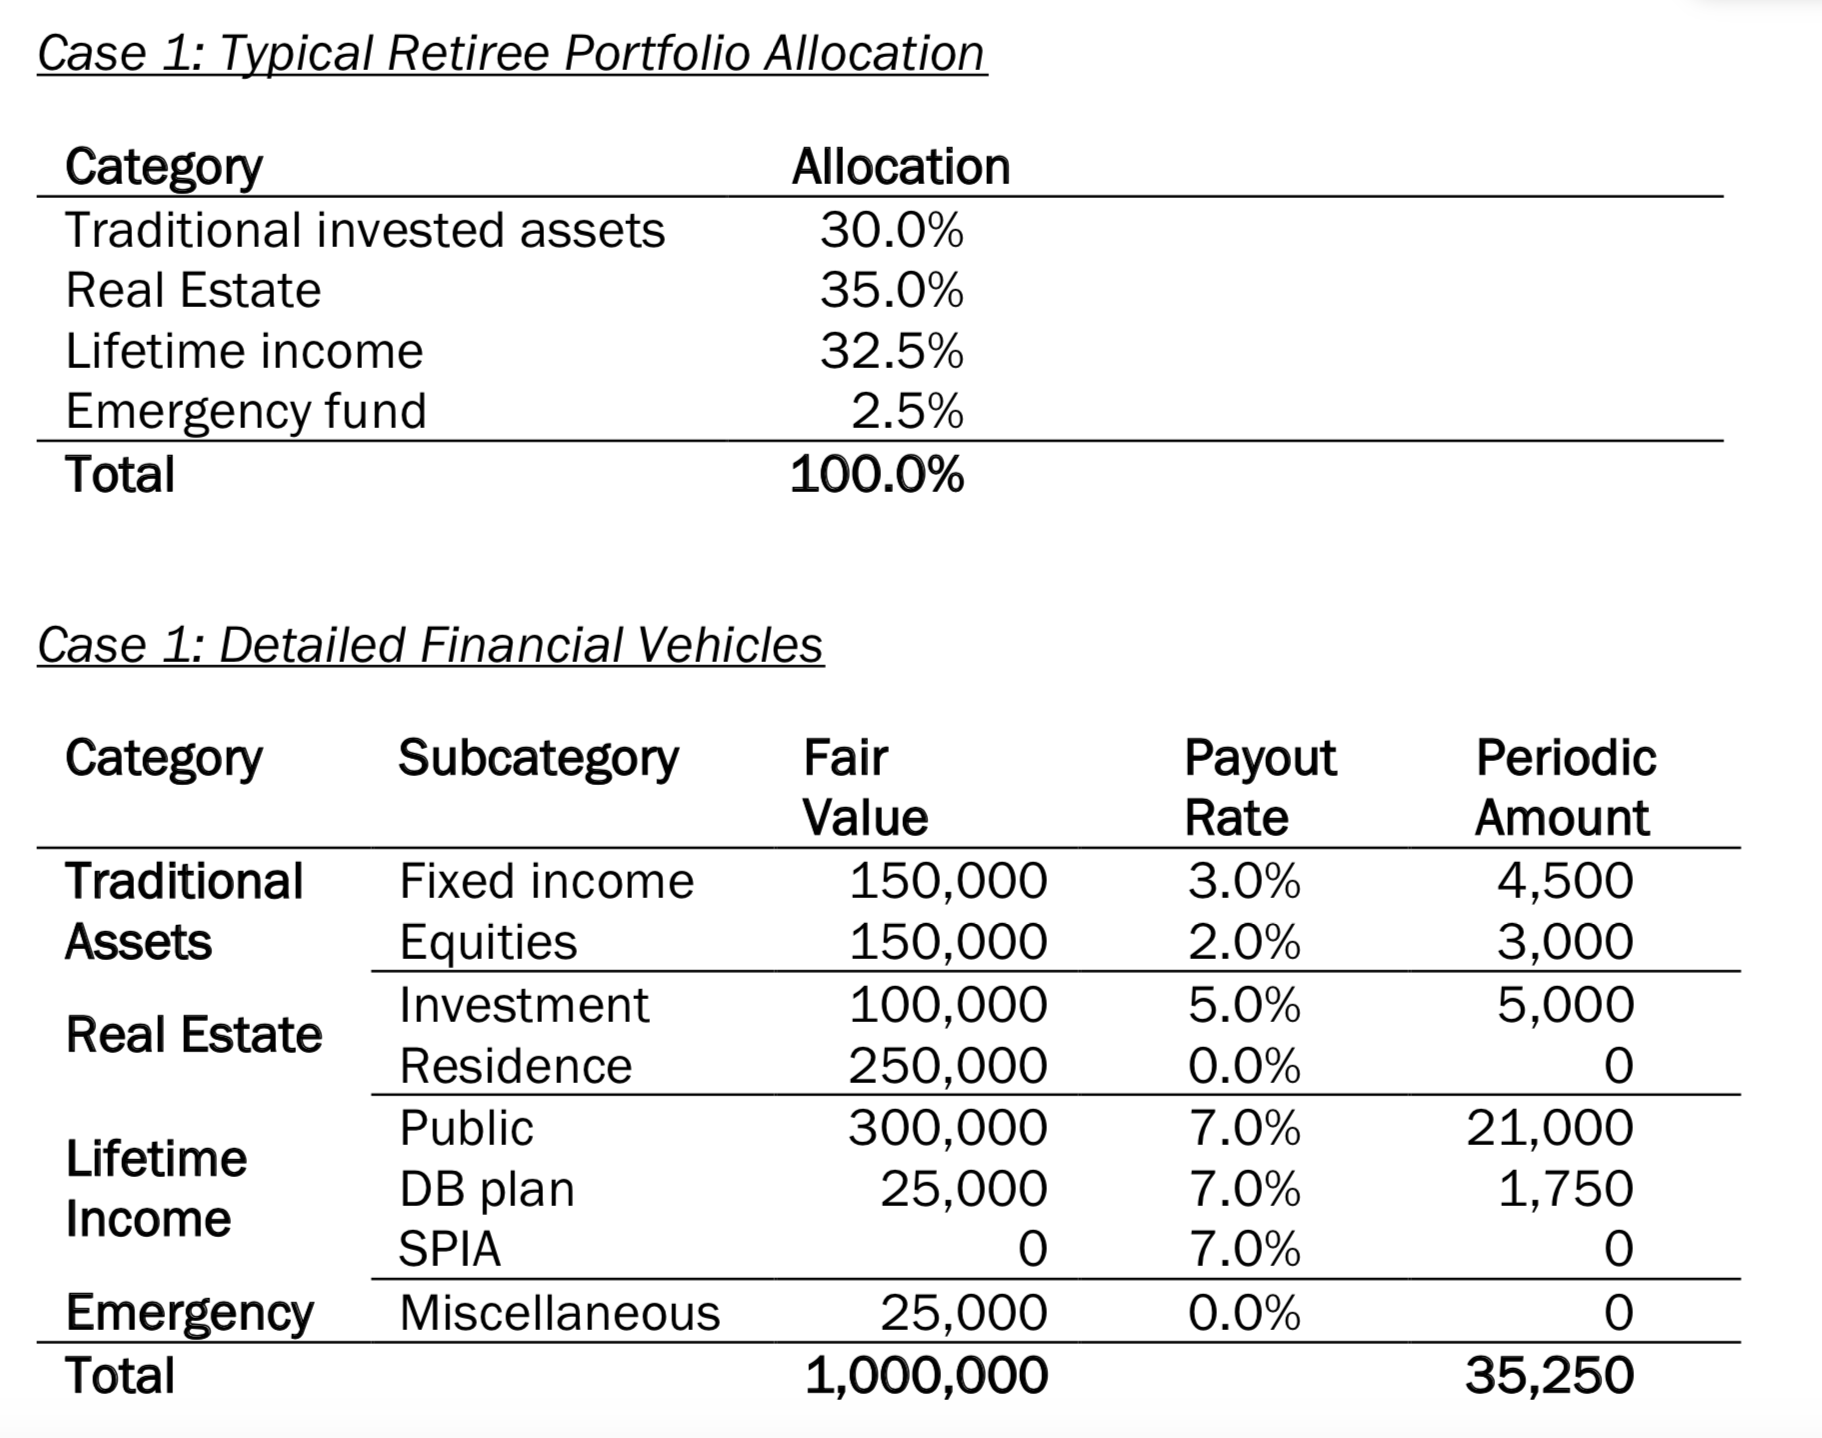


Honorable Mention

Innovator launches ladder of buffered ETFs

Innovator Capital Management, LLC launched the Innovator Laddered Fund of S&P 500 Power Buffer ETFs (BUFF) on Tuesday, August 11. An “ETF of ETFs,” BUFF will invest equally in each of Innovator’s 12 monthly S&P 500 Power Buffer ETFs and rebalance semi-annually.

The underlying S&P 500 Power Buffer ETFs each seek to provide a buffer against the first 15% of losses in the S&P 500 and upside performance to a cap over a one-year outcome period; they are part of Innovator’s suite of Defined Outcome ETFs.

BUFF will seek to offer investors a managed portfolio (an ETF of ETFs) that will invest equally across all twelve monthly S&P 500 Power Buffer ETFs, providing a ladder of buffered S&P 500 exposures. The twelve underlying buffered S&P 500 exposures each have a different upside cap level and period of time until their annual reset, but share a 15% buffer against losses in the S&P 500 Index over their outcome period.

“Innovator’s intention with BUFF is to offer an ETF that can provide investors a managed approach to buffered equity investing that maintains upside growth potential by continuously participating in new upside caps as the underlying ETFs reset monthly—and which can be allocated to at any point during the year,” an Innovator release said.

“BUFF will be rebalanced semi-annually, charge 20 basis points and seeks to provide investors with a simplified, efficient solution to buffered equity investing,” the release said. “It is anticipated the ETF will provide investors with lower volatility (standard deviation), beta and drawdowns relative to the S&P 500 while capturing a measure of the capital appreciation potential of U.S. domestic large-cap stocks, the largest equity market globally by capitalization and typically the most significant allocation in most diversified portfolios.”

As an ETF of ETFs, BUFF is designed to be bought and/or sold without regard for the outcome period associated with the underlying individual ETFs. The strategy, as measured by its index (the Refinitiv Laddered Power Buffer Strategy Index) seeks to provide lower volatility (standard deviation), beta and drawdowns relative to the S&P 500.

While BUFF will invest in Innovator Defined Outcome Buffer ETFs (in an equal weighted portfolio of all twelve monthly issues of the S&P 500 Power Buffer ETFs, which have a 15% buffer against loss in the S&P 500), the fund will not be a Defined Outcome product with an upside cap and downside buffer, nor an outcome period.

BUFF will seek investment results that correspond generally (before fees and expenses) to the price and yield of the Refinitiv Innovator Laddered Power Buffer Strategy Index.

BUFF will generally invest at least 80% of its net assets (including investment borrowings) in securities comprising this Index. The Index has been developed by and is maintained and sponsored by Refinitiv/Thomson Reuters.

As announced in May, to launch BUFF, Innovator will change its existing Innovator Lunt Low Vol/High Beta Tactical ETF (LVHB), including a change to the fund’s name, ticker symbol, underlying index, investment objective, management fee and strategy at that time.

In May 2020, the Board of Trustees of the Innovator ETFs Trust II approved a reduction in the annual unitary management fee paid by shareholders to Innovator Capital Management, LLC the Fund’s investment adviser, from 0.49% of the Fund’s average daily net assets to 0.20% of the Fund’s average daily net assets. In addition to the Fund’s own fees and expenses, the Fund will pay indirectly a proportional share of the fees and expenses of the underlying ETFs in which it invests, included advisory and administration fees.

Once effective, LVHB will trade its shares under the new ticker symbol “BUFF”.

Principal continues to integrate acquired Wells Fargo plans

Principal Financial Group this week announced progress toward the integrating the Wells Fargo Institutional Retirement & Trust (IRT) business with Principal’s existing retirement plan business, despite challenges posed by COVID-19 and related market disruptions. Principal’s July 2019 acquisition of IRT is on track for completion in 2021, the company said.

“The combined organization is already delivering new and enhanced capabilities to Principal and Wells Fargo IRT customers including a digital plan on-boarding experience, the patent-pending Principal Complete Pension Solution, the Principal Milestones financial wellness program,” a Principal release said.

The new, unified retirement leadership team includes executives from Wells Fargo IRT and Principal. The company has also said it would retain locations in Charlotte, N.C.; Minneapolis/Roseville, MN.; Waco, TX; Winston-Salem, N.C.; and Manila, Philippines.

Last month, Principal secured an office space in downtown Minneapolis for occupation in 2021. Additionally, many Wells Fargo IRT employees have received job offers to transition employment to Principal effective in 2021. Principal, now a top-three recordkeeper as a result of the acquisition, has also appointed a new sales leadership team, innovated its advisor and consultant service model, and expanded its sales force as a part of the company’s customer care experience.

Principal will start on-boarding new participants in October through its Principal Real Start auto-enrollment program. More than one-third of current Principal Real Start participants are saving 10% or more and one-in-three are auto-escalating their contributions up to 10%, Principal said.

Principal closed its acquisition of certain assets of the Wells Fargo Institutional Retirement and Trust business (IRT) on July 1, 2019. During the transition period, Wells Fargo Bank, N.A., a bank affiliate of Wells Fargo & Company, will continue to operate and service the IRT business for the benefit of Principal, including providing recordkeeping, trustee, and/or custody services.

Employees and employers see HSAs differently

A recent survey on perceptions of health savings accounts (HSAs) by Further, a national health savings administrator, found divergence between employers and employees on how best to use HSAs.

“Employers [are] positioning them as savings tools, while employees rely on them as spending tools,” Further said in a release this week. Among the survey findings:

Today, employees depend on employers to provide competitive benefits packages that meet their health care needs. In fact, 70% of consumers said comprehensive benefits are the most important factor, or a very important factor, when accepting a job.

Similarly, employers place high value on HSAs as an employee recruitment and retention tool, with 57% and 50%,2 respectively, citing these as key objectives for offering an HSA.

When asked how HSAs are primarily utilized—as a spending or saving tool—employees and employers disagree. 65% of consumers report leveraging their HSA as a spending resource, with 23% stating they use their account equally for saving and spending.

Yet, over 66% of employers associate HSAs with savings only,2 leaving a gap in how employers are positioning these accounts compared to how employees are leveraging them. “Employees and employers are not speaking the same language when it comes to health savings accounts,” said Matt Marek, CEO of Further, in the release.

Sixty percent of employees reported having a high confidence in how to fully leverage their HSAs. Comparatively, 75% of employers say that employees have a high understanding of their HSAs.

Yet, only 51% of consumers could correctly calculate how much they would have to pay for a hospital stay based on their deductible and copay, suggesting that both employees and employers may have a false level of confidence when it comes to leveraging HSA benefits, Further reported.

Variable annuities can shine in times like these: Cerulli

The COVID-19 pandemic, converging with sudden economic uncertainty and global market volatility, present annuity providers with an opportunity to publicize the values of their products’ guarantees, according to a new report from Cerulli Associates.

“While advisors have increasingly shied away from using annuities in their client portfolios over the last decade, current market volatility is prompting them to take a second look,” according to the latest edition of Cerulli Edge—U.S. Asset and Wealth Management Edition.

“Framing annuities as a type of pension or Social Security payout (e.g., defined benefit) could be an effective tactic to explain their attributes to clients,” said Donnie Ethier, director of wealth management at Cerulli, in a release this week. “A pension/guaranteed payout is likely to be attractive to specific types of clients, such as small business owners,” the release said.

Derisking portfolios—a strategy many advisors have undertaken since 2018 to mitigate portfolio risk in response to drastic fluctuations in the equity markets—may accelerate variable annuity (VA) interest from advisors in the wake of the pandemic, Ethier said.

“Insurers are working to build in ‘risk levers’ that will enable the adjustment of benefit elements on the fly, to either enhance them or derisk, as conditions may dictate.” These “risk levers” associated with VAs are a selling point for many advisors, some of whom report to Cerulli that they can adequately explain incorporating a VA to a client by positioning it as downside protection.

The challenge for insurers is whether they can sufficiently address the chief reasons cited by advisors for not using VAs—perception of high fees (79%) and a belief that other retirement income strategies constructed by their advisory practice or their home office are more efficient (37%).

However, affluent households surveyed by Cerulli’s Retail Investor practice indicate they will likely seek guaranteed payouts and portfolio diversification in this time of market turbulence, and many annuity designs can provide these benefits.

© 2020 RIJ Publishing LLC. All rights reserved.

Markets ‘unnervingly detached from economics’: CFAs

Thousands of Chartered Financial Analysts (CFAs) are calling for careful oversight of the trillions of dollars worth of stimulus money appropriated by Congress through the CARES Act that was passed in March, the CFA Institute said this week.

The institute surveyed about 8,000 of its members in July. Nearly 90% of respondents said they expect to see details on the recipient, the amount, and the terms of the distribution. “We increasingly hear the frustration that securities markets and financial analysis have become unnervingly detached from economics,” CFA Institute said in a release.

CFAs “are particularly interested in full transparency on whether any affiliate of Congress or executive branch received funding,” said a CFA Institute release. The majority of members said they approved of the stimulus while also saying that it should not be unlimited.

“The amounts, parameters, and rapid roll out of this unparalleled and open-ended stimulus have raised concerns,” the release said. “The functioning of oversight committees and transparency around the various programs that ultimately will distribute record amounts of taxpayer-funded stimulus need scrutiny. Similarly, long-term concerns surround the resulting budget deficits and the impact on capital markets.”

On 27 March 2020, the US government enacted the Coronavirus Aid, Relief, and Economic Security (CARES) Act, embarking on a multi-trillion dollar program of monetary and fiscal stimulus in response to the COVID-19-induced economic shutdown. “The level of stimulus has been broad; the program parameters were put together at warp speed; and, even as negotiations over the fourth round of stimulus continue, it is generally expected that further steps and programs may be required as the extent and duration of the pandemic impacts become more predictable,” the institute release said.

The survey was fielded to all active employed CFA Institute members residing in the United States. The survey was sent on 10 July 2020, with two reminders. The survey closed 20 July 2020. Out of the members invited to participate, 8,036 provided usable data, for a total response rate of 11 percent. Margin of error was +/- 1.03%.

© 2020 RIJ Publishing LLC.

Why Life Insurers Fly into the ‘Bermuda Triangle’

Yesterday’s second quarter earnings conference call with senior executives of Athene Holding offered a window into the most significant trend in the life insurance industry over the past five years: the development of an asset management model that feeds on blocks of fixed annuity contracts.

Athene, financed by the private-equity (PE) firm Apollo Operating Group (Apollo), helped pioneer a trend that started after the Great Financial Crisis. The trend has been tantamount to turning what we knew as the “life insurance” industry into something new: the “liability origination platform” business, as a recent study by Conning described it.

In short, private equity firms are buying (mostly) fixed annuity assets from large life insurers and, by using offshore captive reinsurers, freeing up capital that they can redeploy into riskier, higher-yielding assets like collateralized loan obligations (CLOs) and commercial real estate-backed securities assets (CMBS).

The trend was trailblazed by Athene, which was created in 2013 when Apollo bought Aviva Life (assets of $56 billion) and renamed it. In 2016, Athene went public in a $1.08 billion IPO. In 2018 it added annuity assets from Voya and Lincoln Financial. This year it acquired, via a reinsurance deal, $26 billion worth of Jackson National Life fixed-rate and fixed index annuities (FIAs).

“Major life insurance groups continue to reduce their exposure to legacy in-force business and to release trapped capital and resources,” said the chairman of Resolution Re last December, when he announced his firm’s still-pending acquisition-and-reinsurance deal with Voya Financial, including the transfer of assets worth an estimated $20 billion.

The price of Athene’s stock, like the share prices of other life insurers, has not recovered as well as the overall market from the COVID19-related equity crash in March. But on yesterday’s earnings call, the Athene executives were ebullient. Athene has grown rapidly, and the executives see the potential to sell a lot more FIAs to baby boomers and the opportunity to buy many more underperforming blocks of fixed annuity business.

How much business is out there? Almost a trillion dollars’ worth. According to Todd Giesing, director of annuity research at LIMRA’s Secure Retirement Institute, in-force fixed-rate annuities have a current value of $450 million. In-force fixed indexed annuities have a current value of $505 billion. (Variable annuity assets have a current market value of $1.94 trillion, but those assets are in separate accounts and contract owners can liquidate them with relative ease; fixed annuity assets are in the insurer’s general account and are less subject to withdrawal.)

Long-dated liabilities in demand

Since 2014, according to a report this year by the consulting firm Conning, over two dozen “liability origination” or “liability consolidation” companies have been formed in the U.S. or abroad to create, acquire or reinsure blocks of fixed annuity business and “redeploy” the capital more profitably.

“We’ve been following these companies—Athene, Global Atlantic, FGL—since 2013 or 2014. We’re also following the newer companies with the same business model. Since 2015, about 30 new companies with this model have come into being. We refer to it as a liability platform,” Conning’s insurance research director Scott Hawkins told RIJ recently. [Note: The private equity firm KKR is in the process of buying Global Atlantic.]

“They’re looking to accumulate annuity or pension liabilities, because they are a form of permanent capital. That’s desirable for those owners; the money will stay with them for a long period, they can invest in asset classes without an investor suddenly deciding to redeem. They can enjoy a longer time horizon, because the liabilities are longer.” In the case of FIAs, investors may not withdraw their money for as long as 10 years.

“Yes, there has been ‘some’ reconfiguration in the industry over the past six to eight years, with private equity/asset management groups acquiring annuity insurers,” said David Paul of ALIRT, which tracks life insurance companies, in an interview. “Athene/Apollo would likely be ‘Exhibit A,’ but they aren’t the only one. To speak of it as ‘a’ reconfiguration of the life industry overstates their influence.

“These asset managers feel that they have an investment edge, in part through the acquisition of private debt or CLOs, and they believe can make better spreads than traditional insurance investment shops, thereby offering more attractive rates and/or achieving better profitability. Some have also leveraged offshore reinsurance operations for tax and capital arbitrage.”

Pros and cons of PE-led insurance

What does it mean for the investors—the baby boomers who rely on annuities for safe accumulation or guaranteed retirement income? That’s a complicated question with no definitive answer, at least not yet.

On the plus side, life insurance companies have received fresh infusions of cash. The private equity (PE) firms talk about the tens of billions of capital they have poured into “primary” life insurance companies—relieving them of books of business that they couldn’t profitably support. Indeed, in today’s earnings call, Athene CEO James Belardi called Athene a “solution provider” for other firms.

The private equity companies also talk about their ability to pass on their greater efficiency and profitability to the older Americans who own FIAs. In response to a question from one stock analyst today, Belardi said Athene’s FIAs offer participation rates that are about “10 basis points higher” than the competition.

He also attributed Athene’s 40% increase in sales in the first half of 2020—at a time when the rest of the annuity industry slumped—to Athene’s use of “bespoke indexes.” These are custom or hybrid indices created by investment banks. The vast majority of FIA assets industry-wide is in the S&P 500 Index, but only “about half of our in-force business is in the S&P 500,” Belardi said. Athene has also had success in 2020, he said, “because our competitors have pulled back.”

The PE-led firms are also providing solutions to large corporations that want to sell their defined benefit pension plans—and all the longevity risk that attaches to them–to a life insurance company, which will convert the group annuity to individual annuities. “Pension risk transfers,” a business in which Prudential Global Investment Management (PGIM) has been the leader, is another way that life insurers can obtain large blocks of money. Like FIA assets, those assets are withdrawn by retirees at a slow or predictable pace, making them ideal for funding riskier investments. The life insurer thus provides a solution to corporations by relieving them of hard-to-quantify longevity risk; the corporations don’t know how long their pensioners will live.

CLOs encounters

But some observers are wary of the wave of acquisitions of life insurers by private equity firms, and have worried about this trend since it started a decade ago. The retired Indiana University insurance professor Joseph M. Belth, for instance, warned about the risk that policyholders might suffer service lapses under the issuers’ new owners, who may have chosen not to sell new annuities or life insurance policies at all.

“Problems are to be expected when private equity firms create or acquire long-term obligations of insurance companies in an effort to earn short-term profits for the benefit of their investors,” Belth wrote on his blog two years ago, after Athene agreed to pay a $15 million fine for neglecting important services to policyholders.

Others are concerned about the safety of the assets that the PE-led firms are investing in, such as CLOs. These are the securitized bundles of loans to corporations with below investment-grade credit ratings. (The National Association of Insurance Commissioners issued a report on CLOs recently.)

After the Great Financial Crisis, banks greatly reduced that type of lending. Life insurers and their affiliate asset managers stepped in to satisfy the demand for credit from corporations already burdened by debt. Like other securitized investments, CLOs are divided into tranches. The uppermost tranche is held out to be as safe as a Treasury bond; the bottom tranche is as risky as a stock.

Life insurers typically buy the highest or second highest tranches, where they can earn higher yields than on similarly low-risk assets. CLOs comprise about 9% of Athene’s investments, Belardi said, adding that the “diversified pools of senior secured loans generated returns about 100 basis points (one percentage point) higher than comparably risky corporate bonds.

“While CLOs have volatility,” he said, “we will hold them to maturity. There’s been no principal impairment in CLOs. There have been downgrades but no defaults.” Regarding the economy, he said, “We’re not out of the woods yet.” He sees potential weakness in loans to airlines and fleet leasing companies, and strength in real estate. “We’ll be a player in commercial real estate-backed and residential real estate backed securities. We expect people to stay in their homes” despite high unemployment.

The Bermuda triangle

The use of captive (i.e., owned by the same parent as the life insurer) offshore reinsurers, many of them based in Bermuda, also troubles some observers. Bermuda uses a different accounting standard (GAAP), which doesn’t require reinsurers to hold as much reserve capital as U.S. (statutory) accounting rules do. A U.S. life insurer can create its own reinsurance company in Bermuda and then can move a block of annuity business (“reinsure” it) to that new company. This act alone frees up capital, which the life insurer can use for other purposes.

“By having a Bermuda-based reinsurer, some companies are doing indirectly what they couldn’t do if the assets and liabilities stayed with the original domestic issuer: Get a credit for having reinsurance and take hard assets out,” said Larry Rybka, CEO of Valmark Financial Group, which helps advisors monitor the products they sell.

As blocks of annuity assets and liabilities accumulate (for accounting purposes) in Bermuda, the liabilities might not be sufficiently capitalized, Rybka said. He thinks there’s a danger that, behind a complex screen of transactions between closely affiliated companies—the life insurer, asset manager, and reinsurer are frequently all part of the same publicly held or private equity company—life insurers might have an incentive to capture profits for their shareholders at the expense of their policyholders.

Rybka points to a warning expressed by Federal Reserve researchers Nathan Foley-Fisher, Nathan Heinrich and Stephane Verani in a February 2020 paper: “A widespread default or downgrade of risky corporate debt could force life insurers to assume balance sheet losses of their CLO-issuing affiliates, wiping out their equity. In a worst-case scenario, the perception of balance sheet weakness could incite liquidity-sensitive institutional investors to withdraw from those life insurers.”

Not everyone agrees with all the specifics of Rybka’s view, which reflects the complexities involved. The motive for using offshore reinsurers “seems largely to be tax relief, and not regulatory arbitrage,” said Dan Hausmann, one of ALIRT’s founders. “There may be some differences in investment requirements, but any material transaction a company does would require approval from the states they do business in then. People can’t just say, ‘Let’s move $5 billion to Bermuda.’ Domestic insurers in most cases keep legal control of policy liabilities and the assets in support of those liabilities.”

So what implication does this trend—now a decade old and evidently accelerating—have for the “retirement income” industry and its stakeholders? We’ll address that broad question in future articles. But there’s no question that we’re seeing the further evolution of life insurers into asset managers.

“The larger life insurers are gradually becoming more and more asset management focused, rather than protection focused. Some will stay on life insurance, but you hear more and more of them say, ‘We’re about managing assets,’” Conning’s Hawkins said. “The large players are becoming asset managers. That’s a trend that I’ve certainly seen over my 35 years in the business.”

© 2020 RIJ Publishing LLC. All rights reserved.