Alternatively, click here to watch the video.


IssueM Articles
Alternatively, click here to watch the video.

Here is a trick learned from many years in the backcountry: When you lose your trail, stop and backtrack to the last place you know where you were. Then start over. In this case, the starting point is the Fed guidance that operationalizes the update strategy:
“The Committee decided to keep the target range for the federal funds rate at 0 to 0.25% and expects it will be appropriate to maintain this target range until labor market conditions have reached levels consistent with the Committee’s assessments of maximum employment and inflation has risen to 2% and is on track to moderately exceed 2% for some time.”
There are three conditions for a rate hike: Maximum employment, inflation at 2%, and the expectation that inflation will exceed 2% for some an undefined period. There is a lot of guidance there, but a lot that is left unsaid.
We don’t know what [level of] inflation would be “moderately” in excess of 2%. We don’t know how long the Fed expects inflation to exceed 2%. We don’t know even what the Fed will eventually conclude is maximum employment, even if we believe that it is somewhere below 4% unemployment.
It’s not just that we don’t know these details. FOMC participants don’t know these details.
They have different views of the appropriate interpretation of the guidance. Chicago Federal Reserve President Charles Evans, for example, admits that his willingness to tolerate 2.5% [inflation] is a minority view of the implementation. They also have different views of when these conditions will be met. Boston Federal Reserve President Eric Rosengren acknowledges that he is particularly pessimistic, saying we would be lucky to reach 2% inflation in four years.
All of that is interesting but really only an intellectual exercise. They are false trails. The Fed doesn’t believe it needs to lock down any details on an “exit strategy” because the forecasts of FOMC participants indicate that rates will remain at near-zero levels through at least 2023. And that is assuming we get the additional fiscal stimulus that they are pleading for.
Vice Chair Richard Clarida tried to clarify the Fed’s position, telling Bloomberg that the Fed would need to see months of observed inflation at 2% before the Fed would even think about raising interest rates. I would pay attention to Clarida and not get tied up in the forecasts of Fed presidents.
Take the FOMC statement at face value; it’s where you go back to when you are lost. The rate story doesn’t get interesting until inflation is 2% on a year-over-year basis and looks to be sustainable for an extended period. I have said this before, but it is worth repeating: The risk is not that the Fed decides to hike rates before inflation hits 2%, the risk is that the economy surprises on the upside and brings that outcome sooner than anticipated.
In hindsight, I guess we should have all seen this confusion coming. Federal Reserve Chair Powell had said that the Fed isn’t even thinking about thinking about thinking about raising interest rates. The updated forward guidance gives guidelines about the timing of a rate hike, so they must be thinking of when to raise rates. The Fed thus inadvertently changed the focus of the conversation.
Changing the focus of the conversation toward rate hike is one communications problem. They still have another problem. They left open the question of the pace of asset purchases. Presumably, they could reduce the pace of asset purchases before inflation hits 2%.
Moreover, the Fed made explicit that asset purchases were not just about smooth market functioning, but also providing accommodative financial conditions. The implication is that the Fed has retained the option to reduce financial accommodation before inflation hits 2%, but that reduction comes via a slower pace of asset purchases rather than a rate hike.
See the problem there? I don’t know that market participants have fully absorbed that implication.
The focus instead has been on the unwillingness of the Fed to commit to additional asset purchases given that its own forecasts reveal we should expect a long period below target inflation. Oddly, Evans makes the case that additional asset purchases are unwarranted until the economy improves. Via Reuters:
“Ramping up the Fed’s bond purchases from its current monthly pace of $120 billion (or otherwise beefing up asset purchases) would be premature until the economy gets into better shape,” Evans told reporters on a call. That could include unemployment closer to 6% than the 8.4% it is now, and more consumers feeling comfortable spending their money outside of the home.
“When that happens, ‘we would have a better idea of the right amount of accommodation and the way to deliver it,” Evans told reporters. “At the moment everybody understands that we are accommodative.”
That sounds like a “pushing on a string” argument, i.e., that [rate] policy is no longer effective but could accelerate the recovery when the economy gains some self-sustaining momentum. Personally, I have trouble imagining that Fed will actually boost the size of asset purchases if the unemployment rate falls to 6% and looks to be heading lower, but I guess that is just another academic exercise at this point.
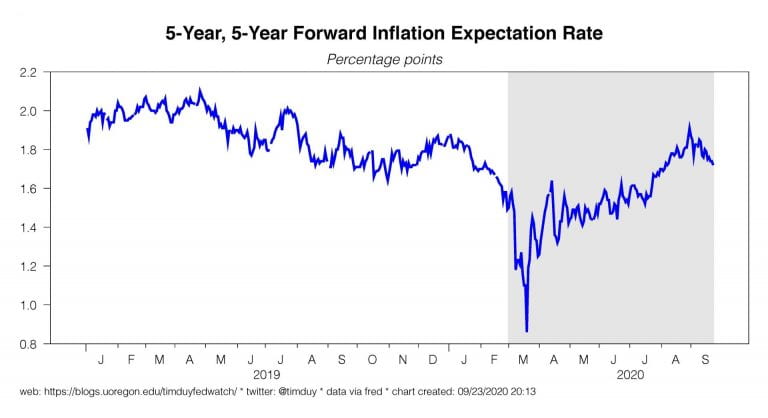
The question for the Fed is: Has it given itself too much leeway on asset purchases and even interest rates at this point to avoid having to tighten up the guidance with yield curve control or push out asset purchases along the yield curve. I don’t think they are ready for that yet. I am looking for upward pressure on bond yields [i.e., falling bond prices] that appears unwarranted as something that could push the Fed into a more accommodative stance. That, or fading inflation expectations. With that in mind, we should be watching an old favorite:
Bottom Line: The Fed is committed to a near-zero rate policy until inflation reaches 2% and anticipates it will remain at or above 2% on a sustainable basis. That is so far off in the future that we shouldn’t get too deep in the weeds before it happens, but now that the Fed has brought up the issue of rate hikes, they are stuck with a new communications problem.
Realistically, every time some Fed president puts some conditionality in the Fed’s commitment, someone like Vice Chair Clarida will have to come out and lock down expectations again. If they can’t keep expectations locked down with verbal guidance, they are going to have to resort to yield curve control or asset purchases.
Yield curve control is the easy route, but the Fed has dismissed it as an option for now. The real risk for rates is not the Fed’s commitment, but the Fed’s pessimism. If the economy continues to surprise on the upside, Fed forecasts will follow.
© Tim Duy. Used by permission.

The COVID-19 pandemic, the stock market crash, and Fed interest rate policy have all given economists and other academics plenty of topics to study during 2020. There’s been an outpouring of research papers this year—with a mixture of praise and criticism for government policy.
In this latest edition of Research Roundup, we offer summaries of six recent noteworthy economic studies, which were published by the National Bureau of Economic Research, the Federal Reserve Bank of New York, Morningstar, and SSRN.
One paper analyzes the composition of America’s richest demographic, while three others focus on the stock market and/or interest rates. A fifth article looks at the impact of the short-lived Obama “fiduciary rule” on high-cost variable annuity sales. A sixth asks: Why did so little fiscal stimulus trickle down to the most economically vulnerable this year?

Who is rich in America and where does their money come from? In the course of researching the drivers of financial inequality in the U.S., Wojciech Kopczuk of Columbia University and Eric Zwick of the University of Chicago unveiled illuminating data about the sources of income of the wealthiest Americans.
It turns out that private business owners and professionals, more so than Fortune 1000 executives, are most representative of the top one percent. “A majority of the top income earners in the United States are owners of ‘pass-through’ businesses,” they write in “Business Incomes at the Top” (NBER Working Paper 27752). [Note: Pass-through income is business income taxed at the individual level, not at the company level.]
In 2014, 69% of the top one percent of income earners and 84% percent of the top 0.1% percent of income earners accrued some pass-through business income, the paper said. Overall, there were more than 1.1 million pass-through owners with annual incomes above $390,000 and 140,000 pass-through owners with annual incomes of more than $1.6 million. There were 14,900 business owners in the top 0.01% percent of the income distribution. They received more than $100 billion in income from S-corporations and partnerships.
In 2014, about 270,000 wage earners in the top 1% and 27,000 wage earners in the top 0.1% worked for public companies, earning a total of $260 billion and $110 billion in wages and salaries, respectively. The 10,700 top public company executives earned $33 billion in salary and options that year.
“The typical top one percent earner is not a public company executive or tech billionaire,” write Kupczuk and Zwick. “A top earner is typically a doctor, lawyer, or the owner of a middle-sized business… For every public company employee in the top one percent and top 0.1%, there are four and five pass-through owners, respectively.”
“These top pass-through owners are predominantly working age, in contrast to the older top earners whose income comes from other categories of capital… 60% to 70% of the millionaires who get a majority of their income from either wages or pass-through ownership are in their 40s and 50s.” By contrast, about two-thirds of millionaires are in their 50s to 70s.
As for the sources of economic inequality in the U.S., which has risen in tandem with stock and bond prices since the early 1980s, Kupczuk and Zwick concluded that the wealthiest one percent get 41% of their income from capital [investments] (as opposed to labor income), not 56%, as reported by others such as Thomas Piketty. Measuring income is apparently not easy; income is reported in several ways for tax purposes, and only an estimated 60% of national income shows up on any tax return.
The zeroing-out of the benchmark interest rate by the Federal Reserve wasn’t the optimal or even a necessary response to the economic impact caused by the COVID-19 pandemic in March 2020. A targeted fiscal response would have been better, and might have eliminated the need to reduce rates at all.
So writes Columbia University economist Michael Woodford in a recent paper, “Effective Demand Failures and the Limits of Monetary Stabilization Policy (NBER Working Paper 27768). Instead, he recommends the application of “pandemic insurance” that would keep the most vulnerable economic dominoes from falling, and prevent a cascade of failures to pay and be paid.
The most vulnerable economic dominoes, in Woodford’s model, would have been the business sectors that were shut down solely because of fear of contagion. If the government intervened to pay the immediate bills of those sectors, a chain reaction of missed payments and a collapse of the “circular flow of payments” might have been avoided.
“Fiscal transfers directly respond to the fundamental problem preventing the effective functioning of the market mechanism, and can bring about a much more efficient equilibrium allocation of resources, even when they are not carefully targeted. And when fiscal transfers of a sufficient size are made in response to the pandemic shock, there is no longer any need for interest-rate cuts, which instead will lead to excessive current demand.”
Monetary policy works better when there’s a general slowdown in business activity than when a pandemic shuts down only certain sectors of the economy, according to Woodford: “The COVID-19 pandemic presents a challenge for stabilization policy that is different from those resulting from either “supply” or “demand” shocks that similarly affect all sectors of the economy.”
The “fiduciary rule” as proposed by the Obama administration (later defeated in court by life insurers and others) was effective in driving down sales of high-cost, high-commission variable annuity contracts, according to economists at Harvard and New York University.
In their study, the economists found that “sales of high-expense variable annuities fell by 52% as [consumers] became more sensitive to expenses and insurers increased the relative availability of low-expense products,” after the Obama Department of Labor (DOL) introduced its “best interest” fiduciary rule in 2016.
The rule required brokers to act as fiduciaries when selling fixed indexed annuities and variable annuities for clients to purchase with tax-deferred retirement savings (in rollover IRAs, for instance). The rule required brokers to pledge that they would act only in the client’s best interest, and gave investors the right to sue brokers who broke the pledge.
In 2017, the Trump administration froze the rule, and it was rescinded in 2018 after the American Council of Life Insurers and others successfully challenged the rule in the federal District Court of Appeals in Texas. The Trump DOL did not challenge the Texas ruling.
“Total variable annuity sales fell by roughly 19% year-over-year after the regulation was issued by the DOL in 2016. The drop in variable annuity sales was primarily driven by a decline in high-expense variable annuity sales; sales of low-expense variable annuities remained constant over this period. The results suggest that, in response to the proposal of the rule, brokers began complying with the rule by placing greater weight on investor interests. We also find that insurers responded to the rule by increasing the relative availability of low-expense products available for sale.”
Over the past 30 years, cuts in interest rates by the Federal Reserve have led to greater investment in stocks, mainly by upper middle class Americans, and those investments have stimulated economic growth, write economists Davide Melcangi and Vincent Sterk in a recent staff report from the Federal Reserve Bank of New York.
The two researchers set out to discover how Fed policy is transmitted to the real economy. Their answer: “A group of high-income households who save a large fraction of their incomes, and do so primarily by adding to their stock portfolios [are] critical to the transmission of monetary policy via aggregate investments.”
Investors react to decreases in interest rates by allocating new investments to stocks and to increases in rates by allocating to bonds, the authors wrote, relying on Investment Company Institute mutual fund flow data and other sources. These shifts, they added, have led either to increases or decreases, respectively, in capital investment by U.S. companies.
Stock ownership has broadened over the last few decades, but mainly among those with higher incomes who can afford to save. The increase in stock market participation “is driven by the upper middle-class, around the 60th to 80th percentile of income,” the report said.
In 1988, 25% of U.S. households invested in stocks, with 60% of those with the highest incomes investing. By 2000, 44% of households invested in stocks, with almost 85% for those with the most income investing. The researchers conclude that these trends have strengthened monetary policy effects on investment.
“Much of the decline in aggregate output following a monetary tightening is driven by investment rather than consumption. Related to this finding, we also show that households reduce their net investments into equity-focused mutual funds following a monetary tightening. Finally, we show that the net investment inflows into equity-based funds predict changes in aggregate investment into physical capital. All three patterns are consistent with an important role for stock investments,” the report said.
Turning their attention to the savings and consumption behavior of high-income Americans, they hypothesize that wealth investors save steadily out of income, invest more in stocks when interest rates go down, stop adding to their equity holdings when interest rates go up, and “liquidate stocks only when an infrequent expenditure opportunity arises.” Examples of those opportunities include “exclusive medical or old-age care, tuition for elite education, starting capital for a private business, or large donations.”
In hindsight, people can over- or under-save for retirement because, prior to retirement, they over- or under-estimate how long they would live. Those who plan on needing income until age 90, for instance, will try to save much more (or perhaps invest more aggressively) than those who plan on living to age 85.
For retirees, one alternative to saving too much or too little, or to over-spending or hoarding, or to gambling on longevity, is to buy a deferred income annuity (DIA) that starts paying income when mortality risk starts to accelerate (at age 85 or so).
A new whitepaper from Morningstar Investment Management, “The End of Retirement,” explores the implications for advisers and clients of unknown longevity. The authors suggest that, rather than trust clients’ subjective estimates of longevity, advisers should “base the estimate off objective information about the client.” It doesn’t recommend an annuity.
Morningstar reviewed data on 31,211 financial plans and found that 70% of plans assumed a client’s or couple’s lifespan of 90 years and 20% assumed a lifespan of 95 years. Generally, these assumptions weren’t based on individual health assessments, and they didn’t incorporate the survivorship bonus for couples.
As a rule of thumb, Morningstar recommended adding a buffer of five years to a single person’s life expectancy and eight years to the member of a couple with the longer life expectancy.
This approach suggests a retirement period of 30 years (to age 95) as a reasonable assumption for the average 65-year-old male/female couple retiring today.
“Individuals who said they had a 0% probability of surviving to a given age (75) actually had about a 50% chance, and those who said they had a 100% probability actually had about an 80% chance. Therefore, retirement periods should be determined using objective criteria—that is, don’t ask the client how long he/she thinks he/she will live, rather, base the estimate off objective information about the client.”
In their paper, “Inside the Mind of a Stock Market Crash,” four researchers analyzed Vanguard shareholder data to see how investor expectations about economic growth and stock returns changed during the February-March 2020 stock market crash induced by the COVID-19 pandemic, as well as during the subsequent partial stock market recovery.
The researchers surveyed retail Vanguard clients at three points in time:
Following the crash, the average investor turned more pessimistic about the short-run performance of both the stock market and the real economy. Investors also perceived higher probabilities of both further extreme stock market declines and large declines in short-run real economic activity. In contrast, investor expectations about long-run (10-year) economic and stock market outcomes remained largely unchanged, and, if anything, improved.
Disagreements among investors about economic and stock market outcomes also increased substantially following the stock market crash, with differences of opinion persisting through the partial market recovery.
Survey respondents who were the most optimistic in February saw the largest decline in expectations, and sold the most equity. Those respondents who were the most pessimistic in February largely left their portfolios unchanged during and after the crash.
The COVID-19 crisis has led to spiking unemployment rates with disproportionate impacts on Low-income families were disproportionately affected this year by lay-offs related to the COVID-19 pandemic, write Marianne Bitler, Hilary W. Hoynes and Diane Whitmore Schanzenbach in their paper, “The Social Safety Net in the Wake of COVID-19” (NBER Working Paper No. 27796).
School and child-care center closures have often meant lost free- and reduced-price school meals. Food prices have also increased sharply in some areas, lowering the purchasing power for families with limited incomes.
The Families First Coronavirus Act and the CARES Act expanded unemployment insurance (with broader eligibility and a supplement of $600 per week), provided a one-time payment of $1,200 per adult and $500 per dependent, increased SNAP payments, and launched the Pandemic EBT (Electronic Benefits Transfer) program to replace lost school meals.
But, as the pandemic continued, food insecurity rates increased to almost three times the pre-COVID rates and food pantry use spiked. The authors offer three reasons why: (1) Timing – relief was delayed because unemployment insurance (UI) systems were overwhelmed and new programs had to be started; (2) Magnitude – payments outside UI were modest; and (3) Coverage gaps –some groups didn’t have access to relief programs and other groups were ineligible for them.
© 2020 RIJ Publishing LLC. All rights reserved.
A-CAP and AmeriLife have launched the Accumulation Protector Plus (“APP”) Annuity, a 10-year fixed indexed annuity, an addition to the product lines of Sentinel Security Life Insurance Company and Atlantic Coast Life Insurance Company, two A-CAP subsidiaries.
The APP Annuity offers contract holders exclusive access to the Credit Suisse Momentum Index, a 10-year guarantee of participation rates through the index, and a choice of eight crediting strategies. Four of those strategies can be paired with the Credit Suisse Momentum Index.
The Credit Suisse Momentum Index diversifies its underlying components across equities, bonds and commodities in four global regions. Implementing a momentum-driven strategy, managers of the index take long positions in components with the strongest trends and short positions in components with weaker trends.
The contract’s “Rate Enhancement Rider” increases the fixed, participation, and cap rates across the contract holder’s crediting strategies, raising the potential return from market upswings. This rider also increases the amount available for free withdrawal from 5% to 10% of the contract holder’s account value and includes a 110% minimum guaranteed return of premium over 10 years.
The participation rates for the Credit Suisse Momentum Index are guaranteed for 10 years with the selection of the one-year point-to-point or two-year point-to-point crediting strategies, provided that Sentinel Security Life Insurance Company and Atlantic Coast Life Insurance Company continue to have access to the Credit Suisse Momentum Index.
Worried that Congress will fail to re-finance Social Security and simply allow benefits to drop by about 25% across-the-board after 2034? You can now insure that risk with a “PlanGap Annuity” issued by the American Life & Security Corp., based in Lincoln, Nebraska.
“The PlanGap Annuity is the first financial product that empowers people to protect themselves against a future reduction in Social Security benefits while still earning a guaranteed interest rate,” said PlanGAP founder and CEO David Duley in a release.
“The PlanGap Annuity introduces a class of financial solutions called retirement insurance, which is a suite of ‘trigger-based’ annuity and life insurance products that solve fundamental financial issues for retirees,” the release said.
According to the Social Security Administration (SSA), its retirement program cash reserves will be exhausted in 2034, triggering a 24% reduction in benefits. If this reduction takes place, an average two-income household would see a $700 reduction in monthly income. (These calculations do not include Covid-19 impacts, which could further erode the program’s ability to pay.)
With the PlanGap Annuity, if a contract owner’s Social Security benefits are reduced, she will receive a PlanGap Bonus to help fill the income gap. If benefits aren’t reduced and she no longer feels the need for the insurance, she can withdraw the initial premium, the interest she earned and a “Flexibility Bonus” at the end of any five-year anniversary of the policy.
PlanGap pays policyholders a sum based on the amount of coverage chosen at the time the annuity was purchased. This “PlanGap Bonus” escalates over time and caps at 30% of initial annuity value, said David Duley, PlanGap’s founder and CEO, in a release. Available in 18 states and the District of Columbia, with more states expected in the near future, PlanGap annuities are available from licensed insurance professionals.
Only one in five Americans ages 50 to 75 knows how to plan for a financially secure retirement, according to The American College of Financial Service’s 2020 Retirement Income Literacy Survey. Income needs in retirement, investment management skills, and long-term care costs were unfamiliar concepts for most of them, the survey showed.
A majority of respondents are holding their financial plans steady amid the COVID-19 pandemic, yet “just one in three report having a formal, written retirement plan in place,” according to an American College release this week.
These findings are part of the third iteration of the survey, which tests consumers’ knowledge about retirement income concepts and focusing on the drawdown phase when Americans have limited or no ability to earn additional money through work. This year’s study expanded the scope of those surveyed to include Americans ages 50-75.
Retirement literacy in 2020 remains low overall, as was the case in The College’s 2014 and 2017 surveys. Eight in ten (81%) Americans surveyed failed a 38-question retirement literacy quiz, scoring just 42% on average. Consumers also lack confidence—only a third of those surveyed felt “highly knowledgeable” about retirement income planning.
The survey showed that:
A majority self-report that they are at least moderately knowledgeable about investment management, but:
Long-term care
Only three in ten (31%) have a plan in place for how to fund long-term care needs and only one in four (23%) have some sort of long-term care insurance coverage. In addition:
COVID-19
Nearly four in ten (39%) consumers reported feeling highly prepared for the market downturn associated with the pandemic. Interestingly, what made a difference in consumers’ perception of preparedness for the crisis was having a formal, written retirement plan.
Those with a written retirement plan (47% vs. 35% of those without) or a retirement income plan (43% vs. 22%) reported feeling more prepared to deal with the market downturn. Only one in three (33%) respondents report having a written plan.
The pandemic has shifted the mindset of many investors. Four in ten (39%) say they now feel less comfortable taking investment risk. Only 8% say they’ve adjusted their allocations to be more conservative, but a realignment of risk tolerance is noteworthy. More than half (54%) of consumers said they are holding their financial plans steady.
For more information about the 2020 Retirement Income Literacy Survey results and to take the quiz, visit theamericancollege.edu/retirement-income-literacy-survey.
Greenwald & Associates conducted the study of 1,500 people for The American College between April 29 and May 18, 2020. To participate, respondents had to be ages 50-75 and have at least $100,000 in household assets, not including their primary residence.
Mercer, an employee benefits business of Marsh & McLennan, announced that its retirement plan solution, Mercer Wise 401(k), has exceeded $1 billion in assets under management.
Launched in 2017, Mercer Wise 401(k) is a bundled solution that allows plan sponsors to outsource the administrative burdens, operating function, fiduciary risk, and investment decisions associated with each plan and to serve as named fiduciary under ERISA.
Mercer Wise 401(k)’s latest AUM milestone comes at a time when regulatory reforms are expected to further increase plan sponsors’ access to bundled plans, as evident in the passage of the 2019 SECURE Act and the establishment of “Pooled Employer Plans.” These plans are expected to be available starting in 2021.
Mercer Wise 401(k) is part of Mercer’s growing Outsourced Chief Investment Officer (OCIO) business, which surpassed more than $300 billion in assets under management in December 2019, and currently has U.S. Defined Contribution (DC) OCIO assets in excess of $58 billion.
Voya Financial, Inc., now expects to complete the divestment of its Individual Life and other legacy non-retirement annuities businesses in 4Q2020. Voya previously announced that it sold these businesses to Resolution Life Group Holdings pursuant to a Master Transaction Agreement dated Dec. 19, 2019.
Voya’s Security Life of Denver Insurance Company (SLD) and Security Life of Denver International Limited (SLDI) subsidiaries will be acquired by a new holding company, Resolution Life US, created by Resolution Life to hold these blocks of business.
In addition, Voya will reinsure the life insurance, pension risk transfer and non-retirement annuities business issued by ReliaStar Life Insurance Company (RLI), Voya Retirement Insurance and Annuity Company (VRIAC), and ReliaStar Life Insurance Company of New York (RNY) to SLD. Voya will retain ownership of VRIAC, RNY and RLI. Voya will also take an interest in Resolution Life, the parent investment fund of Resolution Life US.
Voya and Resolution Life had previously expected to complete the transaction by Sept. 30, 2020. They are shifting the targeted closing to allow more time to complete the remaining regulatory reviews of the transaction. To date, the two companies have received approval from most of the state and federal regulators that need to review the transaction.
“However, we recently learned that the approval process will not be complete prior to Sept. 30, 2020. As a result, we now expect that the transaction will close in the fourth quarter of 2020. We also continue to expect that the sale will provide Voya with approximately $1.5 billion in deployable capital,” said Rodney O. Martin, Jr, chairman and chief executive officer, Voya Financial, Inc., in a release.
Pursuant to the Master Transaction Agreement, Voya and Resolution Life will close the transaction on the first of the month following the receipt of all regulatory approvals of the transaction.
© 2020 RIJ Publishing LLC. All rights reserved.
The looming election fills me with dread and ennui. The outcome could rival the election of 1860, when Lincoln’s victory split the country in two. (The whiff of armed insurrection is already in the air.) Or we could see four years of tedious turmoil.
No platform was introduced at the GOP convention. That reflects the Republican ideal of tiny government as well as the president’s preferred style of governance by impulse, nepotism and personal grievance.
Judging by the Biden-Harris platform, the Democrats would re-propose many of the Obama initiatives—like the Affordable Care Act and a reduction of the tax incentives for retirement savings—that inspired so much resistance from the other side.
Regardless of who is elected or controls Congress, the Federal Reserve apparently intends to keep interest rates near zero for at least four years. Though good for stocks, this policy has transformed the life/annuity industry, and not in a good way. (See today’s RIJ article on ‘Private equity.’)
I worry about inaction over on Social Security. Although most Americans love Social Security, and rely on it to fund at least half of their retirement consumption, neoliberals and the financial industry itself keep maligning it and predicting its insolvency.
People say, “I can invest my money better than the government can.” Agreed. But Social Security isn’t an investment. It’s insurance. And, no, no individual (nor the entire life insurance industry) can buy longevity risk on a massive scale as effectively or efficiently as Uncle Sam can. And markets are risk generators, not absorbers.
Much of the electorate is too numb, however, for such nuances. In past election periods, when I’ve canvassed door-to-door, some people have told me that they won’t bother to vote because politicians are all alike.
I don’t blame people for voting their own interests. When administrations change, different groups of constituents get their phone calls, texts and emails returned. If you need access in Washington, you should probably vote for those who will give it to you.
That’s a reminder of how divided we are. And we’re divided, in part, because we tend to think in absolutes. Black-and-white thinking is our curse. People want to believe that regulations, taxes, and immigrants are either categorically good or bad, and that phenomena like climate change are either existential threats or “hoaxes.” But shades of grey, ambiguity, compromise, and trade-offs are more characteristic of the real world. Yin and yang aren’t necessarily antagonistic; they’re complementary.
In the case of semi-automatic weapons, however, certain absolute judgments may be appropriate.
Decades ago in Romania, I saw policemen cradling assault rifles on street corners and I adopted, as a political rule of thumb, the idea that the wielding of AR-15s in public signals a society gone awry. This summer, in the center-square of my little town, men with semi-automatic weapons milled at the fringes of a small public demonstration. Such displays, I hope, are a passing phase and not a leading indicator.
© 2020 RIJ Publishing LLC. All rights reserved.
As insurance firms remain challenged by a return to historically low interest rates, private-equity (PE)-driven mergers and acquisitions (M&A) have become an increasingly attractive option for both insurers and PE managers, according to Cerulli Associates.
Broad economic uncertainty and social distancing may have tempered the pace of M&A deal making, but longer-term dynamics in the industry are likely to drive persistent activity, says Cerulli’s latest report, U.S. Insurance General Accounts 2020: Finding Solutions Outside the Core.
U.S. insurance companies are among the largest investors in the world—assets increased by 6.7% in 2019 to reach a total of $6.7 trillion, the majority of which is allocated to investment grade long-term bonds. Battered by a return to ultra-low interest rates, they are also perhaps the most challenged institutional investors.
“The low interest environment leaves very little room for poor underwriting or asset management performance—it’s a rising threat to insurers’ business models,” states Robert Nelson, associate director. According to the research, 88% of insurers cite low interest rates/generating returns or yield at the top of their list of concerns.
Seeking to match asset returns with underwritten liabilities and position their business for long-term growth, many insurers are looking to partner with PE firms. Insurers increasingly depend on higher-yielding asset classes via separate accounts or in a fund structure.
“A takeover of general account assets by a PE firm gives the insurer, in effect, an affiliated PE manager and the fee advantages typically seen in co-investing scenarios—a much more cost-effective and efficient way to attain the desired alternatives exposure,” according to Nelson.
Private equity firms’ motivation for pursuing insurance assets is twofold: they gain a reliable return stream on invested capital while also gaining highly coveted permanent capital from the insurer.
“Permanent capital is more valuable to PE firms because it’s stickier,” says Nelson. “Stable and positioned for the long term, permanent capital is perfectly fitted for the longer time horizon investments for which private investors are known. It also reduces the need for external fundraising on a cyclical basis.”
Buying a stake in the insurer also has proven a lucrative strategy in an environment of climbing valuations.
While deal flow has slowed, recent announcements show that big PE players are still focused on the industry and willing to pull the trigger for a target that fits within their business strategy. There is also evidence of smaller players executing on similar acquisition strategies.
“Deal making remains challenged by the absence of in-person due diligence and engagement that normally occurs when mergers commence; however, businesses are adapting and creating workarounds to pandemic-related hurdles. It won’t be long before this transformative trend resumes across the industry,” Nelson concludes.
© 2020 Cerulli Associates. Used by permission.

This week’s FOMC meeting was fairly substantial.
The FOMC doubled down on its near-zero rate policy despite the economic gains of recent months. This was entirely consistent with recently announced changes to the Fed’s policy strategy. In a surprise move, it enhanced its forward guidance such that the guidance is now consistent with the updated strategy. The Fed continues to lean into the downside risks for the forecast, another reason not to doubt its commitment to zero-rates in the foreseeable future.
The primary implication is that the Fed is committing to an extended period of very low and negative real policy rates even as economic activity accelerates. What are the risks here? The first risk is that the Fed retains a lot of leeway to adjust financial conditions via the asset purchase program. There are no commitments to the pace of asset purchases. The second risk is that the Fed has completely left itself open to being blindsided by a better than expected recovery.
The easiest place to start is with the economic projections:
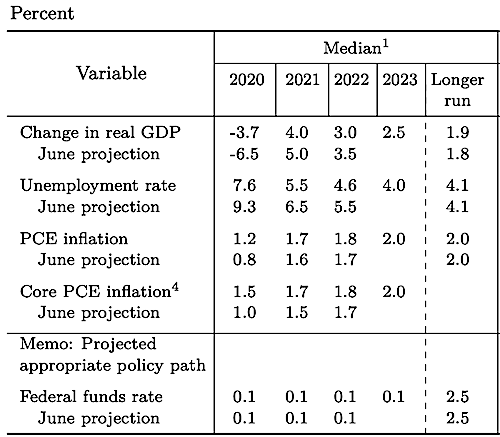
These are substantial improvements in the outlook. The recession is less severe than anticipated and unemployment declines while inflation rises much more quickly. The median rate expectation however remains near zero for another year and now only one FOMC participant expects a rate hike before 2023. These outcomes are entirely consistent with the new strategy as I explained here in Bloomberg and earlier this week in this blog. This is how the new strategy is operationalized.
Despite these improvements, all the Fed sees are downside risks:
“The path of the economy will depend significantly on the course of the virus. The ongoing public health crisis will continue to weigh on economic activity, employment, and inflation in the near term, and poses considerable risks to the economic outlook over the medium term.”
At best, this analysis is starting to sound unoriginal. The Fed remains very, very clearly focused on the last battle. It assumes a long and slow recovery like in the wake of the Great Recession and a complete lack of inflationary pressures. I don’t think we can make these assumptions any more. This isn’t 2007-2009.
We don’t know what it is, but we do know that it isn’t 2007-2009. There was nothing wrong with the economy in January. There are no sizable misallocations of investment to overcome. The Fed didn’t let the financial sector crumble. There has been a massive improvement in household finances attributable to fiscal stimulus. And the economy is quickly growing around the virus.
I was fairly pessimistic early this year but the facts on the ground are shifting and I think you have to shift with those facts. The Fed however is focused on downside risks and locked into the zero-rate policy path for at least the near term. I think you can describe the near-term path as credibly irresponsible, which is exactly where you want the Fed to be if you want them to let the economy rip.
My preference is to let the economy rip, so I am not going to criticize the Fed. From a macro perspective, it’s a stance that should be positive for risk assets and negative for longer-term bonds (the risk on a negative outlook for bonds though is that rising rates push the Fed into more asset purchases on the long end).
The Fed further reinforced the projections with the statement:
“The Committee seeks to achieve maximum employment and inflation at the rate of 2% over the longer run. With inflation running persistently below this longer-run goal, the Committee will aim to achieve inflation moderately above 2% for some time so that inflation averages 2% over time and longer-term inflation expectations remain well anchored at 2%.
“The Committee expects to maintain an accommodative stance of monetary policy until these outcomes are achieved. The Committee decided to keep the target range for the federal funds rate at 0 to 0.25% and expects it will be appropriate to maintain this target range until labor market conditions have reached levels consistent with the Committee’s assessments of maximum employment and inflation has risen to 2% and is on track to moderately exceed 2% for some time.”
The first part of the reiterates the results of the strategy review. The reference to an inflation average is completely disingenuous because they can’t define a time-frame around average, but we all know that at this point. It’s just a game we are playing with the Fed, kind of like flirting. The last part, the commitment to holding rates at near zero until the economy is both at maximum employment AND inflation is at 2% is the unexpected enhanced forward guidance. It is really nothing more than making explicit what the Fed had already made implicitly. This though confirms Fed is locked into its current policy stance until inflation hits 2%.
This is all bullish. Run with it, don’t fight the Fed. But watch for things to go sideways. So how can they go sideways? The most obvious place is that while the Fed has committed to a rate policy path, it has not done the same for asset purchases. The Fed can very easily wind down asset purchases and claim to be maintaining accommodative financial conditions. It’s not exactly unprecedented.
Moreover, it is now all too easy to see a rapid pivot on asset purchases given that the Fed has so completely embraced the “this is 2010-2018 all over again” scenario. If unemployment and inflation continue to surprise on the upside, the Fed could be caught off guard and want to quickly pull back on quantitative easing. And what if there is a vaccine and in nine months we all book our Hawaiian vacations? (Yeah, I’m projecting.) That scenario has got to be on your radar as much as the downside scenarios.
Bottom Line: The Fed is committed to zero rates for the foreseeable future. It is not committed in the same way to the pace of asset purchases. The Fed though is not inclined to shift its current stance very easily. The bar is high for a rate hike. I suspect it is not nearly so high for the Fed to pull back on asset purchases. In the near term, that isn’t going to happen because the Fed is wedded to the bearish risks for the economy. If the forecast changes, the Fed will change with it. But it may be slow to change, and then change abruptly.
© 2020 Tim Duy. Reprinted by permission.
RIJ staff will take a two week vacation, starting today. We will publish next on September 17, 2020. Happy Labor Day to all.
Many market-watchers have wondered publicly and privately why equity prices have recovered over the past five months in defiance of the weakness in the U.S. economy, as reflected by persistently high unemployment rates and uncertainty about the future impact of COVID-19.
In a recent working paper from the National Bureau of Economic Research, two MIT economists propose an answer. They say, in short, that the discrepancy is exactly what you’d expect to see when a central bank responds correctly when economy stalls because of a sudden drop in demand.
The “wide disconnect between the main stock indices and the state of the real economy in the U.S. following the Fed’s powerful response to the Covid-19 shock” is a “vivid example” of optimal central bank policy to the emergence of a “negative output gap,” write Ricardo Caballero and Alp Simsek. (A negative output gap means spare capacity in the economy as a result of weak demand.)
“Overshooting” is how they describe the rise in stock prices prior to a recovery in output and demand. “To minimize the output gap,” they write, “the central bank optimally induces asset price overshooting.” It should do so, “even if there is no output gap in the present but the central bank anticipates a weak recovery dragged down by insufficient demand.”
In a separate paper, the authors explain how the initial “supply shock,” which occurred when exports from China to the U.S. slowed last spring, led to a drop in asset prices and aggregate demand, and how the central bank’s responses have helped drive up asset prices, which help drive up aggregate demand, which fosters a broad economic recovery. The authors rejected the idea that its actions favored banks over consumers.
Noting the huge rise in the NASDAQ-100 (which is heavy on Apple, Microsoft, Facebook, Alphabet and other tech stocks) since the Fed eased rates last March, the authors remark that firms “not adversely affected by the productivity shock see their shares’ value rise above its pre-recession level since they benefit from the central bank’s attempt to boost asset prices without suffering from the decline in potential output.”
MetLife Investment Management (MIM), the institutional asset management business of MetLife, Inc., today announced it originated $6.2 billion in private placement debt for the first half of 2020, across nearly 100 transactions, including $1.7 billion of investments originated on behalf of institutional clients.
MIM’s private placement debt origination for the first half of 2020 comprised $4.5 billion in corporate private placement debt transactions and $1.7 billion in infrastructure private placement debt transactions. This origination activity, which added 29 new credits, helped increase the value of MIM’s total private placement debt portfolio to $91.2 billion as of June 30, 2020.
MIM’s corporate private placement activity was diversified across industry sectors, including general industrial, healthcare, professional services, retail and utilities. “MIM was selective in its infrastructure private placement opportunities and participated in transactions that provided strong structural protections and relative value across the following sectors: electric transmission, renewable power, social housing and infrastructure, and stadiums. Investments included nearly $550 million in six transactions across the renewable power and social housing and infrastructure sectors,” an MIM release said.
As of June 30, 2020, MIM had $629.1 billion in total assets under management.
Under Jackson National Life’s new digital distribution service for independent Registered Investment Advisors (iRIAs) and their clients, Jackson’s insurance-licensed distribution associates can facilitate transactions, the company said in a release today.
The new online portal, designed specifically for iRIAs, comes more than a year after Jackson began making its products available through third-party iRIA distribution partners, including DPL Financial Partners, TD Ameritrade, RetireOne and Financial Insurance Group.
The new digital service complements Jackson’s existing distribution channels, including independent broker-dealers, banks, and full-service national brokerages (“wirehouses”). These traditional channels will continue to service hybrid RIAs who maintain an affiliation with a broker-dealer, while Jackson’s six dedicated RIA consultants will serve iRIAs.
“The digital experience on Jackson.com provides clients of iRIAs with access to a suite of fee-based annuity offerings with no commissions or withdrawal charges, including Jackson Private Wealth, an investment only variable annuity; Perspective Advisory II, a variable annuity with add-on benefits; and MarketProtector Advisory, a fixed index annuity,” a Jackson release said.
“Through the launch of the new online portal, “We are highlighting our commitment to a digital-first approach, including the submission of client information as well as paperless processes all serviced by a fully licensed concierge team,” said Dev Ganguly, senior vice president and chief information officer, Jackson.
Independent RIAs can learn more at Jackson.com/ria-and-wealth-managers.html or call 800-711-7397.
DPL Financial Partners, host of an insurance sale platform for registered investment advisors (RIAs), is offering additional products from Principal Financial Group on the DPL platform.
“Coupled with last month’s announcement of a long-term care insurance alternative, the addition of disability and term life insurance means that virtually every major financial insurance category is now available to DPL’s 1,000 member RIA firms,” a DPL release said.
Both the disability and term life products became available on the DPL platform starting Aug. 25, 2020.
The proportion of Americans whose adult children moved back home with them (or adults who said that they moved back home with their parents) is relatively small; however, the data identifies a disconnect in longer-term expectations, according to a new survey by New York Life.
Parents believe that they will need to support their children for a longer period than their children believe, the survey showed. For example, 38% of adult children believe they will only need financial support for six months or less, while only 27% of parents share that sentiment.
Of the parents whose children moved back home, nearly one in three (29%) expect their kids to stay with them for three or more years. Only 14% believe their children’s stay will last three or fewer months. In contrast, just 17% of adults living with their parents expect to stay there for three or more years, whereas 22% expect to stay three or fewer months.
“This suggests a greater need to normalize family discussions about finances,” a New York Life release said, suggesting an adviser’s intervention.
New York Life commissioned Morning Consult to conduct a series of recurring surveys among a national sample of 2,200 adults. This poll was conducted online between May 29-June 1, 2020.
© 2020 RIJ Publishing LLC. All rights reserved.
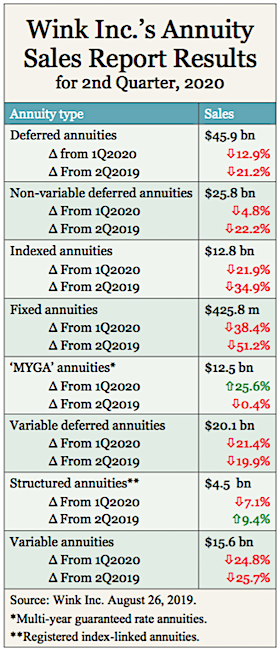
Athene USA surpassed long-standing indexed annuity sales leader Allianz Life in the second quarter of 2020, with an 11% market share, according to Wink Inc.’s quarterly annuity sales report.
“The former frontrunner has been dethroned after more than a decade in their top-ranking position,” said Sheryl J. Moore, President and CEO of both Moore Market Intelligence and Wink, Inc., adding, “MYGA [multi-year guaranteed rate annuities] sales increased double-digits, while indexed annuity sales declined similarly; this is a new trend.”
Total second quarter sales for all deferred annuities were $45.9 billion, down 12.8% from the previous quarter and down 21.2% from the same period last year. Sales of indexed annuities were down 22% from the previous quarter and down 35% from the previous year.
The second quarter was extremely soft for annuities sales overall. Sales were evidently hurt by the Federal Reserve’s pandemic-related low interest rate policy, which reduced crediting rates of most rate-sensitive annuities. The low-rate policy has lifted stock indices and bond prices.
“As everyone adjusts to COVID-friendly selling, and the 10-year Treasury rate remains minuscule, sales will be challenged,” Moore said in a release this week.
The only annuity categories with good sales news in the quarter were MYGAs and structured variable annuities. At $12.5 billion, MYGA sales were up almost 27% from the previous quarter but down slightly from the previous year. Structured variable annuity sales were down from the previous quarter but up 9.4% from the year-ago quarter.
Rising sales of MYGAs may have reflected a flight to safety by some investors. According to Morningstar’s recent fund flow reports, bond funds have been gaining at the expense of stock funds—despite rising equity prices, ironically.
In indexed annuity sales, Allianz Life moved into second place, followed by Fidelity & Guaranty Life, AIG, and Sammons Financial Companies. Allianz Life’s Allianz 222 Annuity was the top-selling indexed annuity, for all distribution channels combined, for the twentieth consecutive quarter.
Jackson National Life was the overall top seller of deferred annuities, with a market share of 7.5%. New York Life, Massachusetts Mutual Life Companies, Lincoln National Life, and Equitable Financial followed.
Jackson National’s Perspective II Flexible Premium Variable & Fixed Deferred Annuity was the top-selling deferred annuity product as well as the top selling deferred variable annuity product, for all distribution channels combined, for the sixth consecutive quarter.
Total sales of non-variable deferred annuities were $25.7 billion in the second quarter of 2020; down 4.8% when compared to the previous quarter and down 22.2% when compared to the same period last year. Non-variable deferred annuities include the indexed annuity, traditional fixed annuity, and MYGA product lines.
Sixty-three indexed annuity providers, 43 fixed annuity providers, 62 multi-year guaranteed annuity (MYGA) providers, 13 structured annuity providers, and 47 variable annuity providers participated in the 92nd edition of Wink’s Sales & Market Report for 2nd Quarter, 2020.
Massachusetts Mutual Life Companies was the top carrier overall for non-variable deferred annuity sales in the second quarter, with a market share of 10.3%. New York Life, Sammons Financial Companies, Athene USA, and Global Atlantic Financial Group followed.
Massachusetts Mutual Life’s Stable Voyage 3-Year, a multi-year guaranteed annuity, was the top-selling non-variable deferred annuity for all distribution channels combined.
Total second quarter variable deferred annuity sales were $20.1 billion; that was down 21.4% from the previous quarter and down 19.9% from the same period last year. Variable deferred annuities include the structured annuity and variable annuity product lines.
Jackson National Life was the top carrier overall for variable deferred annuity sales in 2Q2020, with a market share of 16.3%. Equitable Financial, Lincoln National Life, Brighthouse Financial, and Prudential followed.
Traditional fixed annuity sales in the second quarter were $425.7 million; that was down 38.4% from the previous quarter and down 51.2% from the same period last year. Traditional fixed annuities have a fixed rate that is guaranteed for one year only.
Modern Woodmen of America was the top-ranked carrier in sales of fixed annuities, with a market share of 16.0%. EquiTrust, Global Atlantic Financial Group, Jackson National Life, and Brighthouse Financial followed. EquiTrust ChoiceFour with Liquidity Rider was the top-selling fixed annuity, for all channels combined.
Multi-year guaranteed annuity (MYGA) sales in the second quarter were $12.5 billion; that up 25.6% when compared to the previous quarter, and down 0.3% when compared to the same period last year. MYGAs have a fixed rate that is guaranteed for more than one year.
Massachusetts Mutual Life Companies was the top seller of MYGAs, with a market share of 20.3%. New York Life, Sammons Financial Companies, Global Atlantic Financial Group, and Symetra Financial followed.
Massachusetts Mutual Life Stable Voyage 3-Year was the top-selling MYGA contract for the third consecutive quarter, for all channels combined.
Structured annuity sales in the second quarter were $4.5 billion; that was down 7.1% from the previous quarter but up 9.3% from the previous year. Structured annuities have a limited negative floor and limited excess interest that is determined by the performance of an external index or subaccounts.
Lincoln National Life ranked as the top-seller of structured annuities, with a market share of 23.4%. Lincoln National Life Level Advantage B Share was the top-selling structured annuity for the second consecutive quarter, for all channels combined.
Variable annuity sales in the second quarter were $15.6 billion, down 24.7% from the previous quarter and down 25.6% from the same period last year. Variable annuities have no floor; the potential for gains or losses is determined by the performance of the subaccounts. Subaccounts may be invested in an external index, stocks, bonds, commodities, or other investments.
Jackson National Life held on to its top ranking in sales of variable annuities, with a market share of 21.1%. Equitable Financial, Lincoln National Life, Prudential, and New York Life followed.
Wink reports on sales of indexed, fixed, multi-year guaranteed, structured, and variable annuities as well as on sales of life insurance. Reporting on sales of additional product lines will follow in the future.
© 2020 RIJ Publishing LLC. All rights reserved.

President Trump recently flummoxed the liberal henhouse by mentioning the possibility of stimulating the economy by legislating a payroll tax holiday—which at an annual rate would eliminate about a trillion dollars a year in revenue from Social Security and hasten its insolvency—at least technically.
On August 19, four Democratic Senators (Bernie Sanders, VT; Chuck Schumer, NY; Chris Van Hollen, MD; and Ron Wyden, OR) sent a letter to Stephen C. Goss, the Chief Actuary of Social Security, asking for his analysis of “hypothetical legislation” that cut off payroll taxes as of January 1, 2021.
In a response this week, Goss wrote that the Social Security and Disability Insurance Trust Fund reserves “would become permanently depleted by the middle of calendar year 2023, with no ability to pay OASI [Old Age and Survivors Insurance) benefits thereafter.”
But he prefaced that remark by also writing that “the projected depletion date of the trust fund reserves [~2034] would be essentially unaffected by the legislation,” if the trust funds were “held harmless” by further provisions in the legislation—as they were during payroll tax abatements in 2010 to 2012 recession.

Eugene Steuerle
Here at RIJ, this exchange naturally raised questions. As we often do, we took our Social Security questions to Eugene Steuerle of the Urban Institute, a Social Security expert with many years’ experience in the federal government. Our interview with Steuerle follows.
RIJ: When Social Security doesn’t have enough revenue to cover benefits, doesn’t it “sell” those bonds to Treasury and receive “cash” so Social Security can pay benefits (all for accounting purposes)?
Steuerle: Yes. But the trust fund doesn’t have enough bonds to pay “full” benefits after 2035 or so. If it takes in less taxes, that date gets moved up.
RIJ: Other than interest, in what sense does the trust fund have income?
Steuerle: Trust fund income includes Social Security payroll taxes or “contributions,” plus interest from the trust fund bonds, as well as taxes collected through income taxation of Social Security benefits. The payroll taxes dominate.
RIJ: Doesn’t Social Security simply “lend” money to Treasury when there are surplus payroll taxes and then “redeem” the “debt” when there is a shortfall in payroll taxes (all strictly for accounting purposes)?
Steuerle: Yes, but eventually there will be no bonds left, and the law requires that benefits must be paid only out of the trust funds, thus preventing borrowing from Treasury absent new legislation.
RIJ: Has Social Security already begun to sell its special bonds to Treasury, thus reducing the “trust fund”? If so, when exactly did that begin? How far has the trust shrunk since its peak value?
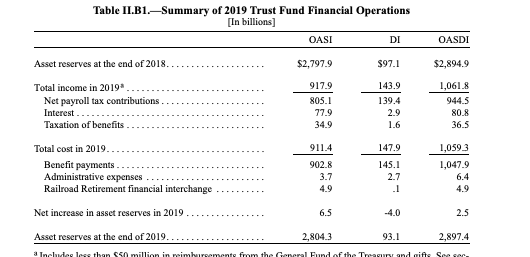
Steuerle: This past year taxes and interest just about matched benefit payments. Benefit payments are roughly $1.05 trillion; asset reserves are about $2.9 trillion. In the future, trust fund bonds will increasingly be sold. And trust fund income from all sources will increasingly fall short of benefits.
See the table below for 2019. The unemployment associated with the current pandemic and its aftermath also adds to the gap for 2020 and probably the next few years.
RIJ: So payroll tax is “income” for the trust fund? Has payroll tax ever flowed into the trust fund before being paid to beneficiaries or “loaned” to the Treasury general fund?
Steuerle: This is all definitional. The taxes come in mainly to the IRS, which credits them to the Social Security trust fund. The trust fund then holds special purpose Treasury bonds for any reserves arising from past surpluses. The federal government then “writes checks” against the trust fund balances.
RIJ: If Congress were to pass the President’s “hypothetical legislation” for a payroll tax holiday in 2021, then would Social Security have zero revenue and zero remaining trust funds within the next couple of years?
Steuerle: If you take away payroll taxes and trust fund interest, the trust funds [now at $2.9 trillion] would be depleted quickly. Losing one year of payroll taxes would deprive the trust fund about $1 trillion of income, plus future interest on that income.
RIJ: What about the previous forecast, or conventional wisdom, that Social Security, as is, can pay 100% of promised benefits to 2034 and 75% of promised benefits thereafter? Is that forecast now obsolete?
Steuerle: Yes, unless Congress would pay back Social Security for payroll tax revenue lost during a suspension. which is what has done in the past. But the President’s authority on deferring taxes does not extend to this matter—though that appears to be what he is counting on.
In a sense, the President’s position is not very different from that of some Democrats, who seem to feel that, if they can delay reform until close to 2035, Congress would not allow everyone’s benefit to be cut by 25%. That is, at that point, there would be no money in the trust funds. Essentially all revenues would derive from the payroll tax, and those taxes could only cover 75% of scheduled benefit payments to current retirees and disabled persons.
RIJ: So Social Security will not be able to pay any benefits from 2023 onward if the hypothetical legislation passes?
Steuerle: Yes—unless, as I said, Congress pays Social Security back and the payroll taxes start flowing again.
RIJ: Can’t Congress just pass a law that says payroll tax shortfalls will be covered by appropriations from the Treasury general fund? After all, today’s retirees paid income tax in addition to payroll tax for decades.
Steuerle: Yes, Congress can convert Social Security deficits to non-Social Security deficits. The effect on the unified deficit is essentially the same.
RIJ: Why is the public still led to believe that Social Security has the same constraints as a private pension fund, when the truth is that the U.S. Treasury can always meet its obligations; that only self-imposed constraints, and not lack of resources, would stop the US Treasury from paying promised benefits?
Steuerle: This goes all the way back to the Roosevelt administration. Roosevelt himself argued that he did not believe that the system should be set up with shortfalls that would force future Congresses to legislate new tax increases on future taxpayers. He supported the “private pension” analogy. He wanted people to believe they had “earned” their benefits even though, in a pay-as-you-go system, each generation’s taxes largely go to pay their parents’ benefits and are not saved for their own. Even those who argue that ‘deficits don’t matter’ seldom if ever suggest that we run government without ever collecting taxes. Where’s the limit?
RIJ: No, that would invite inflation and eliminate a policymaking tool. But I’ll defer to you for the last word on that.
Steuerle: The bottom line is that we benefit from government and we pay for it. Leaving more bills to our children, regardless of which government account is used, doesn’t negate that fundamental logic.
RIJ: Thanks, Gene, as always.
© 2020 RIJ Publishing LLC. All rights reserved.

Never before have I seen a market so highly valued in the face of overwhelming uncertainty. Yet today the U.S. stock market stands at nosebleed-inducing levels of multiple, whilst the fundamentals seem more uncertain than ever before. It appears as though the U.S. stock market has drunk from Dr. Pangloss’ Kool-Aid – where everything is for the best in the best of all possible worlds. It is as if Mr. Market is taking a tail risk (albeit a good one) and pricing it with certainty.
Now let me be clear, I don’t claim to know the answers to any of the deep imponderables that face the world today. I have no idea what the shape of the recovery will be, I have no idea how easy it will be to get all the unemployed back to work. I have no idea if we will see a second wave of Covid-19 or what we will do if we do encounter such an event. But I do know that these questions exist. And that means I should demand a margin of safety – wriggle room for bad outcomes if you like. Mr. Market clearly does not share my view.
Instead, as best I can tell, the driving narrative behind a V-shaped recovery in the stock market seems to be centered on “The Fed” or, even more vaguely, “liquidity creation.” It is tricky to argue for any direct linkage from the Fed’s balance sheet expansion programs to equities. The vast majority of QE programs have really been about maturity transformation (swapping long debt for very short-term debt). Nor can one claim a good link between QEs to yields to equities.
In fact, during each of the three previous waves of QE, bond yields actually rose. In addition, yields around the world are low but you don’t see other equity markets sporting extreme valuations. So, I think that Fed-based explanations are at best ex post justifications for the performance of the stock market; at worst they are part of a dangerously incorrect narrative driving sentiment (and prices higher).
The U.S. stock market looks increasingly like the hapless Wile E. Coyote, running off the edge of a cliff in pursuit of the pesky Roadrunner but not yet realizing the ground beneath his feet had run out some time ago.
Investing is always about making decisions under a cloud of uncertainty. It is how one deals with the uncertainty that distinguishes the long-term value-based investor from the rest. Rather than acting as if the uncertainty doesn’t exist (the current fad), the value investor embraces it and demands a margin of safety to reflect the unknown. There is no margin of safety in the pricing of U.S. stocks today. Voltaire observed, “Doubt is not a pleasant condition, but certainty is absurd.” The U.S. stock market appears to be absurd.
Click here to read the entire blogpost.
© 2020 GMO LLC.

During a severe recession or financial crisis, the necessary conduct of the federal government’s fiscal policy may be metaphorically compared to the response of a homeowner whose house has caught fire because of faulty wiring. The first step is not to sue the contractor or lobby for stronger building codes; the fire has to be extinguished first.
So it is with fiscal policy at the moment. The immediate goal of fiscal policy should be to provide more stimulus; shrinking the deficit can come later. More stimulus is needed for two reasons: First, policies of social distancing and localized lockdowns reduce demand not only for services in such sectors as dining out and entertainment, but also for the goods and services that are not directly affected, because unemployed restaurant and travel sector workers cannot afford them.
Second, no one thinks that the unemployed should suffer needlessly. But how much stimulus should they receive? Consider the cost of paying 30 million unemployed an extra $600 a week for just two months. That’s about $5,000 per person, for a total of $150 billion. Unemployment is expected to drop, but how fast is highly uncertain, and it is easy to see how this figure could grow.
Similarly, the revenues of states and cities can be expected to be below normal for some time to come, and this shortfall will by no means be confined to “blue” states. Landlords, particularly small ones and small business owners, may also need assistance. So continued stimulus and a flexible attitude to providing it will be called for.
Eventually, the economy will recover, and the need for stimulus will abate. However, federal debt has already grown substantially as a percentage of GDP, and will grow further. Deficits, even with declining stimulus money, will remain high.
The federal government faces the challenge of supporting a recovery without sparking inflation. The pandemic has obviously affected household, corporate, and state and local budgets. Some, perhaps most, of these effects may be reversed as the economy recovers, but others may not, and fiscal policy must take the irreversible effects into account.
In addition, changes in the political climate may lead to pressures for new expenditure programs or expansions of existing ones. Finally, interest rates may rise, which will constrain how expansionary fiscal policy can be.
The consequences of changes in household spending patterns. A recovery in spending on dining out, travel and other pandemic-affected services is likely to occur as economic recovery takes hold. However, the rebound in spending on the directly affected services will probably not be complete.
Households who have discovered the convenience and lower cost of shopping online may not revert to their old habits. Similarly, lingering fears of contagion may keep many cautious people at home, and home-cooked meals may become a preferred alternative to eating out. Many households may also try to build up or reconstitute emergency reserves.
In addition, the increase in online teaching may not be fully reversed. If it costs less than in-person instruction, virtual education will benefit both state and local budgets. If some of the cost reduction is passed on to students and their families, it will benefit household budgets as well.
More online teaching could also entail a decline in construction of new educational facilities, especially at the university level, where online teaching is less disruptive to the work-life balance of parents. If a decline in expenditure in that area isn’t offset by increases in other areas, and if household saving increases, it could create space for more governmental spending at the federal, state and local level.
Consequences of the impact on private commercial investment: The boom in online spending will probably reduce investment in business construction. Investment in bricks and mortar retailing, already on the decline, will be further affected. This decline isn’t likely to be offset by increases in expenditure on new facilities by the big online retailers. A similar effect may occur from an incomplete reversal of the recent shift to working from home. Demand for public transportation may also decline (although car sales may increase), which would benefit state and local government budgets.
Repercussions of the current political climate: A change in administration could lead to an increase in public health expenditure, either via an expansion of the Affordable Care Act, an increase in the numbers of Americans covered by Medicare, or an improvement in the quality of that program’s coverage.
Serious steps to deal with the country’s income disparities could also lead to both increases in investment in vocational and academic education, as well as changes to the income tax system that make it more progressive. More liberalized grants and loans for students and their families are another possibility.
Interest rates: Despite the major increase in government debt, interest rates have remained low. The increase in borrowing by the federal government has been financed by increased private domestic saving (some of it generated by the increase in incomes associated with the stimulus) as well as by foreign saving. Rates aren’t likely to remain low forever, however, particularly if the economic recovery is robust.
Higher rates will restrict the options for fiscal policy because of their impact on interest expenditure and the stock of federal debt, and may crowd out some interest-sensitive private spending, like housing construction. Rising rates could be a sign that the economy is starting to overheat, sending a signal that the monetary and fiscal stance needs to be tighter.
The net effect on the fiscal stance: President Harry Truman, after listening to economists set out the consequences of alterative policies—“on the one hand… but on the other”—is famous for pining after a “one-handed economist.” But desirable though one-handedness may be, these are remarkably uncertain times, and it would be foolish to recommend a rigid course for fiscal policy.
That said, some conditional conclusions on the desirable course of fiscal policy may be drawn. It is likely, though not certain, that the pandemic’s depressing effects on private expenditure would create room for an increase in expenditure on social programs.
Continued low interest rates would argue for more spending on public infrastructure. However, we need to recognize that a strong recovery’s impact on inflation would require some tightening of monetary policy, accompanied by less government spending. Given how low inflation is at the moment, and the pain that would be inflicted on American society by a faltering recovery, it may be best to risk an uptick in inflation.
Both fiscal and monetary policy will have to be far-sighted and nimble. As time passes, it should become obvious which of the pandemic’s depressive effects on private spending will have been reversed, and by how much. The federal government’s budget is not by its nature a flexible policy instrument—at least, not compared with monetary policy—but both the overall level and composition of expenditure will need to adjust as our knowledge of the effects of the pandemic grows.
© 2020 RIJ Publishing LLC. All rights reserved.

Baby boomers who are near or in retirement face particularly nasty tradeoffs these days. They need reliable income, but bond yields are low. They need upside, but the recession makes equities look doubtful—their current Fed-fueled buoyancy notwithstanding.
There are no silver-plated solutions that advisers can offer their clients in the newest “new normal.” But advisers need tools that will nudge clients into “staying the course.”
A variety of risk managed products from asset managers and life insurers might fill the bill. Nationwide’s Risk-Managed Income ETF (NUSI), launched last December, aims to check several boxes at once. Client assets are invested in the stocks of the tech-heavy NASDAQ-100. This position is overlaid with a “protective net-credit collar.”
NUSI’s most eye-catching feature, however, involves income. The fund pays out a monthly distribution composed of dividends, a premium (“net credit”) from the options trades, and, if necessary, a bit of fund’s assets; the annual expense ratio is 0.68%.

Jonathan Molchan
“The goal is to generate income, protect against market downturns, and over time to smooth the return profile so that it can support a seven to eight percent annual yield,” said Jonathan Molchan, the lead portfolio manager of NUSI at the subadvisor of the fund, Harvest Volatility Management in New York, which executes the collar strategy for Nationwide.
Since its inception last December, NUSI has paid its shareholders 0.65% of assets per month, or a respectable 7.88% per year. In addition, its NAV (net asset value) is up about 10% since January 1, for a total return of about 17%. In March 2020, when the S&P 500 dropped 30%, NUSI was down only about 10%.
How NUSI works
If you’re at all familiar with options (and if you read Nationwide’s NUSI whitepaper), NUSI won’t be hard for understand (though your clients might struggle with the concept.) It has some wrinkles that may require some re-reading, however. Here’s how it works:
Step One. The fund directly owns all 100 stocks in the NASDAQ-100 index, but not by purchasing the QQQ ETF. The five biggest stocks in this tech-heavy, non-financial index are Apple, Microsoft, Amazon, Facebook and Alphabet (Google).
Step Two. Each month, the options writer (Nationwide outsources this function to Harvest Volatility Management) sells covered calls on the NASDAQ-100 that are near-the-money or slightly out-of-the-money. In other words, the fund manager sells a counterparty the right to buy the NASDAQ-100 Index at a price slightly higher than the current price.
Step Three. The fund manager uses part of the revenue from the sale of the covered call (“covered” means that the fund already holds the underlying securities as collateral) to buy out-of-the-money puts on the NASDAQ-100. This puts a floor under the losses the fund can suffer if the NASDAQ-100 goes down.
Step Four. Investors receive monthly distributions consisting of the net credit that’s left over after selling the covered call and buying the protective put, plus the dividend yield of the stocks in the NASDAQ-100 (about 0.75% a year).
“The fund has a managed distribution of 65 basis points of month,” Molchan told RIJ. “The composition of the distribution can change; it’s comprised of premium from net gain on the options, dividends, and appreciation of the underlying investment. Based on the rules-based mechanism we use, the sale of the call and purchase of the put should always generate a net credit. If it comes up a little short, you turn to the dividends and potential capital gain.”
Step Five. Any net realized capital gains are distributed annually. Any excess premium from the sale of the covered call each month is reinvested in the fund.
What could go wrong?
Sounds good so far; what could possibly go wrong? In a rising market, any gain in the NASDAQ-100 above the strike price would normally accrue to the purchaser of the covered call—at the expense of the NUSI shareholders. To prevent that potential disaster, the NUSI fund manager (responding to a signal from NUSI’s hedging model) “closes the call option” by buying it back. (Since he used a “European call,” he can do that.) The NUSI investor benefits from any subsequent growth in the NASDAQ-100 index.
This year, NUSI paid out about 16 cents a share (0.65% of the ~$25 share price) per month. In March, during the crash, the distribution dropped to about 15 cents. During the recovery since the crash, the distribution has risen to almost 17 cents.
So someone owning 1,000 shares (worth about $25,000) would have received $150 to $170 per month. At that rate, the annual payout would be about $2,000. In addition, the fund has appreciated by about 10% so far this year. The fund’s total return since inception last December has been about 18%.
Of course, there’s the potential for disappointment or, if you prefer, Fear of Missing Out (FOMO). A NUSI investor is invested in the NASDAQ-100 stocks, but the cost of the protective collar meant that the fund captured about 60% of the 31% gain of QQQ shares so far this year.
“With the downside protection you lose less on the way down, and you have the ability to uncap in a rising market. That gives you a return profile that seeks to smooth out the distribution of returns,” Molchan said.
“This strategy is not new. Institutions and hedge funds have used it for decades. Similar strategies have been around since the 90s. It’s just an institutional quantitative twist on combining two popular options strategies and bringing them to market in an ETF wrapper. A strategy that would have involved multiple trades for an institution or hedge fund is now a packaged product for retail investors.”
The monthly reset of the options and the dynamic nature of the rules-based nature of the hedging makes the fund relatively nimble. With a monthly horizon, it also avoids the duration and credit risks of a bond fund.
Of course, the NASDAQ-100 has soared this year, and the capital appreciation has helped NUSI hit its aggressive distribution target. Could the fund continue to pay out almost 8% a year in a flat or declining market without running down principal within just a few years? “There’s a measure of downside protection every month,” Molchan told RIJ. “Whether the NASDAQ-100 return is 7% or 17%, the mechanism is designed to support the dividend, satisfy the income needs of the client, and reduce volatility.”
In a flat market, according to Nationwide illustration, NUSI’s covered call options don’t generate as much premium, because volatility is low and there’s less demand for protection. In a down market, NUSI’s downside protective put means fewer losses to overcome when markets rebound.
Alternative solutions
Nationwide is positioning NUSI as a complement to a 60/40 balanced fund, and as an alternative to other strategies that investors use when reaching for yield—high-yield bonds, emerging market bonds, real estate investment trusts, and master limited partnerships.
NUSI will presumably compete with other structured solutions that asset managers and life insurers have placed on the market. One potential competitor would be registered index-linked annuities, or RILAs, which have enjoyed steadily rising sales since they were introduced by Equitable (then AXA) in 2011.
Also known as structured variable annuities, these are general account products—the underlying assets are fixed income investments in a life insurer’s general account—that offer interest returns up to cap and down to a “floor” or “buffer.”
Their options strategy is the reverse of NUSI’s. The fund manager typically sells a put (setting a downside buffer that eliminates the first 10% in losses, say) and then uses the premium and interest from the general fund to buy a call spread (setting an upside cap on gains).
Several life insurers also sell structured ETFs. This spring, Allianz Life and New York Life both introduced these products, which use so-called FLEX options. According to the Options Clearing Corporation, these are “customizable products where the investor can set the terms for the tradable contract and have the security of an exchange-traded product.”
In addition, “The exercise style, expiration date and strike price can all be chosen by the investor to create a new product that is not currently being traded at an exchange. In general, investors set the criteria and have their brokerage firm solicit the best possible market-price from different market participants.”
Innovator Capital Management introduced the first structured ETF, based on movements of the S&P 500 Index, two years ago. These “Defined Outcome” funds use a FLEX options strategy designed by Milliman, the global actuarial consulting firm. Just this week, the Innovator 20+ Year Treasury Bond 5 Floor ETF – July and the Innovator 20+ Year Treasury Bond 9 Buffer ETF – July were launched and listed on the Cboe.
The first seeks to provide exposure to the upside performance of the iShares 20+ Year Treasury Bond ETF (TLT) to a cap and a floor against downside losses in excess of 5% over the outcome period. The second seeks to provide exposure to the upside performance of TLT to a cap and a buffer against the first 9% of price losses over the outcome period.
Any and all of these products imply a bet that volatility in equities and low interest rates will dominate the marketplace for the foreseeable future. You wouldn’t put all of your money into one of these products. But taking a modest position probably wouldn’t hurt. The future is about as inscrutable as it could possibly get.
© 2020 RIJ Publishing LLC. All rights reserved.
The Fed may have saved the stock market last spring with its zero interest rate policy, but the annuity market paid the price. Total annuity sales were $48.6 billion in 2Q2020, down 24% from 2Q2019, according to the Secure Retirement Institute (SRI) U.S. Individual Annuity Sales Survey.
Registered index-linked annuities (RILAs) were the only major product line to record positive growth in the second quarter. RILA sales were $4.5 billion in the second quarter, up 8% from second quarter 2019. This marks the 22nd consecutive quarter-over-quarter growth for RILA sales. Year-to-date, RILA sales were $9.4 billion, up 22% from the first half of 2019.
“Bank sales of RILAs dropped 15% in the second quarter while independent and full-service national broker dealers’ sales increased 7% each and represented more than half of the RILA sales for the quarter,” said Todd Giesing, senior annuity research director, SRI, in a release. “Banks traditionally have a more conservative client base, which had them gravitate to other protection-based products in response to the unfavorable economic conditions.”
“The global pandemic presented unique challenges to annuity distribution in the second quarter,” said Giesing. “Aside from the economic impact, social distancing disrupted business operations for companies and advisors over the past three months. The focus this quarter was on protection-based solutions as equity market volatility had investors seeking safety.”
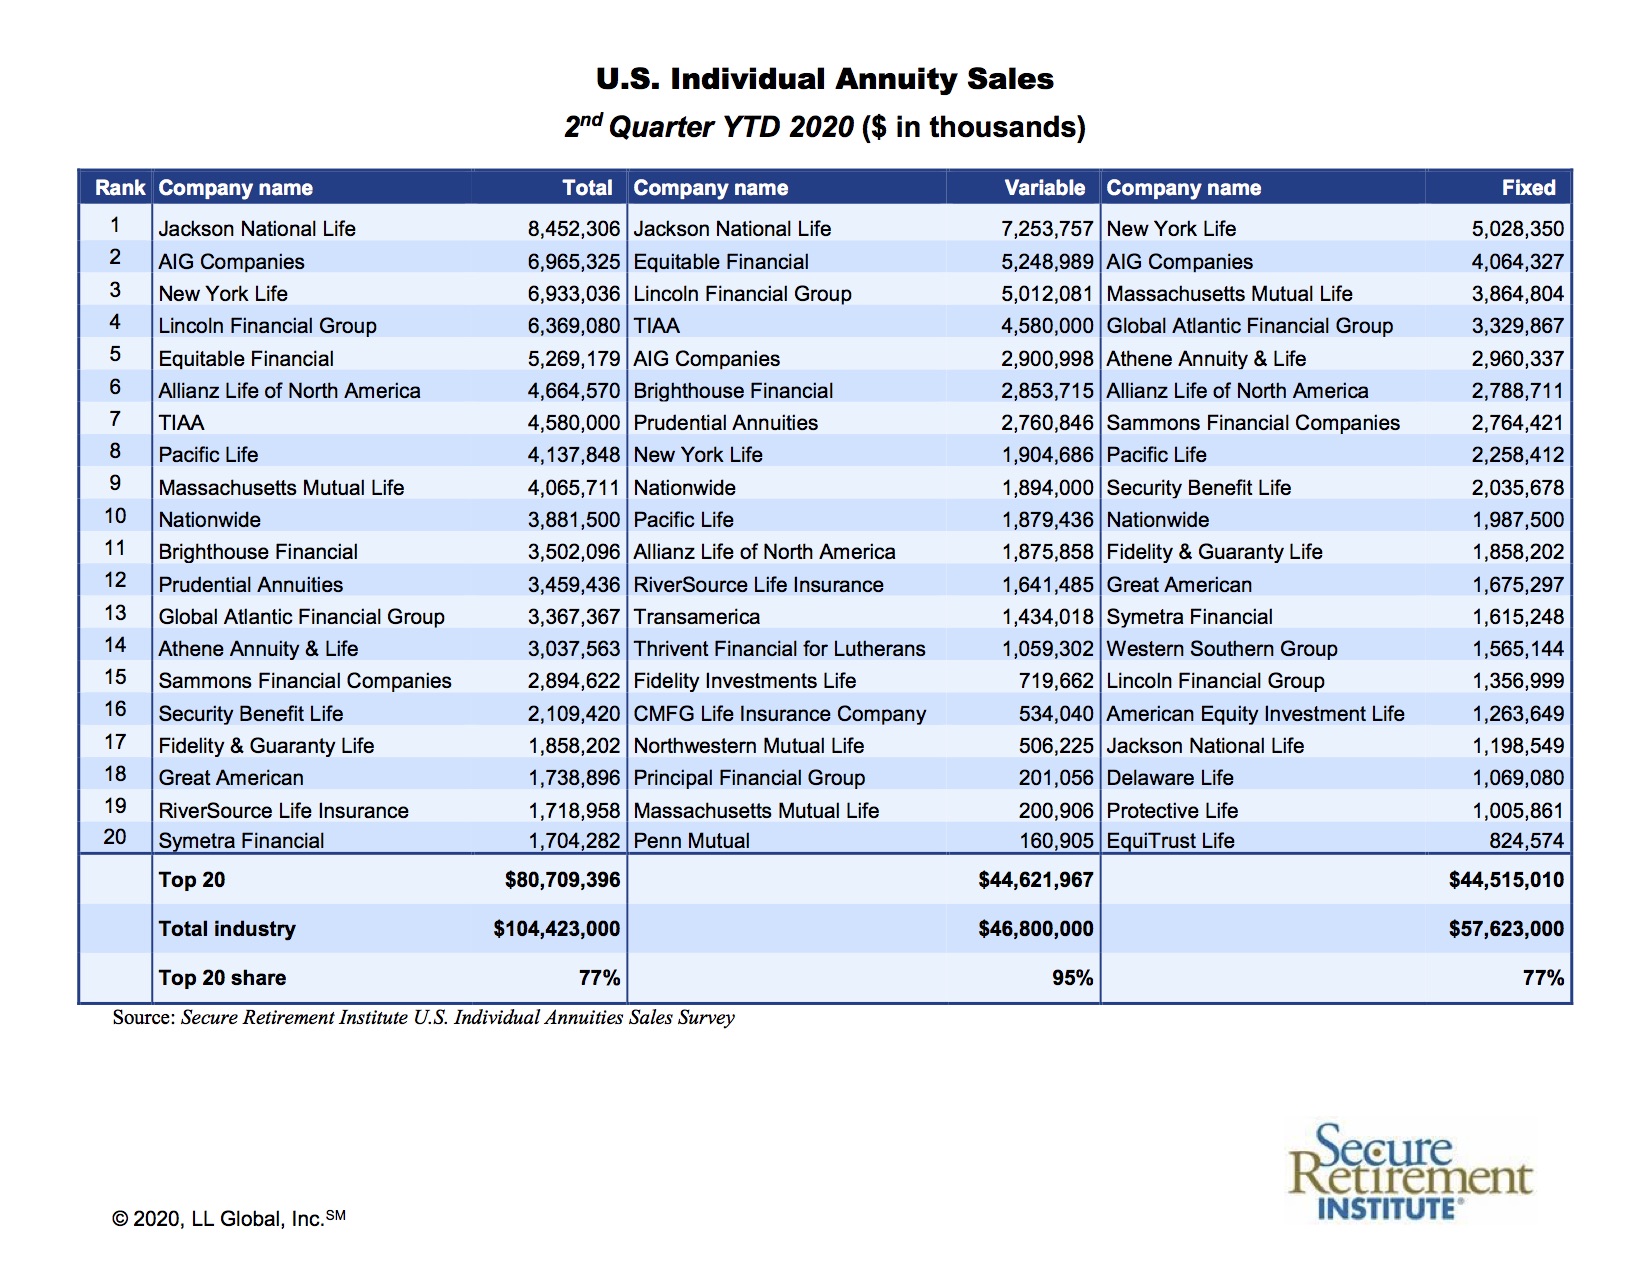
Seeking shelter
Fixed-rate deferred annuity sales were $12.8 billion, down 2% from prior year. However, fixed-rate deferred sales jumped 31% compared with first quarter 2020 results. Despite the rapid declines in interest rates, year-to-date fixed-rate deferred annuity sales totaled $22.6 billion, down 20% from than prior year.
“While low interest rates dampened fixed-rate deferred annuity crediting rates, sales climbed from the first quarter as investors pursued short-term safety,” said Giesing. “We did see a significant shift in distribution in the second quarter, as the broker-dealer channels drove fixed-rate deferred sales growth.”
Broker-dealers accounted for 50% of fixed-rate deferred annuity sales in the second quarter, up 11 percentage points from 39% in the first quarter. Last year, broker dealer channels only accounted for 29% of overall fixed-rate deferred sales. “This shift suggests Americans continue to be concerned about the economic impact of the pandemic and are seeking short-term solutions to preserve and protect their savings,” Giesing noted.
In the first six months of 2020, total annuity sales were $104.4 billion, 16% lower than prior year.
Lowest VA sales since 1996
Despite the growth in RILA sales, total variable annuity (VA) sales dropped 19% in the second quarter to $20.8 billion, representing the lowest quarterly VA sales since 1996. VA sales were $46.8 billion in the first half of 2020, down 4% from the first half of 2019.
Total fixed annuity sales were $27.8 billion, down 27% from prior year, driven by a significant drop in fixed indexed annuity (FIA) sales. Year-to-date, fixed annuities totaled $57.6 billion, 24% lower than the first half of 2019.
FIA sales fell 40% to $12 billion in the second quarter, representing the lowest quarterly total for FIAs since first quarter 2015. FIA sales declined 26% in the first half of 2020 to $28.2 billion.
“In this continued ultra-low interest rate environment, accumulation-focused FIAs without guaranteed lifetime benefit riders (GLB) experienced a significant decline in the second quarter, down 42% compared with prior year,” noted Giesing. “FIA manufacturers continue to lower crediting rates, making other protection-based solutions, such as fixed-rated deferred and RILAs, more attractive.”
Low interest rates continue to inhibit income annuity sales. Single premium immediate annuities (SPIAs) were $1.4 billion in the second quarter, 48% below sales in the second quarter of 2019. This is the lowest quarterly level of SPIA sales in 13 years. Year-to-date, SPIA sales were $3.3 billion, down 40% compared with the first six months of 2019.
Deferred income annuity (DIA) sales were $353 million in the second quarter, less than half of sales recorded in the second quarter of 2019. Year-to-date, DIA sales were $823 million, 39% lower than prior year results.
Second quarter 2020 annuities industry estimates represent 95% of the total market. A summary of the results can be found in LIMRA’s Fact Tank.
To view the top 20 rankings of total, variable and fixed annuity writers for the second quarter 2020, please visit Second Quarter 2020 Annuity Rankings. To view the top 20 rankings of only fixed annuity writers for the second quarter 2020, please visit Second Quarter 2020 Fixed Annuity Rankings.
© 2020 RIJ Publishing LLC.
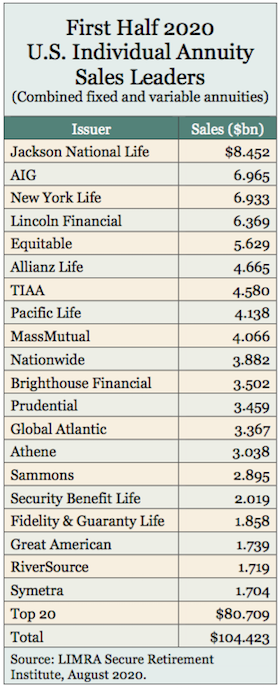
Morningstar, Inc. this week reported estimated U.S. mutual fund and exchange-traded fund (ETF) flows for July 2020. Overall, long-term mutual funds and ETFs collected $43 billion in July, marking their fourth consecutive month of inflows. Total inflows from April through July were $164 billion, slightly more than half of the $327 billion of outflows that affected those funds in March.
Highlights from Morningstar’s report about U.S. fund flows for July 2020 include:
Taxable-bond funds continue to see strong inflows, gathering $86 billion in July. This is the group’s second-highest monthly tally behind June’s $92 billion record. In contrast, U.S. equity funds had record outflows of nearly $46 billion in July, and their $147 billion of outflows for the year to date puts the group on track for its worst annual outflows ever, surpassing 2015’s record outflows of $63 billion.
Sector-equity funds continue to attract investors and collected $3 billion of inflows in July. Investors have targeted sectors such as technology and health that could benefit from social distancing policies, work-from-home arrangements, e-commerce, and the search for a coronavirus vaccine. However, investors dropped out of sectors hit hard by government-imposed lockdowns or weak demand, including real estate and natural resources.
Commodities funds posted another strong month in July, drawing in $8 billion and bringing year-to-date total inflows to nearly $39 billion. Investors continued to seek protection in precious-metals funds, pouring $4.0 billion into SPDR Gold Shares and a total of $3.5 billion into iShares Gold Trust and iShares Silver Trust.
Morningstar debuted two environmental, social, and governance (ESG)-related data points to its fund flows analysis in July: the Morningstar Sustainability Rating and Morningstar Low Carbon Designation. U.S. equity funds with 4- or 5-globe ratings and a Low Carbon Designation have had net inflows thus far year-to-date in 2020, while most other combinations saw net outflows for the same period.
Among fund families, iShares topped the list with $19 billion of inflows in July. Much of that went into taxable-bond funds, including investment-grade and high-yield corporate-bond ETFs. The Federal Reserve continues to be active in those segments, but its purchases do not account for the majority of iShares’ flows. Meanwhile, many active managers saw outflows, including Dimensional Fund Advisors, American Funds, Oakmark, and Primecap.
Recent macroeconomic uncertainty due to the COVID-19 pandemic is a concern for insurers’ balance sheets as corporate bonds constitute a majority of the insurance industry’s assets, according to a new AM Best special report.
The Best Special Report, titled, “Corporate Bond Holdings Pose Risk to Insurers’ Balance Sheets,” states that the corporate bond sector has been hit on two different fronts.
Corporate bonds account for nearly 70% of the bond portfolios of each of the three insurance segments. Bonds from industries such as services, manufacturing, retail, energy and public utilities will be affected more negatively than others. Many of these sectors already had heightened below-investment-grade ratings as of year-end 2019.
According to the report, the leverage bubble may have led to a downward migration in credit quality, but the pullback in consumer demand is likely to exacerbate the credit crisis for borrowers.
State shutdowns have sparked a rise in new bond sales, driven by companies trying to borrow their way through the economic downturn. The shutdowns also have driven a surge in the number of bonds trading at distressed levels, with a greater potential for defaults. Companies with heightened exposures to the aforementioned vulnerable industries will be at a higher risk of experiencing downgrades and defaults.
In aggregate, the industry’s exposure to these sectors appears to be modest; however, individual insurers with larger allocations to these industries may face balance sheet risks.
Less than 20% of the bond portfolios of almost 90% of the property/casualty and health rating units are allocated to these sectors, versus just 47% of life/annuity (L/A) rating units. The 20 rating units with the largest exposures to the high-impact sectors are predominantly L/A companies. Some insurers also have large amounts of below-investment-grade assets in these sectors, although less than 2% of the rated companies have exposures that exceed 20% of capital and surplus.
If liquidity becomes a factor for many U.S. bond holdings, the macroeconomic environment could prompt many insurers to re-evaluate portions of their asset holdings and lead to redistribution across market sectors and risk classes.
Charles Schwab has launched a free digital financial planning tool designed to help investors establish and stay on track toward their personalized retirement goals. Called the Schwab Plan, the service is available to all Schwab retail clients with no minimum asset requirement.
“With this move, Schwab is now the only large retail brokerage to offer complimentary financial planning to all clients, combined with no account minimums for individual investors, zero commission online equity, option and ETF trades, and a satisfaction guarantee,” a Schwab release said.
To begin the planning process, clients complete a short questionnaire, and in as little as 15 minutes they can generate a retirement plan that shows retirement goals and probability of funding those goals, a comparison of an individual’s current asset allocation to a recommended allocation based on plan inputs, and suggested next steps.
Schwab Plan can also aggregate and factor in accounts held outside of Schwab. While Schwab Plan is available to clients at no cost, any investments they ultimately make may incur costs such as fund operating expenses and advisory fees.
Schwab Plan’s algorithm considers a range of variables, such as desired retirement age, retirement goals, social security expectations, portfolio risk profile and asset allocation, and various income sources.
In conjunction with the launch of Schwab Plan, Schwab has also created an online Financial Planning Hub that features an array of goals-based calculators, tools, and educational planning content to help investors get quick answers on topics such as retirement, saving for college, and buying a home.
Investors can find out if they are saving enough for retirement, determine how much they can afford to withdraw in retirement, get an estimated monthly college savings goal, and plan for a home purchase using a mortgage calculator. The Financial Planning Hub is available to both Schwab clients and non-clients.
In March 2019, Schwab, in its capacity as a registered investment advisor, introduced Schwab Intelligent Portfolios Premium, a digital subscription-based financial planning and automated investing service which provides unlimited access to a Certified Financial Planner, interactive planning tools, and a personalized roadmap for reaching financial goals.
Schwab Intelligent Portfolios Premium charges an initial one-time $300 fee for planning and a $30 monthly subscription after that ($90 billed quarterly), which does not change at higher asset levels. Investors who prefer a more in-depth or one-on-one planning experience can work with a financial consultant in a local Schwab branch.
Stock market gains and steady investor behavior drove a 20% increase in contributions to traditional and Roth IRAs in the second quarter of 2020, Fidelity Investments reported this week. Contributions to 401(k) and 403(b) accounts, from employees and their employers, remained steady.
“Nearly 90% of employers continued to offer matching contributions to their employees over the last quarter, despite the unsteady business landscape,” said Kevin Barry, president of Workplace Investing at Fidelity Investments.
Highlights from Fidelity’s Q2 2020 analysis include:
The average IRA balance was $111,500, up 13% from 1Q2020 and slightly higher than the average balance of $110,400 a year ago. The average 401(k) balance increased to $104,400 in Q2, a 14% increase from Q1 but down 2% from a year ago. The average 403(b) account balance increased to $91,100, an increase of 17% from last quarter and up 3% from a year ago.
More than three quarters (76%) of workers received an employer contribution in Q2, with the average employer contribution reaching $1,080. Over the last four quarters, a record 88% of 401(k) savers received an employer contribution, with employers contributing an average of $4,030 per account over the last 12 months.
While organizations across the country were taking steps to address the financial impact of the economic downturn, Fidelity found that only 11% of employers suspended their 401(k) company match in Q2. Of the 11% of employers that suspended their company match, 32% indicated they plan to reinstate their match in the next year and 48% plan to reinstate as soon as financially possible. Only 6% of employers indicated they currently have no plans to reinstate their match.
Extended tax season saw record flows into IRAs and other retail retirement accounts. Investors continued to leverage IRAs and other retail retirement accounts, including SEP, SIMPLE and Rollover IRAs, as the extended tax season helped contribute to a record $82.1 billion going into these accounts through July of 2020.
IRA contributions in the first half of 2020 were up 22% from this time last year, with an 18% increase in the number of contributing accounts. Contributions to Roth IRAs were up 33% and participation up 25% from the same time last year. Overall, new IRA accounts opened in the first half of 2020 were up 33% over last year.
Almost nine out of 10 individuals (88%) contributed to their 401(k) in Q2, a slight drop from last quarter’s record high of 89% but still in the top five averages since 2002. Less than one percent (0.8%) of 401(k) savers stopped saving in the quarter, while 9% increased their contribution rate.
Among 403(b) accounts, 96% of individuals either maintained or increased their contribution rate in Q2. Among 403(b) accounts specifically in the health care industry, which includes workers at hospitals and health networks, 96% of individuals maintained or increased their contribution rate in Q2.
The past quarter saw Millennials maintain a focus on contributing to their retirement accounts, with the number of IRA accounts owned by Millennials in Q2 2020 increasing by 23% since Q2 2019. In particular, Millennials continued to prefer investing in Roth IRAs, with a 36% year-over-year growth in the number of contributing accounts and a 50% increase in the amount of Roth IRA contributions.
Investors continue to use managed accounts for retirement savings. More than 25,000 individuals enrolled in Fidelity’s Personalized Planning and Advice at Work managed account solution in Q2, bringing the total number of enrollees to more than 60,000 year to date and representing over $3 billion in 401(k) assets. In addition, visits to Fidelity’s Planning and Guidance Center, which helps create a strategy for retirement savings, increased 22% in Q2 compared to a year ago. In June alone, visits to Fidelity’s website for individuals saving within a 401(k) or 403(b) increased 42% over June of 2019.
The CARES Act was signed into law in late March 2020 in response to the economic fallout of the COVID-19 pandemic. By early April, 98% of Fidelity’s workplace clients had adopted the CARES Act distribution provisions, which allowed their employees to tap their savings to cover financial needs related to the economic downturn.
As of the end of Q2, 711,000 individuals had taken a CARES Act distribution from their retirement account, which represents 3% of eligible employees on Fidelity’s workplace savings platform.
The overall average withdrawal amount was $12,100, while the median withdrawal amount was $4,800. Individuals continued to seek out information on the CARES Act and COVID-19 issues, as Fidelity’s COVID-19 information website was viewed more than 1.3 million times in the quarter.
Prudential Retirement, a unit of Prudential Financial, Inc. (NYSE: PRU), has completed its fourth and final pension de-risking transaction with Boise Cascade Company (NYSE: BCC), the Idaho-based wood products manufacturer and building materials distributor.
Prior to this final transaction, Boise Cascade had transferred U.S. pension plan assets to Prudential in three phases: $152 million in April 2018; $125 million in August 2018; and $20 million in September 2019.
“The final transaction in our three-year engagement with Boise Cascade represents the first time a plan sponsor has been able to guarantee the cost of a plan termination early in the lengthy termination process by transferring all of the risks to an insurer,” Peggy McDonald, senior vice president and actuary, Prudential Retirement’s Investment & Pension Solutions, said in a release.
The transaction used one of three structures for plan termination examined by McDonald and the Prudential Retirement Pension Risk Transfer team. Those structures will be described in an upcoming white paper, “Unlocking Value in Pension Plan Terminations.”
“Until now, plan sponsors haven’t been able to calculate the actual cost of unwinding a plan until the end of the termination process, which can take a year or more,” McDonald said. “This approach provided Boise Cascade with cost certainty early in the process by securing a buy-in contract under which Prudential assumes the lump sum election rate risk.”
SIMON Annuities and Insurance Services LLC has expanded its product shelf by adding Symetra Life’s fixed indexed annuities and structured variable annuities to the SIMON annuities platform and digital marketplace for wealth managers, SIMON announced this week.
Both Symetra product lines are now available on SIMON’s Marketplace, which provides pre- and post-sale analytics to financial professionals serving the retirement needs of clients. The Symetra product lineup will expand to include fixed annuities later this year.
Advisers can now explore Symetra annuity products and features, run allocation and income analytics, and access product-specific marketing literature from within SIMON’s interactive platform.
The Department of Labor has issued a 112-page “interim final rule”—still subject to amendment in response to public comment, but final if not amended—that implements legislation requiring defined contribution plans to include “lifetime income illustrations” in an annual plan benefit statement.
These illustrations are intended to give plan participants an idea of how much monthly income their DC savings could generate, based on certain assumptions specified in the rule.
The idea—a logical idea, because policymakers have decided that participants should think of their DC savings as income, not only as lump sums—was to show participants where they stand at the moment in terms of preparing financially for retirement.
But this rule isn’t particularly helpful, and even though it might be amended after the upcoming public comment period, it might not be.
The rule merely tells participants (or a participant and spouse)—no matter if they’re 25 years old today or 65 years old or any age in between–how much income their current savings would buy if they were reaching retirement age today, and bought an annuity at today’s interest rates and annuity prices.
“Income illustrations are potentially important for our quest to expand lifetime income in the DC system,” former senior Treasury official and current Brookings Institution nonresident senior fellow Mark Iwry told RIJ this week. But he urges that Labor’s final rule also encourage plans to include income illustrations based on the projected size of account balances at retirement age, which he advocated when he served in the Obama administration.
“Labor can find authority under the SECURE Act to protect plan sponsors from liability for providing these much more helpful projections. The Act did not explicitly limit liability protection for plan sponsors to illustrations based on current account balances as opposed to both current and projected future balances.
“The language should have explicitly protected and encouraged such projections, but it was not explicit in either direction. Yes, Congress also had other fish to fry—though it wouldn’t have taken much extra effort to fry this guppy,” he said.
In any event, Iwry believes Labor has implicit statutory authority, as it did before the legislation, but “might have hesitated, at the interim rule stage, to include liability protections for appropriate projections because it first wanted to see whether the upcoming public comment process would lay a sufficient foundation in the public record regarding need, demand, and rationale.”
In its interim final rule, the DOL provides the example of a 40-year-old woman with current savings of $125,000. Then it shows that if she were 67 today (her intended retirement age), and paid $125,000 to a life insurer for an annuity today, she would receive $645 per month for life (or $533 per month if she bought a joint-life annuity for two people).
That’s a fairly useless number. It won’t help participants project the amount of savings they might accumulate by the time they retire if they keep saving at the current rate, or how much they might be able to generate from those savings.
Rough projections, though admittedly impossible to make precise because the future is unpredictable, would at least give the participant a target number to aim for, and an idea of the savings rate necessary to reach their goals.
In fact, some DC plans already do that. The Social Security Administration has done that. And the DOL even has a calculator on its website that helps people do that. But, as Iwry speculates, some of DOL’s regulation writers may feel that if Congress wanted them to include projections in the regulations, it would have been more helpful to have spelled this out explicitly and therefore DOL’s decision on this is being put off to the final rule.
There’s a back story to all this. The idea of requiring DC plans to disclosure turns out to be more controversial than it might look, for these reasons:
There’s also the small problem that, for several reasons, very few Americans ever actually buy the kind of annuities that the DOL wants DC plans to illustrate. Those are fixed life annuities, either immediate (income starts soon after purchase) or deferred (income starting more than 13 months after purchase).
Someone might also mention that participants rarely read their 401(k) disclosures. The people who do probably don’t need any nudge toward saving more for retirement.
All of these issues help explain why the government has kicked this idea down the road for 11 years. It was first proposed in 2009 after Barack Obama was elected. Phyllis Borzi, then a DOL assistant secretary, and Mark Iwry, then senior advisor to the Treasury secretary, both thought it was a great idea. But in 2010 the Democrats lost control of the House of Representatives for eight years. Battles over the Affordable Care Act sidelined most retirement legislation.
Projections of future income were always envisioned. In 2013, retirement consultant, researcher and former senior Treasury official Mark Warshawsky wrote in Institutional Investor magazine:
“If a married participant aged 45 has $125,000 in her 401(k) account and the plan has a normal retirement age of 65, the projected balance would be $557,534 at retirement. Two monthly lifetime non-inflation-indexed annuity streams of payments would be shown, as if the participant were now 65 — $564, based on the current balance and estimated current annuity rates, and $2,514, based on the projected balance.”
More recently, Iwry and two Brookings Institution colleagues evaluated the income disclosure recommended by the RESA Act in 2019 (a predecessor of the SECURE Act), and warned in a whitepaper that:
“an illustration based only on the current account balance is less useful than the combination of that illustration and another that converts a projected future account balance to its income equivalent (while emphasizing the speculative nature of the assumptions and hence the merely illustrative nature of the projections).”
The new rule only indirectly addresses the idea that projections would make the required disclosure more useful in terms of helping a participant get ready for retirement. On page 60, the DOL writes:
“The ability to incorporate social security projections and IRAs; customize assumptions to see the impacts of those changes on the projected lifetime income streams; show the integrated effects of in-plan annuity investment options combined with other plan investments; estimate the gaps between projected monthly incomes at retirement and the desired monthly incomes; provide education about how to close those gaps, and personalize future draw-down strategies that incorporate social security and other retirement assets. Although these flexible and customizable features are likely to better engage participants, and thus, better prepare them for retirement, a recordkeeper can satisfy the conditions set forth in the [interim final rule] without these flexible and elaborate features. [Emphasis added.]
Still, government officials like to avoid “sacrificing the good for the perfect.” Former Labor assistant secretary Borzi told RIJ this week that the rule might encourage more savings:
“I surely hope this may provide the nudge that some folks need. The most impressive bit of research we had when I was at the DOL was a study of TSP [Thrift Savings Plan] participants. Once the TSP put a simple illustration of what the participant’s current account balance would produce as a monthly income stream on each quarterly account statement, there was a very noticeable spike in contributions.
“[The numbers] they were sufficient to overcome my concern that a lifetime income stream illustration might in fact be discouraging to some participants, particularly those who were younger and/or with shorter work histories,” she added. “I was afraid that they would feel that their monthly benefit was so small that it was almost meaningless and that they would be more likely to put their money to other uses, other than making a contribution to the TSP. But that didn’t seem to be the case.”
© 2020 RIJ Publishing LLC. All rights reserved.
The minutes of the July 2020 Federal Open Market Committee meeting were released today. They were somewhat disappointing as they walked back expectations that further policy action would soon arrive. The Fed is moving closer to concluding its policy review:
Participants agreed that, in light of fundamental changes in the economy over the past decade—including generally lower levels of interest rates and persistent disinflationary pressures in the United States and abroad—and given what has been learned during the monetary policy framework review, refining the statement could be helpful in increasing the transparency and accountability of monetary policy.
Such refinements could also facilitate well-informed decision-making by households and businesses, and, as a result, better position the Committee to meet its maximum-employment and price-stability objectives. Participants noted that the Statement on Longer-Run Goals and Monetary Policy Strategy serves as the foundation for the Committee’s policy actions and that it would be important to finalize all changes to the statement in the near future.
The “near future” is likely the September meeting. The most significant change to the Fed’s strategy is likely to be some flavor of an average inflation target whereby the Fed attempts to allow inflation to rise above 2% to compensate for periods of time below 2%.
This differs from the current strategy in which the Fed only attempts to return to the 2% target. The practical implication of this policy shift is that the Fed will keep policy easy for longer than was the case in the last recovery.
Although the Fed had an understandably dour outlook, they are not inclined to change the forward guidance just yet:
With regard to the outlook for monetary policy beyond this meeting, a number of participants noted that providing greater clarity regarding the likely path of the target range for the federal funds rate would be appropriate at some point.
This is somewhat surprising given the outlook for inflation and unemployment; the Fed would obviously like to accelerate the recovery. That said, it appears that they still have yet to decide what shape such guidance would take:
Concerning the possible form that revised policy communications might take, these participants commented on outcome-based forward guidance—under which the Committee would undertake to maintain the current target range for the federal funds rate at least until one or more specified economic outcomes was achieved—and also touched on calendar-based forward guidance—under which the current target range would be maintained at least until a particular calendar date.
In the context of outcome-based forward guidance, various participants mentioned using thresholds calibrated to inflation outcomes, unemployment rate outcomes, or combinations of the two, as well as combinations with calendar-based guidance.
It may have been too much to expect the Fed to both change its policy strategy and its forward guidance at the same meeting. This extension was interesting:
In addition, many participants commented that it might become appropriate to frame communications regarding the Committee’s ongoing asset purchases more in terms of their role in fostering accommodative financial conditions and supporting economic recovery.
As if it was a surprise that asset purchases had already evolved past their initial rationale as supportive of market functioning. In the press conference that followed the July meeting, Federal Reserve Chair Jerome Powell said as much:
“We understand, accept, and are fine with the fact that those purchases are also fostering a more accommodative stance of monetary policy, which would tend to support macroeconomic outcomes. So it’s doing both… The programs are not structured exactly like the QE programs were in the aftermath of the last financial crisis. Those were more focused on buying longer-run securities. The current purchases are all across the maturity spectrum. Nonetheless, they are supporting accommodative financial conditions. I think it’s clear that that’s the case.”
Look for the Fed to make more explicit what Powell has already said. Also watch for the possibility that it shifts the mix of assets toward to the longer end of the curve to prove that asset purchases are more like QE than only to support market functioning.
The Fed threw cold water on the notion of yield curve control for now:
A majority of participants commented on yield caps and targets—approaches that cap or target interest rates along the yield curve—as a monetary policy tool. Of those participants who discussed this option, most judged that yield caps and targets would likely provide only modest benefits in the current environment, as the Committee’s forward guidance regarding the path of the federal funds rate already appeared highly credible and longer-term interest rates were already low.
I have argued that yield curve control was on its way at some point after the Fed embraces enhanced forward guidance. Since they have yet to make the guidance move, they weren’t going to make the yield curve control move.
That said, at this point the Fed believes that such guidance alone would be sufficient to lock down interest rates. Yield curve control would be redundant in such a world. The implication is the yield curve control would only come into play if the Fed believed that forward guidance was unable to hold interest rates in the desired range.
Bottom Line: The Fed remains focused on downside risks but as of yet is unwilling to act further to support the recovery. Maybe they won’t need to.
© 2020 Tim Duy.