Archives: Articles

IssueM Articles

In Search of a Safer Bet

Not long ago, the business of following VA trends had everything to do with tracking roll-up rates and other living benefit enhancements. The so-called arms race saw insurers ratcheting up their benefits during a period of relatively low volatility and decent interest rates. However, the financial crisis has changed all this—for the better—and trend watching has become a much different sport.

For one thing, insurers are more likely to mind their own business, or at least view their competitors with a more curious than avaricious eye. Many have willfully stepped back from VAs, reducing inflows and restricting sales to less-rich products that sit comfortably within their risk tolerance. These companies are unconcerned with their market share and would be hesitant to take on a significant volume of new business even if it stood at their doors.

The emerging trends have more to do with risk management than rich benefits.  Prudential Financial, for instance, has forged tremendous success out of its Highest Daily line of withdrawal benefits and the asset transfer program that reduces the hedging onus on the insurer.

This type of system, which is based on constant proportional protection insurance (CPPI), uses an algorithm to move policyholder assets into a safe portfolio following certain triggers. A key difference between these asset transfer programs and CPPI is that the portfolio never becomes “cash-locked”—i.e. with all of the assets in the safe portfolio. 

This strategy shifts some of the hedging mechanism from the insurer to the policyholder, reducing equity volatility risk and costs for the insurer. This helps keep costs reasonable for clients and makes the product’s overall risk profile more palatable for the manufacturer.

Although some companies have followed in Prudential’s footsteps, the asset transfer trend has not become the most popular means to mitigate VA risk. Instead, many insurers have chosen to embed similar tactics within variable funds.           

AXA Equitable was the first to integrate a dynamic asset allocation component into its variable funds. Such funds use derivatives to add even more oomph than an asset transfer program. Within the context of VAs, fund-based risk management gives the insurer more flexibility over time to adapt the strategy to unforeseen changes in economic conditions. By comparison, asset transfer programs are contractually based, leaving little room for such flexibility.

Initially, sub-advisory structures dominated dynamic asset allocation, if need be allowing the insurer to dictate specifications to suit its hedging program. However, asset managers have launched and placed their own off-the-shelf strategies that some insurance companies are adopting, making this type of solution accessible to manufacturers of all sizes. After all, the sub-advisory structure demands a minimum volume of assets to make sense for all parties.

Among other things, this latest generation of products incorporates elements of hedging into products at a level where it is apparent to the investor. This takes hedging out of the black box where it used to reside, and creates the potential for new product innovations outside of the realm of VAs.

A fundamental benefit of these new strategies is the reduction of volatility. At the same time that Prudential reduces its hedging onus, it also gives its policyholders a means to preserve contract value. That benefit, though not be a bona fide guarantee, is still valuable. The same is true for dynamic asset allocation. With or without an explicit guarantee, the reduction of volatility can also benefit investors.

Our understanding is that companies are already translating the dynamic asset allocation strategies of VA funds into retail mutual funds. A similar strategy could be used in managed accounts, and even in defined contribution plan accounts.

While asset transfer programs and managed risk funds are playing a significant role in revitalizing the VA industry, their benefits may ultimately reach the wider world of investing. In the “new normal” of acute risk awareness, the price of guarantees would otherwise become prohibitive. As customers learn more about the benefits of these new risk management devices, they may embrace their use in other settings, creating potential for new product and strategy concepts.

Tamiko Toland is Managing Director of Retirement Income, Strategic Insight.

© 2011 RIJ Publishing LLC. All rights reserved.

Dark Horse Candidate

Before the financial crisis, few in the VA business could have predicted that Jackson National Life would survive the industry’s shakeout so handily. At the time, Jackson’s VA prices wasn’t even among the 10 top sellers. Its prices were about 30 bps above the competition’s.    

Yet over the past three years, Jackson has climbed from 14th to third in individual VA sales, behind Prudential and MetLife. Its conservative hedging strategy and relatively small book of VA business—still only about $60 billion—turned out to be two of its biggest advantages.    

The $107 billion company’s other big asset is its Perspective series of VAs. The contract’s combination of a smorgasbord of investment options with a guaranteed lifetime withdrawal benefit has appealed to a lot of independent advisors (some of whom work in Jackson-affiliated broker-dealers) who like the idea of performing risky high-wire acts with a net.   

Indeed, Perspective II, and its companion Perspective L, have proven so popular (combined 2010 sales, $12.5 bn) that when the CEO of Jackson’s British parent, Prudential plc, hinted publicly last spring about “de-risking” Perspective, his loose cannonball instantly exploded into headlines in an investment advisors trade magazine.

Clifford JackSpeculation about Jackson has since been cooled by news that it will restrict investment in only in certain high-risk equity subaccounts. But uncertainty remains about the company’s plans. To shed light on them, RIJ recently interviewed Jackson National executive vice president Clifford Jack (right), in a reprise of an interview two years ago. 

RIJ: Many people have been wondering what changes might be in store for your variable annuity.

Jack: We are committed to the product chassis that we have in Perspective II. We’ve talked before about our cafeteria-style approach and allowing advisors to have some freedom in investing their clients underlying assets. The changes we’ll make in 2011 will be consistent with what we did in 2009 and 2010. But there will always be times when we look at the overall situation and make determinations.

We made a multitude of product changes prior to, in midst of, and since the crisis, and we always expect to make changes in our product line to balance stakeholder interests. We have over-communicated with our clients since the articles [about Jackson de-risking] have come out, to assure clients that we are very comfortable with the VA marketplace. We view it as business as usual.

RIJ: Are you concerned that you might alienate some advisors by changing such a successful product?

Jack: It’s a matter of balance. I’d say that, as a public company, you have multiple stakeholders. Regulators, employees, shareholders, clients, advisors and their broker dealers are all our clients, so we constantly try to balance the stakeholders’ interests. We look at the cost of hedging liabilities and charge whatever we think is an appropriate cost to maintain the guarantees in any market environment.

Going into the crisis, we felt comfortable with our pricing. We’ve made a clear commitment to accept whatever the market environment is and price appropriately. If it ever gets too expensive to provide guarantees—say, if the VIX doubled—we would do things differently. But we wouldn’t take on more risk.

 In a May 31 SEC filing, Jackson National Life said that, effective August  29, 2011, it would close the following variable annuity investment options to all separate account investors, but leave them available to Funds of Funds:

  • The JNL Institutional Alt 65 Fund will be closed to all investors
  • The JNL/Goldman Sachs Emerging Markets Debt Fund
  • The JNL/Lazard Emerging Markets Fund
  • The JNL/Mellon Capital Management Global Alpha Fund
  • The JNL/Red Rocks Listed Private Equity Fund                          

Also effective August 29, 2011, the JNL/BlackRock Global Allocation Fund no longer utilizes a master-feeder structure.  

RIJ: Other VA issuers have gone in the direction of providing less room for active investing. You’re not headed in that direction, apparently. 

Jack: We have not forced or asked our advisors to make a choice between passive and active. There clearly are advisors who believe in passive investing, who believe you can’t consistently outperform the benchmarks. There’s another group of advisors who believe in active investing, and there are those who believe in a blend. Our view is that all of that should be brought inside a product that also provides lifetime income guarantees. If you’re a passive investor, and if you’re of a certain age, you can buy a cheap, passive portfolio [from us]. Our focus is on the protection of the clients’ guaranteed income.”

I believe that the simplified products, the dummied-down or de-risked products, are not in the consumer’s best interest. We have a complex product that we make less complex by giving advisors the tools to simplify it for their clients. That’s very expensive to do, but we want to tell a complex story. We have a cafeteria approach versus a bundled approach. That’s more difficult to navigate through. But it’s in the best interest of the customer. We’ll stay committed to the complex product and spend more money on education to make it understood. We bet on that approach prior to the crisis and we think it’s important today.   

RIJ: Are you conceding the RIA space? 

Jack: We know that space well. We have a large RIA. We know that some of our competitors are pursuing no-load variable annuities and we’ll watch that trend closely. But we don’t believe that there’s a first-move advantage in no-load VAs. If they show any sales movement of significance, we’d be extremely well positioned in to enter that space. But it has not shown promise. A significant number of clients are not yet placing assets there. We already have level-load features that align the advisors’ interests with their clients’. So, should that market ever take off, we have a version similar to a no-load for advisors who are interested.

RIJ: You’ve still only got a $60 billion VA book of business, well below Prudential’s $109.1 billion and MetLife’s $132.3 billion, and you’ve got Prudential plc’s strength behind you. But some people are concerned that you might have gained too much market share too fast. How would you respond?

Jack: The question we often get is about concentration risk. People ask, ‘Are you selling too much VA?’ The answer is no, we’re very comfortable with the current sales level. That said, there are a number of things to keep in mind. First, How much are you selling versus how much of your balance sheet is tied to a single product?  To be clear, we are very well balanced. From a liability standpoint, the balance sheet is in a very comfortable position. We look at liabilities tied to fees, to underwriting revenues—that is, to life insurance—and to our spread-based business, which includes indexed and fixed annuities. There’s no question that the VA has become a larger component of Jackson’s balance sheet recently, but we’re comfortable with where we stand.

If VA sales continue to outpace all else, what will that mean? Will we have to shut down or stunt VA growth? The answer is most likely not, because there are other levers you can pull as a management team. We’ve tried to mix organic with inorganic growth. For instance, we recently bought a large closed block of life insurance from another provider—at a very attractive return on capital, because of our efficient systems. That helped. There are times in the cycle when you can pick that up on a value basis, and there are times when things are over-priced. We like to pick up assets at the right time in the cycle.

RIJ: Of course, no one would want to buy blocks of VAs with underwater income riders during the crisis. But it must have been a good time to expand “organically.”

Jack: Coming out of the crisis, when the industry was consolidating, it was a fortuitious time to originate VA business. The best time to originate any equity-based product is at a low point in the market, because you have the benefit of a rising fee environment. If equities go up, obviously you get paid more.

We didn’t predict that equities would go up. We decided that, because interest rates were low and there were no counter-correlated assets, retirees and advisors had few options, and they should be more open to guaranteed income than ever and that there would be a greater need for VAs. So we decided to stay in front of advisors every day with the same story, and that enabled us to take advantage of the timing. 

Conversely, we didn’t say, ‘The market is at a peak, so we’ll dial back and become less aggressive.’ We didn’t do that. We said, ‘It doesn’t matter that market is all time high, we’ll continue to buy the hedges and protect against the down side.’ If somebody says, ‘I’m worried about your fast growth,’ I say, Why? We’re dealing with the risk today the same way we dealt with it post-crisis—we bought the hedges that protect us against the downside.

RIJ: What’s your view of the future?

Jack: I have no idea if the market will go up or down, but it’s important to recognize that when we price we think of the markets. We buy the hedges for protection in down markets. We’re not trying to make money with our hedging program. We’re not running a hedge fund. We’re buying protection that’s readily available in the market. We protect against interest rate fluctuation and equity fluctuation on the downside, and therein lies the cost of the hedges. That’s why we charge what we charge. We had no hedge breakage in the crisis. No one could have anticipated that the market would decline as much as it did, but when it did our hedges worked. We had the worst market we have ever seen and we had no hedge breakage. That’s the key for anybody to understand. We saw a 45%-50% percent decline, and our hedges worked. If the market goes down 30% from here, our hedges will work.   

RIJ: So Jackson National has no plans to put its VA business in low gear?

Jack: We are comfortable with where we are and with our growth plans. The growth plans assume business as usual. Without getting into details, they also assume management action to be able to grow and diversify the balance sheet for the three legs we discussed, the fee, the spread and the underwriting businesses. If we did nothing and our balance sheet tilted too much in any direction, that would impact our new-business origination. But, as you suggested, $60 billion is relatively small in the context of Prudential plc.

RIJ: Thank you, Cliff.


A note on Jackson National’s affiliated distribution network

National Planning Holdings, an $83 billion broker-dealer network and RIA, did $857 million in Jackson VA sales in the first nine months of 2010, which represented 8% of Jackson VA sales in that period, according to Jackson National.

National Planning Holdings includes two independent broker-dealers, National Planning Corporation and INVEST Financial Corp.; a registered investment advisor, Investment Centers of America; and a financial advisory firm, SII Investments, Inc.

Jackson National also owns a separately managed accounts firm, Curian Capital, which manages $6.2 billion. NPH handled $260 million of sales by Curian in the first nine months of 2010, or 17% of Curian sales.  

© 2011 RIJ Publishing LLC. All rights reserved.

Death rates vary by gender, ethnicity and location

Even as they age, Americans are gaining life expectancy. Or so it seems.

Average life expectancy at birth is 78.2 years among Americans, and average life expectancy at age 65 has reached 18.8 years, an increase of 6.8% since 2000. But the risk of dying varies by gender, race, ethnicity and geographical location.

Those were among the findings in “Death in the United States, 2009,” a data brief published this month by the National Center for Health Statistics.

In 2009, the age-adjusted death rate for the United States reached a record low of 741 per 100,000. Between 2000 and 2009, the gap in life expectancy between white persons and black persons in the United States declined by 22%, to 4.3 years.

The southeast states and non-Hispanic African-Americans tend to have the highest death rates. The gap between the life expectancies of white and black Americans at age 65 fell to 1.3 years in 2009 from 1.6 years in 2000, however.

After adjusting for differences in average age, the brief said the following ten states had the highest death rates: Alabama, Arkansas, Georgia, Indiana, Kentucky, Louisiana, Mississippi, Oklahoma, Tennessee and West Virginia.

Although the data brief doesn’t mention financial factors, death rates appear to correlate with income. Seven of these states rank 45th through 51st in median annual income and none rank higher than 37th, according to worldlifeexpectancy.com.

If current trends continue, heart disease may fall behind cancer as the leading cause of death (heart disease mortality has fallen faster than cancer mortality) and male and female life expectancies will continue to approach convergence.

Between birth and age 44, the most common causes of death in the U.S. are accidents and homicides. Between ages 45 and 64, the most common cause of death is cancer. From age 65 onward, the most common cause of death is heart disease. Alzheimer’s disease was blamed for only seven percent of deaths among the elderly in 2009.

© 2011 RIJ Publishing LLC. All rights reserved.

One in five 401(k) participants has no outside savings: Fidelity

More than half (55%) of current plan participants say they would not be saving for retirement if not for their 401(k) plan and 19%s said they had no other retirement savings than their workplace plan, according to a new survey by Fidelity Investments. 

Fidelity, the nation’s largest provider of 401(k) plans and IRAs, surveyed 1,000 current and retired workplace plan participants. In what Fidelity took as a sign of difficult economic times, 54% said they would “contribute more to their 401(k)s if they could.

In May, Fidelity reported that nearly one in 10 corporate defined contribution participants increased their contribution rate during the first quarter of 2011, the largest percentage to do so since Fidelity started tracking the figure in 2006. This corresponds with the survey that found 53% of working respondents increased their contribution rate in the last five years, despite historic market volatility and economic uncertainty.

When asked why they increased their contributions, 23% of working respondents said they wanted to take full advantage of employer matching dollars, and 38% said they had received a raise or had extra money available.

Only 23% of working respondents reported ever decreasing their workplace plan contribution percentage. For those who decreased contributions, 46% reported needing extra money, and 9% said it was due to the elimination of a company match. Forty percent of these respondents said they already do – or possibly will – regret the decision to decrease their retirement savings contribution.

Fidelity’s survey found that 23% of working respondents have taken a loan from their retirement plan, with many saying they needed to do so for an unforeseen emergency. But 29% of those respondents said they would not do so again.

Many plan sponsors require complete repayment of the loan within 60 days if the participant leaves the company or is laid off, which could trigger a fee and tax bill.

To supplement their workplace plan, 37% of working respondents are building retirement savings in an IRA. In addition, 33% are in an employer-sponsored pension plan, 28% have savings in bank accounts, and 28% have investments in stocks or bonds. Pre-retirees 55 and older are the most active users of IRAs, with 44% saying they utilize them.   

© 2011 RIJ Publishing LLC. All rights reserved.


Wells Fargo leads banks in annuity sales

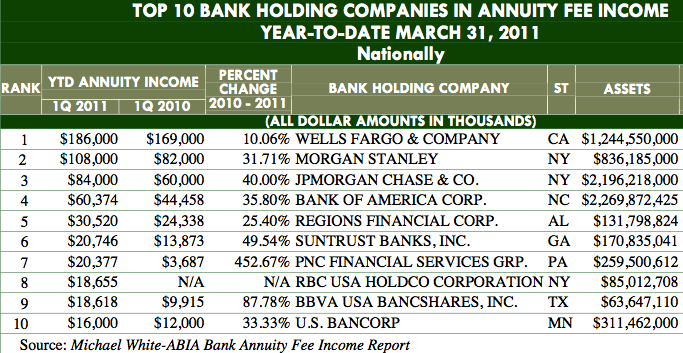
Wells Fargo & Company ($186m), Morgan Stanley ($108m), JPMorgan Chase & Co. ($84m), Bank of America Corporation ($60.4m), and Regions Financial Corp. ($30.5m) led all bank holding companies in annuity commission income in first quarter 2011, according to the Michael White-ABIA Bank Annuity Fee Income Report.

Wells Fargo acquired Wachovia Bank, a former leader in annuity sales, during the financial crisis.

Together, ten large bank holding companies accounted for about $563 million or more than 64% of the $748.2 million in bank annuity income in the first quarter, up 28% from $582.6 million in first quarter 2010 and 2.6% higher than in the fourth quarter of 2010.

Not since the first quarter of 2007, when these data first became available, has the quarterly amount of annuity fee income been so high. The report uses data from all 6,850 commercial and FDIC-supervised banks and 942 large bank holding companies (BHC) operating on March 31, 2011.

bank annuity income chart

Of the 942 BHCs, 378 or 40.1% sold annuities sales in first quarter 2011. Their $748.2 million in annuity commissions and fees constituted 11.9% of their total mutual fund and annuity income of $6.31 billion and 15.8% of total BHC insurance sales volume (i.e., the sum of annuity and insurance brokerage income) of $4.73 billion.

Of the 6,850 banks, 821 or 12.0% sold annuities in the first quarter, earning $204.2 million in annuity commissions or 27.2% of the banking industry’s total annuity fee income. In contrast to BHCs, the banks’ annuity production was up only 9.7%, from $186.1 million in first quarter 2010.

Seventy-four percent (74.3%) of BHCs with over $10 billion in assets earned first-quarter annuity commissions of $708.3 million, constituting 94.7% of total annuity commissions reported by the banking industry. This was an increase of 29.3% from $547.8 million in annuity fee income in first quarter 2010. Among this asset class of largest BHCs, annuity commissions made up 11.4% of their total mutual fund and annuity income of $6.20 billion and 15.8% of their total insurance sales revenue of $4.49 billion in first quarter 2011.

BHCs with assets between $1 billion and $10 billion recorded an increase of 13.9% in annuity fee income, growing from $29.7 million in first quarter 2010 to $33.8 million in first quarter 2011 and accounting for 31.6% of their mutual fund and annuity income of $1.33 billion. BHCs with $500 million to $1 billion in assets generated $6.12 million in annuity commissions in first quarter 2011, up 19.0% from $5.15 million in first quarter 2010. Only 30.5% of BHCs this size engaged in annuity sales activities, which was the lowest participation rate among all BHC asset classes. Among these BHCs, annuity commissions constituted the smallest proportion (15.1%) of total insurance sales volume of $40.6 million.

Among BHCs with assets between $1 billion and $10 billion, leaders included Stifel Financial Corp. (MO), Hancock Holding Company (MS), National Penn Bancshares (PA), Iberiabank Corporation (LA), and Bremer Financial Corp. (MN). Among BHCs with assets between $500 million and $1 billion, leaders were Northeast Bancorp (ME), First Volunteer Corporation (TN), Van Diest Investment Co. (IA), River Valley Bancorporation, Inc. (WI), and First American International Corp. (NY). The smallest community banks, those with assets less than $500 million, were used as “proxies” for the smallest BHCs, which are not required to report annuity fee income. Leaders among bank proxies for small BHCs were Jacksonville Savings Bank (IL), Essex Savings Bank (CT), Savers Co-operative Bank (MA), FNB Bank, N.A. (PA), and The Hardin County Bank (TN).

Among the top 50 BHCs nationally in annuity concentration (i.e., annuity fee income as a percent of noninterest income), the median Annuity Concentration Ratio was 7.3% in first quarter 2011. Among the top 50 small banks in annuity concentration that are serving as proxies for small BHCs, the median Annuity Concentration Ratio was 16.6% of noninterest income.

© 2011 RIJ Publishing LLC. All rights reserved.


NYLife Targets VA Buyers with New DIA

With its new deferred income annuity, announced Monday, New York Life isn’t merely trying to expand its big share of $7.9 billion immediate annuity market. It’s aiming for a piece of the $100+ billion variable annuity market. Issuers of VAs with 10-year roll-ups and 5% annual payouts may want to take heed.

New York Life formally announced its new product, the Guaranteed Future Income Annuity, on Monday, months after it was described at a retirement industry conference. The multi-premium contract allows a person to build a personal pension with a series of contributions leading to lifetime income beginning at a pre-determined but flexible start date.

True, VA issuers have already tried, without huge success, to put a deferred income annuity inside a VA. (See today’s story on the Hartford). But New York Life hopes that advisors and clients will crunch the GFIA’s numbers and decide that it’s worthwhile to swap some liquidity for a bigger income in retirement.

“Liquidity is the enemy of mortality credits,” says the GFIA product manager, New York Life vice president Matt Grove. “This product is generating as much income as possible.” (See GFIA fact sheet and brochure.)

Here’s how the GFIA would typically work: people in their 50s pay into the GFIA for several years and then get a guaranteed lifetime payout of 9-12% for life (depending on age and options like cash refund, joint-and-survivor or period certain). It’s intended to challenge the VA’s winning formula: a guaranteed lifetime income benefit with a deferral bonus that delivers at least 10% of premium after 10 years—plus liquidity and exposure to equities.

How could GFIA compete with liquidity and upside potential? Apparently, many VA owners opt for income after deferring for only a few years, and reap guaranteed income much less than 10% of premium. Income-wise, GFIA matches up well against that. “We’re targeting the short deferral market,” Grove told RIJ.

“The GLWB and the GMIB [guaranteed minimum income benefit] are designed to maximize value over a 10- to 12-year period, but only 30% to 40% of owners are exercising that option,” he added. “In a qualified account, over a four-year deferral period, you would need market returns of more than 20% a year to do better in a GLWB than in the GFIA.”

That’s the beauty part. Of course, with an income annuity, the beauty part is also the catch. To maximize income, you have to make irrevocable payments ($10,000 initial minimum). Every payment you make—and with the GFIA you can start making payments as long as 40 years before you retire—is irrevocable. You can add a cash refund feature and you can accelerate a payment or two. But the value depends on the illiquidity.

It’s impossible to say what any specific person’s experience would be with GFIA until they plugged in all the specifics. But Grove said that if a man put $100,000 into the GFIA at age 55 with the intent to take lifetime income at age 65, he would receive an annuity at age 67 with a net present value of $205,050. In other words, it would take an average investment return of about six percent over 12 years to match the GFIA’s internal rate of return.   

A deferred income annuity is, of course, an old concept made new again. All deferred annuities are called annuities precisely because they allow the contract owner to convert the assets to a guaranteed lifetime income stream.

In practice, few people who buy deferred annuities eventually “annuitize” them. But all deferred annuities—variable, fixed, indexed—can be annuitized. Indeed, the privilege of tax-deferred growth was conferred upon deferred annuities because they can help Americans achieve the socially desirable goal of financial security in retirement.

Nor is New York Life the first company to try to entice Baby Boomers with the concept of a multi-premium income annuity. The Hartford’s Personal Retirement Manager, for instance, is a variable annuity that includes a deferred multi-premium income annuity sleeve.

Variable annuities like that haven’t caught on in general—but New York Life, with its career agents and almost uniquely successful track record selling SPIAs, may have better luck. New York Life, the world’s largest mutual life insurer, is by far the leader in sales of individual single-premium annuities in the U.S., with sales of $1.9 billion in 2010 out of a total market valued at $7.9 billion.

It sells the contracts through its career agents, through the Fidelity Investments website, and through other distribution channels. About 60% of its SPIA purchasers take the cash-refund option, Grove said. That shows how much people—even SPIA buyers—are willing to give up income to avoid premature forfeiture.     

In a press release, New York Life, the world’s largest mutual insurance company, offered the following hypothetical examples (all based on single life-only contracts; joint contracts, cash refund, or inflation-protected contracts would presumably have smaller payout rates):

A 57-year-old man who might otherwise move part of his money into a five-year certificate of deposit (currently yielding 1.68%) to safely fund for his retirement could instead put the money into the Guaranteed Future Income Annuity and receive a life-only payout of 11.3% starting at age 66. 

A 65-year-old man who invests $100,000 (in after-tax money) in the GFIA would receive a guaranteed, life-contingent $65,500 per year payment starting at age 85. This “longevity insurance” could release him from under-spending or hoarding the rest of his assets against the possibility of living to 95 or 100. 

The release also noted that policyholders would have:

  • The ability to make subsequent premium payments during the deferral period—the time between the initial investment and two years prior to the income start date.
  • The ability to change the income start date once for any reason. The ability to move the start date is not available for the life-only option and can only be moved back a maximum of five years from the original income start date.
  • The ability to customize their payment stream to include another person, inflation protection, and a cash refund feature.  

© 2011 RIJ Publishing LLC. All rights reserved.

The Bucket

Morningstar adds asset allocation functionality to its direct platform for institutions

Morningstar, Inc., the provider of independent investment research, has added asset allocation and forecasting functionality to Morningstar Direct, a web-based global investment analysis platform for institutional investors.

Based on research from Morningstar and Ibbotson Associates Inc., its wholly owned subsidiary, the new tools allow investors to create optimal asset allocation strategies that take into account “fat-tailed” return distributions and measure downside risk.

In a release, Morningstar said:

“Mean-variance optimization (MVO) has been the standard for creating efficient asset allocation strategies for more than half a century and has become synonymous with Modern Portfolio Theory.

“But MVO is not without its shortcomings. Traditional MVO cannot take into account ‘fat-tailed’ or extreme asset class return distributions, which better match real-world historical asset class returns. This framework is also limited by its ability to only optimize asset mixes for one risk metric (standard deviation) and one reward metric (arithmetic return).”

The new asset allocation capabilities in Morningstar Direct allow users to choose from a number of return distribution assumptions to model asset class behavior, including traditional bell-curve shaped return distributions as well as “fat-tailed” and skewed distributions.

Users can then use scenario-based optimization to create optimal asset allocation strategies. They can elect to create strategies that will produce the highest expected return either for a given level of volatility or for one of several downside risk measures.

As the markets have shown—and reminded us most harshly again in 2008—real-life finance is often more complex than the traditional mathematical models used for portfolio optimization and forecasting,” said Xiaohua Xia, president of institutional software for Morningstar.

“Our new asset allocation functionality in Morningstar Direct offers institutional investors a flexible tool with multiple options to enhance and refine traditional mean variance optimization or take advantage of some of the most cutting-edge modeling.”

The new asset allocation functionality is included with all Morningstar Direct subscriptions. Introduced in 2001, Morningstar Direct equips more than 5,300 users at nearly 1,700 institutions globally with data and tools to interpret and communicate financial information.  


Allianz Life introduces new FMO distribution model

Allianz Life Insurance Co. of North America has launched Allianz Preferred, a new model for distributing fixed index annuities (FIAs) that will support qualifying field marketing organizations (FMOs) with increased education, training and resources for third-party oversight, as well as access to exclusive products. The first of these products will be launched on August 2.

To qualify for Allianz Preferred, field marketing organizations must hire a formal Field Compliance Officer and Field Suitability Officer who participate in ongoing training from both Allianz Life and the industry. They must also agree to a review and approval process of advertising prepared by the FMO, including review of all non-Allianz Life materials by an Allianz Life-approved third-party ad review firm, which Allianz Life will pay for. FMOs also must meet certain production requirements and must not be affiliated with a distribution group.

Financial professionals who qualify and are contracted with Allianz Preferred may sell innovative Allianz Life products that are exclusive to the Allianz Preferred program.

“As we continue to see significant changes in the economic, regulatory and distribution environments that demand a bold response, the launch of Allianz Preferred is an important step,” said Allianz Life President and CEO Gary C. Bhojwani. “Allianz Preferred reflects our belief that when we invest in agents and FMOs that are most dedicated to a relationship of reciprocal commitment with Allianz, we strengthen sales practices, help ensure uniform compliance with regulations, and continue our high service standards for all policyholders.”

Allianz Life’s release also said:

“With FIA sales setting new records in 2010, securities licensed professionals are among the fastest growing FIA sales channel. FIAs were also the number one selling type of fixed annuity for the second quarter of 2010, a first for the industry according to LIMRA.

“These trends, along with more stringent regulatory standards – lower tolerance for replacement sales, greater scrutiny on source of funds for purchasing FIAs, and more oversight of advertising value-added services, recruiting and sales practices – require a new relationship model between insurers and FMOs, something that Allianz Preferred addresses.”


Rising rates improve corporate pension funded Status by $25 billion in June: Milliman

The 100 largest U.S. defined benefit pension plans suffered a $10 billion investment loss in June but still saw their funded status improve due to a $35 billion liability reduction, said Milliman, Inc., publisher of the Pension Funding Index. The $25 billion reduced the funded status deficit to $186 billion.

“Normally when assets decline we’re in for a fall in pension funded status, but not this month,” said John Ehrhardt, co-author of the Milliman Pension Funding Study. “In fact it’s a rare combination: a funded status improvement driven by liabilities and in spite of a decline in assets. In the eleven years we have tracked this data, we have only seen this combination in a total of ten months.”

Over the last 12 months, the cumulative asset return has been 15.0% and the Milliman 100 PFI funded status has improved by $182 billion, pushing the funded ratio from 74.2% up to 87.0% at the end of June.


Great-West Retirement Services expands sales force

Great-West Retirement Services has appointed Mark Berman as regional sales director for its Great Lakes market, reporting to Pete Margiotta, national sales director, said Chris Cumming, Great-West’s senior vice president of defined contribution markets.  

Berman is based in Chicago and is responsible for developing new business in the over $50 million corporate and nonprofit defined contribution market in Illinois, Michigan, Ohio, Indiana and Kentucky.  He replaces Dan Schatz, who moved to a similar position in Texas.

Berman joins Great-West Retirement Services from Marshall and Ilsley Trust Company, where he served as vice president and sales director.  Previously, he held defined contribution market sales positions at Principal Financial Group and ABN Amro. 

He earned a bachelor’s degree in business administration from Bradley University. Berman also holds FINRA Series 6 and 63 securities registrations and life and health insurance licenses.


MassMutual Retirement Services hires three relationship managers

MassMutual has added three new relationship managers to its Retirement Services sales and client management organization led by Hugh O’Toole.

Brian Curtin has been hired as a senior relationship manager effective June 13 and is responsible for mid-market customers in the northeast region. He is based out of southern New Hampshire/Boston as part of the Boston local team. Brian joined MassMutual from Putnam Investments, where he served in a relationship management role.  

Tapas Ghosh has been hired as director of relationship management effective June 13 and is responsible for large market customers in the south-central region. He is based out of Raleigh, North Carolina as part of the North Carolina/South Carolina/Tennessee local team. Tapas brings with him a great depth of experience from prior director and relationship management roles with Fidelity Investments and The Vanguard Group.

Richard Wright has joined MassMutual’s Retirement Services Division as a senior relationship manager effective June 20 and is responsible for mid-market customers in the greater New York/New Jersey metro area. Prior to joining MassMutual, Rich held several roles with Prudential Financial, Inc., with responsibilities in participant solutions, internal sales and relationship management.


Vanguard profiles 401(k) trends of eight industries

Employees of utility companies who participated in their 401(k) or other defined contribution plan at Vanguard in 2010 tended to save more in their plans, participants in small ambulatory health care firm plans invested more of their plan assets in target-date funds, and participants in the plans of large mining companies had the highest average account balances.

The findings are part of Vanguard’s How America Saves 2011, an annual report that is a widely used barometer of retirement-planning trends. Using 2010 data, How America Saves 2011 looks at the overall patterns of more than 3 million participants in plans recordkept at Vanguard.

For the first time, supplemental industry reports to How America Saves analyze the behavior of plan participants in eight industries, including the ambulatory health care; finance and insurance; information services; legal services; manufacturing; mining, oil and gas extraction; technology; and utility industries. Plan sponsors in these industries can use a new benchmarking tool to compare their plan data with others in their industry and Vanguard plans overall.

Here are notable trends in participant behavior across these industries:

  • Plan participation. The plans of small utility firms (fewer than 1,000 employees and 92% participation rate) and large mining companies (more than 1,000 employees, 88% participation rate) had the best participation among the industries in the report. Vanguard plans as a whole had a 74% average participation rate.
  • Auto enrollment. Vanguard research has found that more employers (plan sponsors) are adopting automatic enrollment plans as a way to boost participation among employees. Auto enroll plans can have a variety of features. Besides the actual automatic enrollment, employers can choose to include an automatic annual increase in the payroll deferral rate (contribution rate) for participants and can choose to automatically earmark participant contributions to a default investment, such as a target-date fund, if they don’t choose an investment themselves. Employees always have the ability to opt out of the entire auto enroll program or individual features. Auto enroll plans were far more prevalent at large manufacturing companies (more than 1,000 employees) than at any other type of company in the report and Vanguard plans broadly. Sixty-seven percent of large manufacturing companies (more than 1,000 employees) had an auto enroll plan versus 24% for all Vanguard plans. At 6%, small ambulatory health care firms (fewer than 250 employees) were least likely to have an auto enroll plan.
  • Contribution rates. In a typical DC plan, employees are the main source of funding, contributing to their plan via payroll deferrals. On average, participants in the plans of both small and large utilities (more than 1,000 employees) saved at a higher rate than their counterparts in the other industry plans as well as all Vanguard plans. Their 9.0% and 8.2% average contribution rate, respectively, surpassed the 6.8% average contribution rate for Vanguard plans in aggregate. The plans of large manufacturing companies lagged with a 6.5% average contribution rate.
  • Target-date funds. Target-date funds (TDFs), which are broadly diversified (stock and fixed income) funds that become more conservative the closer an investor gets to the fund’s stated retirement date, have increasingly become a dominant retirement investment option. Large plans tended to offer TDFs more so than smaller plans; in the lead was the 93% of large ambulatory health care firms that offered TDFs, far surpassing the 79% of all Vanguard plans offering the funds. The standout in terms of small industry plans was utilities, 94% of whom offered TDFs. However, among participants using TDFs, those in the smaller plans covered by the reports usually invested more of their assets in the funds. For example, 62% of participant assets in small ambulatory health care firm plans were invested in TDFs, compared to the 41% of assets invested in TDFs by participants across all Vanguard plans offering the funds.
  • Account balances. At $237,081, the average account balance of participants in plans of large mining companies was significantly higher than the average account balance of participants in Vanguard plans collectively ($79,077). In contrast, the lowest average account balance was the $63,697 for participants in large information services company plans (more than 1,000 employees). It is important to note, however, that current plan balances are only a partial measure of retirement preparedness for many participants. A more accurate reflection of retirement readiness includes the participant’s plan balance in addition to age, plan tenure, expected Social Security income and assets that may be in personal savings, other employer plans, or a spouse’s retirement plan.

The How America Saves 2011 industry benchmark reports are based on Vanguard’s 2010 recordkeeping data for nearly 2.2 million participants in 1,552 qualified defined contribution plans offered by companies in the ambulatory health care; finance and insurance; information services; legal services; manufacturing; mining, oil and gas extraction; technology; and utility industries.

Austria urged to thwart early retirement

The Austrian government should abolish all incentives for early retirement, according to the Organization for Economic Cooperation and Development’s latest country survey, Investments & Pensions-Europe reported.

Though Austria’s statutory retirement ages are 65 for men and 60 for women, Austrian men retire at age 58.9 on average while women retire at age 57.5 on average. People in most other OECD countries—the world’s 40 most developed countries—retire just one or two years below the statutory retirement age.

The OECD pointed out that this was mainly due to the high number of people exiting the labor market through disability pensions, as well as still existing early retirement programs.

“All subsidies that encourage early retirement [in Austria] should be eliminated, while benefits and social transfers – which amount to 20% of GDP – should be better targeted,” the OECD said, adding that the provision that time spent in non-compulsory education can be substituted for regular years of contributions by paying a high lump-sum per month was “particularly problematic,” as it “increases the incentive for high-skilled individuals to leave the labor market.”

Actuary to Congress: Raise SS retirement age

Efforts to restore actuarial balance to the Social Security system should include an increase in the program’s retirement age, the public interest committee chairperson of the American Academy of Actuaries told a congressional panel last Friday.

Tom Terry of the AA explained to members of the House Ways and Means Subcommittee on Social Security that the program’s retirement age has not kept pace with longevity improvements, noting that that life expectancy for a 65-year-old today is about 50% higher than it was in 1937, when Social Security was created.

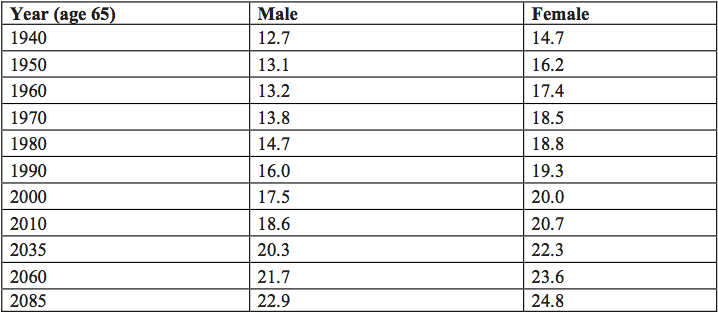
Even in 1940, however, men who reached age 65 had an average life expectancy of 12.7 years—meaning that half lived longer than that. A chart introduced by Terry showed that by 2010, an American man’s average life expectancy at age 65 had increased to 18.6 years. Women live about two years longer.

By 2060, it’s estimated that average life expectancy at age 65 will be 21.7 years for men and 23.6 years for women. (See chart below. Source: 2011 Annual Report of the Board of Trustees of the Federal Old-Age and Survivors Insurance and Federal Disability Insurance Trust Funds).

Life expectancy chart

Some of Terry’s approaches to adjusting Social Security for rising life expectancies were:

  • Increase the normal retirement age gradually to age 70.
  • Pay benefits for the same number of years.
  • Keep the ratio of working years to retirement years the same.
  • Decrease the benefits formula as longevity increases.
  • Automatically adjust the retirement age to maintain actuarial balance.

Terry also suggested in written testimony that slowing the increase in benefits would help solve a big part of Social Security’s actuarial problems.

“If Social Security benefits increased by 0.5% per year less than under the current program, the cumulative reduction would be about 5% after 10 years, and almost 10% after 20 years. This change would eliminate about 40% of Social Security’s 75-year deficit according to a 2009 study done by the Social Security Office of the Chief Actuary,” he wrote.

© 2011 RIJ Publishing LLC. All rights reserved.

Couples readier for retirement than singles: RAND

Economists at the Rand Corporation recently analyzed the economic resources of a group of Americans between ages 66 and 69 to see how well prepared they were to maintain their established standard of living (“level of consumption”) throughout retirement. Those who died with positive assets were considered to have been adequately prepared.   

“We find that 71% of persons in our target age group are adequately prepared according to our definitions, but there is substantial variation by observable characteristics: 80% of married persons are adequately prepared compared with just 55% of single persons,” wrote Susann Rohwedder and Michael D. Hurd in a new paper, “Economic Preparation for Retirement” (National Bureau of Economic Research Working Paper No. 17203, July 2011).

The researchers looked at the impact of reducing Social Security benefits. “We estimate that a reduction in Social Security benefits of 30% would reduce the fraction adequately prepared by 7.8 percentage points among married persons and by as much as 10.7 percentage points among single persons,” the paper concluded. Only 29% of single females without a high school diploma were prepared. The authors factored in the effects of taxes, spousal death, variations in life expectancy and out-of-pocketing health care costs. 

“Many singles who lack a high school education are not well prepared: even were they to reduce initial consumption by 10 percent, about 64% would still face a probability of running out of wealth greater than 5 percent,” the paper said. “Economic preparation by couples is much better than preparation by singles. Nonetheless there is substantial variation by education with some 89% of college graduates being prepared compared with 70% among those lacking a high school education.”

The authors believe that the income replacement ratios normally recommended for retirees (i.e., 70%-80% of pre-retirement income) are not ideal, since many retired people can live as well as ever on much less money, simply because their expenses often decline significantly after they retire.

© 2011 RIJ Publishing LLC. All rights reserved.

Variable annuity filings: Jan-June 2011, from Beacon Research


Issuer

Variable Annuity Contract

SEC Filing Date

Sun Life Insurance and Annuity of New York


Masters Choice II (NY)

1/11/2011

Masters Extra II (NY)

Masters Flex II (NY)

Masters I Share (NY)

Principal Life

Lifetime Income Solutions

Ohio National Life


ONcore Premier WF 7

1/18/2011


ONcore Premier WF 4

ONcore Premier WF 7

1/21/2011


ONcore Premier WF 4

SunAmerica Annuity & Life

Polaris Choice IV VA

2/1/2011


First SunAmerica Life

Polaris Choice IV VA (NY)

New York Life


Flexible Premium Variable Annuity II

2/3/2011


Flexible Premium Variable Annuity II

First SunAmerica Life

Polaris [TBD] VA (NY)

2/4/2011


SunAmerica Annuity & Life

Polaris [TBD] VA

Lincoln National Life

InvestmentSolutions

2/18/2011

John Hancock Life


Venture Frontier

2/22/2011


Venture Frontier (NY)

Venture 4

2/28/2011


Venture 4 (NY)

Venture 7

Venture 7 (NY)

Jackson National Life

Perspective II (WF) (NY)

3/16/2011


Perspective II (ML)

Perspective L Series (ML)

Perspective II (WF)

Sun Life Insurance & Annuity of New York

Masters Choice II (NY)

3/29/2011


Masters Extra II (NY)

Masters Flex II (NY)

Masters I Share II (NY)

Principal Life

Lifetime Income Solutions

3/30/2011


John Hancock Life

Venture Frontier


Venture Frontier (NY)


Venture 4


Venture 4 (NY)


Venture 7


Venture 7 (NY)

Pruco Life

Premier Retirement VA NJ (New)

4/1/2011


Pruco Life

Premier Retirement VA (New)

Nationwide Life

Destination Navigator

4/7/2011


Destination Navigator (NY)

Allianz Life

Vision POS VA

Vision POS VA (NY)

Lincoln Life & Annuity of NY

ChoicePlus Signature (NY)

4/8/2011


American Legacy Signature (NY)

Lincoln National Life

American Legacy Signature

ChoicePlus Signature

ChoicePlus Rollover

New York Life


Flexible Premium Variable Annuity II

4/12/2011


Flexible Premium Variable Annuity II

Jackson National

Perspective L (ML)

4/19/2011


Perspective II (ML)

Perspective II (WF)

Perspective II (WF) (NY)

Sun Life

Masters Extra II NY

4/27/2011


Masters Choice II NY

Masters Flex II NY

Masters I-Share II NY

SunAmerica

Polaris Platinum O-Series VA


Polaris Choice IV VA

First SunAmerica

Polaris Platinum O-Series VA (NY)


Polaris Choice IV VA (NY)

Lincoln National Life

American Legacy Signature

ChoicePlus Signature

Lincoln Life & Annuity of NY

American Legacy Signature (NY)

ChoicePlus Signature (NY)

Principal Life

Lifetime Income Solutions

Lincoln National Life

ChoicePlus Rollover

5/11/2011

John Hancock Life

Venture Frontier

5/17/2011

Venture 4

Venture 7

John Hancock Life of NY

Venture Frontier (NY)

5/18/2011

Venture 4 (NY)

Venture 7 (NY)

Ohio National Life

OnCore Premier WF 7

5/19/2011


OnCore Premier WF 4

Lincoln National Life

ChoicePlus Fusion

5/20/2011

Prudential Retirement Insurance

Prudential Retirement Security Annuity III

5/25/2011

SunAmerica

Polaris Advantage II

5/31/2011

First SunAmerica Life

Polaris Advantage II (NY)

Hartford Life

Personal Retirement Manager Foundation A-Share VA (HLIC)

6/3/2011

Hartford Life and Annuity

Personal Retirement Manager Foundation A-Share VA

Hartford Life

Personal Retirement Manager Foundation O-Share VA (HLIC)

Hartford Life and Annuity

Personal Retirement Manager Foundation O-Share VA

Nationwide Life

Destination Navigator

6/7/2011

Destination Navigator (NY)

6/7/2011

Allianz Life

Connections New York WF

6/22/2011

The Journal Plays Gotcha! with EBRI

Jack van der Hei, director of research at the Employee Benefits Research Institute awoke at 4 a.m. Thursday to find this headline on page one of The Wall Street Journal: “401(k) Law Suppresses Saving for Retirement.”

Van der Hei was chagrinned, to say the least. His EBRI research had been the basis for the story, but the Journal reporter cherry-picked the most ironic nugget from his data and sensationalized it. Van der Hei quickly typed out a retort, which he posted online and summarized in a subsequent e-mail blast.

The Journal, as far as I can tell, overreached in its determination to publish a man-bites-dog story.   

The lead sentence read, “A 2006 law designed to boost employees’ retirement-savings is having the opposite effect for some people.” It argued that the practice of auto-enrolling new employees into 401(k) plans with a default contribution rate of just 3%—a practice enabled by the Pension Protection Act of 2006—has driven down the average contribution rate among 401(k) participants.

Auto-enrollees apparently tend to get “stuck” at their initial default contribution rate of 3%, which is less than half the average contribution rate of people who enroll voluntarily.

Now, simple arithmetic would tell you that an influx of participants with low contribution rates would drive down the average contribution rate. But, in the Journal’s view, this dilution of the overall contribution rates was an undesired and unintended consequence of the PPA and therefore ironic enough to deserve page-one play on a publication that was, before its purchase by Rupert Murdoch, almost above reproach.       

There was some substance at the heart of the Journal’s story, I suppose. Among people who are auto-enrolled, some—40%, according to the Journal, which cited the EBRI as a source—would probably have enrolled on their own and would have started contributing more than 3%. But to say that those people are “stuck” at 3% for any reason other than their own inertia would seem to be a stretch.  

My takeaway: a law can’t do everything for everyone. Auto-enrollment at 3% was always considered the most moderate way—neither too aggressive or too timid—to address the problem of low enrollment and savings rates among new hires. 

The Journal’s takeaway: yet another well-intended government initiative backfires. I’d call it “gotcha” journalism. Which is how Jack van der Hei felt when he saw the headline. Here’s a quote from the e-mail blast he sent last Thursday:

The WSJ article reported only the most pessimistic set of assumptions from EBRI research and did not cite any of the other 15 combinations of assumptions in the study, notes EBRI Research Director Jack VanDerhei. The WSJ also chose not to report any of the positive impacts of auto-enrollment 401(k)-type plans in the simulations that were done by EBRI.
 
“The headline of the article reports that auto-enrollment is reducing savings for some people. What it failed to mention is that it’s increasing savings for many more—especially the lowest-income 401(k) participants, VanDerhei said.

I wonder: If the default contribution rate were 7% under PPA and auto-enrollees balked at that level of garnishment and opted out of their plans, would the Journal have written the opposite story with an equal amount of indignation? Undoubtedly.

Not that auto-enrollment isn’t fair game for criticism. On the one hand it’s probably true that factors like altruism, paternalism, the desire to achieve economies of scale within the plan, and an interest in giving older employees the confidence to retire in a timely manner (the original purpose of corporate pensions) all foster corporate interest in auto-enrollment.

But, as I understand it, auto-enrollment is also driven by the need (among plan sponsors) to satisfy ERISA’s non-discrimination requirements and the desire (among asset managers) to maximize the flow of money into mutual funds. Rank-and-file employees tend to be cynical, and some of them probably ignore or avoid their 401(k) plans because they sense these unspoken motives and mistrust them.  

© 2011 RIJ Publishing LLC. All rights reserved.

Summer Cliffhangers in the VA Soap Opera

Once second-quarter variable annuity sales data are released some weeks from now, I think the numbers will reveal some movement in the industry rankings, caused by product moves among leading insurers. Moreover, other initiatives, still in the pipeline, will influence how the leader board looks over the remainder of the year.

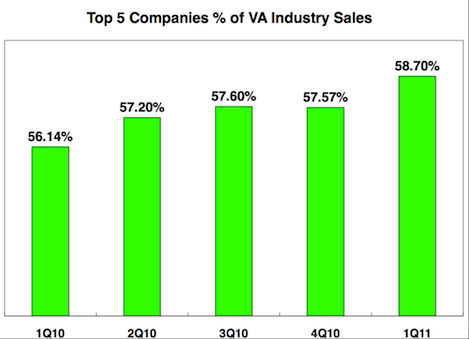
VA deposits are already concentrated among the top players and I expect that phenomenon to continue. The chart below shows the growing market share that the “big five”—Prudential Financial, MetLife, Jackson National, TIAA-CREF, and Lincoln Financial—amassed over the past five quarters.


Guaranteed living benefits are acknowledged as the main drivers of industry sales. A recent survey by actuarial firm Milliman Inc. revealed that, of 18 sampled companies, on average, 95% of VA purchasers elected a living benefit if one was available with their contracts. Many companies are likely experiencing this kind of high “take rate.”  

Starting last year (and well into 2011), a number of insurers also began to engage in “selective re-risking” to help spur their sales. This involved increasing the generosity of their benefits while adding elements to hedge certain risks, whether related to the equity markets, interest rates, or volatility.

This May, MetLife introduced GMIB Max, which sports a 6% annual rollup to its benefit base but requires the owner to invest in an abbreviated lineup of sub-accounts (all of which have a risk-management hook, particularly related to volatility).  The company’s GMIB Plus III, on the other hand, has a rollup of only 5% but allows more investment options. The two GMIBs share an attractive feature: they allow the owner to withdraw the greater of the applicable base rollup or any Required Minimum Distribution (RMD) on a dollar-for-dollar basis. In addition, if the RMD is taken from another tax-deferred source, its value (if greater than the rollup) will be added to the GMIB base.  

Other insurers have been building living benefits with similar trade-offs. Hartford, on June 13, rolled out two new lifetime withdrawal benefits that will be sold side by side: Future5 has a 5% base rollup and a relatively broad set of fund options, while Future6 has a 6% rollup but more sub-account restrictions, including monthly re-balancing of client assets. (See today’s cover story.)

Anecdotally, MetLife’s latest riders have sold exceptionally well, as the release of its Q2 sales results may show. The fact that Prudential and Jackson National have been taking de-risking measures could have given MetLife and others a competitive advantage.

Prudential re-worked its flagship living benefit in January, issuing a version called Highest Daily Lifetime Income, whose annual base rollup is 5%, a reduction from the 6% on the prior version. Prudential garnered “fire sales” into the HD Lifetime Six rider before it went off the market; in fact, the company drew in deposits of over $6.1 billion in 4Q10 and a bit more than $6.8 billion in 1Q11. We believe the latter figure to be an historical industry record for VA sales by a company in a single quarter.

For its part, Jackson National’s parent, British-based Prudential Plc, announced in May that it intends to purposely slow its VA sales in the U.S. through a combination of product modifications and pricing increases. We have already seen a few such changes. Even so, the insurer has only just started to de-risk; some of its changes are not scheduled to go into effect until August.

Just a few weeks ago, MetLife filed new income benefits with the SEC: GMIB Plus IV and GMIB Max II, with accompanying enhanced death benefits. Notably, many important elements of the contracts were missing in the SEC filings, their places held by the bracketed words: “to be filed by amendment.”

Among the items bracketed were the base rollup rates, dollar-for-dollar withdrawal amounts, details on ratchets of benefit bases to account value, enhanced annuity payout rates, launch dates, and pricing. The new optional death benefits, Enhanced Death Benefit III and Enhanced Death Benefit Max II, will no longer be available on a stand-alone basis. They must be teamed with their complementary GMIBs.

So, like a soap opera, the story of the VA space includes quite a few concurrent plot lines, and plenty of outstanding questions remain. Which way will MetLife go with its new benefits? Did Prudential’s sales fade in Q2, or will it retain the No. 1 spot in the standings? How will Jackson National’s cool-down plans be received? Can The Hartford spark a rebound with its new features? It will be interesting to see how these stories play out.

Steven D. McDonnell has analyzed and written about the variable annuity marketplace for over 10 years, first as a reporter for Annuity Market News, then as the first editor of Annuity Insight.com, a service of research firm Strategic Insight, LLC.  In 2006 he founded Soleares Research LLC, which publishes a weekly report on VA product issues. His readership includes major insurance companies, asset managers, actuarial firms and analysts.

© 2011 RIJ Publishing LLC. All rights reserved.

The Stag Brings Back GLWBs

By hiring Steve Kluever as its new vice president of global marketing last March, Hartford Life signaled that its variable annuity strategy was about to change. Kluever came from Jackson National, where he helped engineer that company’s post-financial-crisis VA sales surge.  

Indeed, changes were due. The company, like a few others, misread the VA market in the fall of 2009 when it brought out Personal Retirement Manager. Instead of offering the popular but risky guaranteed lifetime withdrawal benefit, the product encouraged contract owners to move assets gradually from mutual funds to a deferred income annuity.   

Steve Kluever

Hartford was de-risking because it was scorched in 2008. It had needed a $2.5 billion infusion from Allianz Life that October. The following month, it bought a small Florida bank to qualify for $4.6 billion under the Troubled Asset Relief Program. Its CEO, Liam McGee, at one point publicly signaled a retreat from VAs.

But the advisor market didn’t embrace simplified, de-risked, or SPIA-driven VAs, and Personal Retirement Manager didn’t sell as hoped. At year-end 2009, the contract ranked 29th of 50 in U.S. sales, according to Morningstar, with $276 million in fourth-quarter sales. It finished 50th of 50 in 2010, with sales of $156 million. 

“Because the Hartford didn’t offer a living benefit, that created challenges on the sales side,” Kluever (above) told RIJ recently. “We’re committed to the [variable annuity] space, and to reestablish ourselves and be competitive we knew we had to bring back living benefits.” 

So the Hartford’s VA engineers returned to the GLWB.  They wanted to sweeten it with a roll-up, but with minimum market risk exposure. So they took a page from the Prudential VA playbook and introduced a modified Constant Proportion Portfolio Insurance mechanism into the mix.  

The result was unveiled in mid-June, when Hartford introduced three new riders: Future5 (a GLWB with a 5%/10-year deferral bonus), Future6 (a GLWB with a 6%/10-year roll-up), and a SafetyPlus, a guaranteed minimum account balance (GMAB) with a xx% bonus to the benefit base after 10 years if the assets are transferred into the Personal Retirement Manager (still a contract option). 

 “It’s a fair statement to say that Future5 and Future6 were a rescue action on Personal Retirement Manager,” Kluever said.

The risks of the Future5 are controlled by a requirement that the client invest in certain designated equity-based models, called Personal Protection Portfolios (PPP). The risks of the richer Future6 and of the SafetyPlus GMAB are controlled by a requirement that half of a client’s assets go into the PPPs and half goes into a Portfolio Diversification Fund, or PDF.

The PDF uses a CPPI method to limit volatility, and aims for negative correlation with the performance of the rest of each client’s portfolio. The PDF assets are invested in three sleeves, of which one consists of futures and options. “That’s the derivative sleeve. It’s through that sleeve that we can bring in negative correlation,” Kluever said.

 Twenty-percent of the PDF is invested in an S&P Index Fund, 40% is invested in the BarCap Aggregate Bond Index (the former Lehman Aggregate Bond Index), and the last 40% is invested in futures and options.

“The derivative sleeve lowers the volatility.  It cuts off the high-highs and the low-lows. The theory is that, over time, it will perform like a 60/40 asset allocation but without big swings up or down. We went through a lot of back-testing to see it performed historically as well as intended. Based on those results, we settled on the 50% allocation to the PDF. For the other 50% we give people access to 10 models from 10 fund companies.” The Hartford will “periodically rebalance” the two halves of the portfolio to maintain the 50-50 allocation, according to the prospectus.

“If they aim for a 60/40-like performance, then their strategy is in line with other new products on the market,” said Ryan Hinchey, a consulting actuary and co-founder of the website and blog, Nobullannuities.com.

“But the only way to see how good these funds are is to observe how they behave. Variable annuities are opaque to being with, and [with dynamic asset allocation funds] they’ve added another layer of complexity. It sounds nice, but it’s hard to sell to advisors when there’s no track record to show how these funds will behave relative to the sales story.”

The lackluster sales of Personal Retirement Manager notwithstanding, Kluever believes that Hartford’s original instinct that investors are more risk-averse remains valid.  “We continue to hear that people are more interested in minimizing downside than maximizing upside,” Kluever said.

“They’ve seen two bear markets over last decade, and they’re looking to reduce volatility. They want asset classes that have better negative correlation to the S&P500,” he added. “When you couple the PDF with the other investments, it reduces the overall volatility of the clients’ experience. Our interests are aligned. Other insurance companies are moving in the same direction, toward reducing volatility. We just have a different way of doing it.”

If it sounds like Hartford is offering a smorgasbord to the consumer or advisor—well, that’s what worked for Kluever at Jackson National. He came to Hartford with a belief, grounded in Jackson National’s huge VA growth in the past two years, that giving advisors lots of options is the recipe for success in the VA space. 

I’ll be here three months, I was at Lincoln, Jackson, Hartford, and a lot of my philosophy is to give people choice,” he told RIJ. “Contract owners and advisors want choice. We gave people the choices rather than a one-size-fits-all. From manager selection to index versus active, we wanted to give people choice.”   

At Lincoln Financial from 1998 to 2003, Kluever worked in investment management and product development. He spent the next eight years at Jackson National, eventually as head of the product management group. During the latter part of his tenure there, the company shot from 14th to third in VA sales rankings.

Hartford is supporting its Future5/6 launch with a direct mail and media campaign aimed financial advisors with the theme, “Fresh Thinking from a Familiar Face,” Kluever told RIJ. “We’re going to the financial advisors who have stuck with us and to those who used to be big producers for us, to let them know we have a new VA. The reaction has been, ‘We’re glad to have you back.’

“We believe there’s a big opportunity for us. You still hear a lot of [insurance] companies saying that they’re continuing to pull back from VAs. We’re still seeing more folks pulling back than getting in, either by design or because they don’t want to be in that space.” 

Editor’s note: Hartford filed four contracts on June 3 with the SEC for a Personal Retirement Manager Foundation Contract, in an A share and an O share.  (The June 13 product prospectus included B, C, I and L shares). There are no roll-ups and there is no Portfolio Diversification Fund.

Contract owners may shift money into a Personal Retirement Manager for later annuitization, however. Investments must be in the designated asset allocations. Interestingly, the m&e charge is reduced for higher premiums. It ranges from 71 basis points on less than $50,000 in premium and falls to 17 basis points on $1 million or more.

In the A share contract, the upfront load ranges from 5.5% for premia under $50,000 and falls to 1% on premia of $1 million or more. There is only one age band, with a GLWB payout rate of 5% for individuals and 4.5% for couples.

© 2011 RIJ Publishing LLC. All rights reserved.

The Battle of the Sexes, Retirement Planning Division

They’re a not uncommon American couple in their late 50s. He pictures retirement in a rustic Colorado cabin, within casting distance of a trout stream. She envisions retirement in a low-maintenance condo in New Jersey, within walking distance of her grandchildren.

That’s part of the scenario conjured up by the 2011 Fidelity Investments Couples Retirement Study, which polled 648 married couples, ages 46 to 75 last May.  It found that one in three couples “either don’t agree or don’t know where they plan to live in retirement.” The survey also found that:

  • Less than one half of couples (41%) report making investment decisions for retirement jointly, emphasizing several areas in need of improvement.
  • Only 17% of couples are completely confident that either spouse is prepared to assume responsibility of their joint retirement finances, if necessary.
  • 33% of couples either don’t agree, or don’t know where they plan to live in retirement.
  • 62% of couples approaching retirement don’t agree on their expected retirement ages.
  • 73% of couples disagree on whether or not they have completed a detailed retirement income plan.
  • Nearly half (47%) of couples approaching retirement don’t agree on whether they will continue to work in retirement.
  • Just 35% of wives say they are confident in their ability to assume responsibility for household finances if required to do so (vs. 72% of husbands).
  • While 37% of husbands indicate that they are the primary retirement financial decision maker for the household, just 8% of women say the same.
  • Fewer wives (15%) than men (40%) consider themselves the “primary contact” for their investment professional.
  • Wives demonstrate less familiarity with aspects of retirement income-related topics than husbands. One example: 32% of wives say they do not know how much money they expect their income sources to generate monthly in retirement compared to just 15% of husbands.
  • Wives demonstrate lower risk tolerance and invest less aggressively than husbands. One in five (21%) wives are most interested in preserving wealth at the expense of lower returns vs. 16% of husbands.
  • Only 5% of wives describe themselves as investors (vs. 20% of husbands), rather characterizing themselves as a spender or saver.

Are the asset allocation models used in 401(k) plans subject to DoL disclosure requirements?

When a registered investment advisor or broker-dealer uses an asset allocation model to guide the investments of retirement plan participants, is that model a “designated investment alternative,” and must it meet Department of Labor disclosure requirements?

That’s a question that ERISA attorney Fred Reish posed in a recent e-mail broadcast.

Reish’s answer: “Based on informal discussions with the DOL, it appears that they are leaning toward the conclusion that models are designated investment alternatives. If so, the disclosure requirements would include, among other things, reports from recordkeepers about the performance history of the models.

“However, we believe that most recordkeepers have not been, and may not be able to (on a reasonable basis), calculate and report those returns. (Similar difficulties may exist for asset allocation models for other disclosures required by the regulations.) This could result in the inability to continue to use those models.

“However, if the model is ‘managed’ by a discretionary fiduciary, it appears that the DOL may conclude that is not a model, but instead an investment management service–which apparently would not be considered a DIA.”

© 2011 RIJ Publishing LLC. All rights reserved.

GAO paints a broad view of America’s retirement challenge

The General Accounting Office reported last week that it would be more cost-effective for people to delay Social Security and get a larger benefit than to take Social Security early and buy an income annuity to make up the difference. 

In its report, “Retirement Income: Ensuring Income Throughout Retirement Requires Difficult Choices,” the GAO took a broad look at retirement issues facing Americans and reviewed the various possible policy responses to those problems. 

In what was otherwise a recitation of facts already well known to those in the retirement industry, the GAO authors also produced a chart comparing two ways for a male Social Security beneficiary to generate a $16,000 lifetime income starting at age 66.

The beneficiary could start taking $12,000 at age 62 and then pay $71,000 at age 66 for an annuity that would pay out $4,000 a year and bring his income up to $16,000. Or he could wait until age 66 to claim Social Security and receive $16,000 a year for life (replacing the foregone Social Security income with $48,000 in private savings in the meantime).

The net savings for claiming later would be $23,000. Unfortunately, most Americans discount the value of their future income and choose to take Social Security benefits as soon as they can. According to the GAO report, 43.1% of eligible participants took their benefits right away between 1997 and 2005. About 14.1% waited until full retirement age and just 2.8% took benefits after their 66th birthdays. 

Women are more likely than men to face poverty in old age, the report showed. About 13.5% of women aged 75 and older lived in poverty during the years 2005 to 2009, while only 7.7% of elderly men were living in poverty. In 2009, an estimated 3.4 million Americans over age 65 lived in poverty.

Among the proposed public policy changes reviewed in the report:

  • Revise the safe harbor provisions for plan sponsors when selecting an annuity provider
  • Require plan sponsors to offer an annuity
  • Encourage plan sponsors to offer a default annuity
  • Modify tax laws on required minimum distributions to remove obstacles to deferred income annuities
  • Modify spousal protection provisions in defined contribution plans
  • Improve financial literacy regarding retirement income sufficiency

The GAO report was produced at the request of the Senate Select Committee on Aging.

© 2011 RIJ Publishing LLC. All rights reserved.

U.S. retirement assets hit $18 trillion again: ICI

Total U.S. retirement assets reached $18.084 trillion in the first quarter of 2011, according to the Investment Company Institute’s Retirement Industry Report. In nominal terms, that figure almost matched the all-time high of $18.124 trillion set in 3Q 2007.

That number represented the market value of assets held in IRAs, defined contribution plans, defined benefit plans, government plans at the federal, state and local levels, and annuities. Retirement assets had slumped to just $13.279 trillion in 1Q 2009.

Variable annuity mutual fund assets totaled $1.41 trillion in the 1Q 2011, the highest level since 3Q 2007. Only about 18% of VA mutual fund assets is in defined contribution plans, such as TIAA-CREF, and just seven percent is in VAs in IRAs. Three-quarters, or about $1.06 trillion, is in VAs held outside retirement accounts.

The percentage of non-retirement VA assets held in domestic equity funds has dropped from a high of 69% in 2000 to just 50% in 2010. As recently as 2006, domestic equity funds held a 62% share. In 2010, 24% of non-retirement VA assets were invested in bonds. In 2000, bonds held just a six percent share.

The amount of mutual fund assets in non-retirement VAs ($1.06 trillion) is about 20% as large as the total amount of the mutual fund assets in U.S. retirement accounts ($4.89 trillion).  The value of all mutual fund assets in the U.S. at the end of 2010 was $11.8 trillion—representing a rebound from $9.6 trillion in crisis-stricken 2008 but still shy of the record $12 trillion at the end of 2007.  

The growth curve of retirement assets since 1974 follows the growth curve of the major equity market indexes and the growth of the financial services industry. In 1974, retirement assets totaled just $368 billion ($1.745 trillion in current dollars).

The ICI data showed that annuity assets have consistently been less than 10% of retirement assets since the early 1980s, with a brief exception in the first quarter of 2009. The value of annuity assets held outside retirement plans was $1.637 trillion in 1Q 2011, its highest point since the third quarter of 2007. 

Looking at the IRA market, the data from 1975 through today shows that most IRA assets were originally held at banks and thrifts. In the 1980s, mutual funds and brokerage accounts gradually began capturing IRA assets. In 1990, mutual funds held 22% of iRA assets, banks held 42%, and brokerages held 30%.

After that, banks fell back, mutual funds surged forward and brokerages held fairly steady. Today, IRAs hold $4.861 trillion, with 47% in mutual funds, 36% in brokerage accounts (except mutual funds), 10% in banks and 7% in life insurance companies. 

Defined contribution plans hold $4.696 trillion today, with 401(k) plans accounting for $3,175 trillion of that. So, 401(k) plans represent the single largest pool of retirement assets, followed by mutual funds ($2.3 trillion) and brokerage accounts ($1.745 trillion).  

Since the passage of ERISA in 1974, retirement assets have come to represent an increasing share of U.S. household assets. In 1974, the share was 11%. By 2000, it reached 35%; since then it has climbed to 37%. Total U.S. financial assets peaked at $50.662 trillion in the second quarter of 2007. At the end of 1Q 2011, they were $48.847 trillion.

The ICI data doesn’t show the distribution of retirement assets across different segments of the U.S. population. For instance, according to Spectrem, about half of the $2.3 trillion in 401(k) plans is in plans with 5,000 or more participants. In 2006, the EBRI/ICI Participant-Directed Retirement Plan Data Collection Project showed that just over half of all 401(k) accounts were worth less than $20,000.

The GAO has estimated that only about 53% of private sector U.S. workers have access to employer-sponsored retirement plans. The data suggests that $18 trillion in retirement assets is more or less concentrated in the largest accounts among long-tenured, high-income employees in large employer-sponsored plans. 

© 2011 RIJ Publishing LLC. All rights reserved.

An Actuary’s View of the VA Market

Tim Pfeifer, president of Pfeifer Advisory LLC in Libertyville, Illinois, works with annuity issuers on the design of variable annuity contracts. He is a former Milliman actuary who, since 1986, has been a consultant to life insurance companies, regulators, marketing organizations, banks and mutual fund companies. He formed his own consulting firm in 2008.    

Last week, Pfeifer shared his views about the current state of the VA industry in an interview with Retirement Income Journal editor Kerry Pechter.

RIJ: Tim, what’s driving the variable annuity market today? Downside protection? Upside potential? Liquidity? Tax-deferral?

Pfeifer: We’re basically on a one-way street as far as guaranteed lifetime withdrawal benefits being the VA story. Today’s customers want control and guarantees. Other factors—cheap pricing and tax efficiency, for example—are secondary, within reason of course. That’s the direction the industry is moving in. The agencies, reps and customers want those two things.

RIJ: But haven’t companies hurt the value proposition by diluting those guarantees?

Pfeifer: After the crisis, we went through a period of de-risking that saw some companies leave the business entirely. The more common [method of de-risking] was to increase prices and to restrict which assets could be wrapped in the guarantee. The market has responded pretty favorably to both of those things.

RIJ: The pendulum might even be swinging the other way. You’ve mentioned the word “re-risking.”

Pfeifer: When I use the term re-risking, I don’t mean that carriers are backing away from the required asset allocations, or the passive accounts, or limiting activity on the underlying investments or notching their pricing up a bit. I mean that I see companies making certain components of their lifetime withdrawal guarantee more attractive. Investors aren’t throwing caution to the wind, but the direction is away from total avoidance of risk.

The attitude is, ‘Let’s find designs that are clever.’ Prudential’s success with asset transfer is getting play at other carriers. In their labs, a lot of companies are looking at something similar that gives them the ability to move money around on pre-programmed basis. The client may get a little more latitude to allocate assets than in some of the existing designs, but certainly not full latitude, and the carrier has the contractual right to re-allocate assets under certain circumstances.

RIJ: What’s your view of the concentration of the business among a handful of issuers?

Pfeifer: I see a continued movement toward the ‘rich getting richer.’ The VA business has always been a business of scale. The bigger players have a variety of advantages, up and down the line. They have the scale to negotiate better agreements with asset managers and administrative partners. In addition, the larger players have been innovative products on the product design side, and have advantages on the expense and risk management fronts.   

The top six to eight VA players will continue  to gather more market share. With the possible exception of mid-tier players  who sell through captive distribution, it will be difficult for a carrier selling $700-800 million or less of VAs each year to find the economics attractive. It is simply getting harder and  harder to compete against the large participants. Other competitive advantages must be sought.

RIJ: Are some companies growing too fast for their own good?

Pfeifer: As long as you’ve been writing a steady amount of business, that helps on the risk management side. A company that writes $10 billion worth of business in one year and writes a lot less than that the year before and after has a different risk profile than the company that writes $2 billion a year. The more you spread your sales over different economic cycles and market conditions, the better off you are likely to be from a risk perspective.

RIJ: Consumers are buying this product for guaranteed income. What part do the roll-up percentages play in making the income component attractive?

Pfeifer: The roll-up percentage, in my opinion, is a bigger sales story than the ultimate payout percentage. It’s also a source of potential risk if not sold properly. For instance, a friend of mine bought three variable annuities from three different carriers, all with GLWBs. He’s no dummy, but he thought he was getting a five to seven percentage roll-up on money that he thought he could take out as a lump sum. That element of the design—the roll-up percentage—is the product’s strong point, but it has to be sold accurately.

RIJ: That sort of confusion could come back to haunt the issuers.

Pfeifer: I love the GLWB. I was involved in the early days of the feature. It speaks to a need out there and the industry will be able to take advantage of its combination of control and guarantees. But it’s incumbent upon everybody to sell these the right way.

RIJ: Thanks, Tim.

© 2011 RIJ Publishing LLC. All rights reserved.

Lonelier at the Top

Even though many in the VA industry wish it weren’t so, sales of individual contracts became even more concentrated among the three biggest sellers during the year that ended March 31, 2011, according to Morningstar’s quarterly VA report.

Prudential, MetLife and Jackson National, which have dominated sales since the post-financial crisis industry shake-out, added 2.12%, 1.83% and 1.79% of market share, respectively. Together they accounted for more than 44% of sales. The top five firms took almost 60% of total sales.

Executives at competing VA issuers wish the wealth were spread more evenly. But even some executives at the sales leaders worry about accumulating too much risk in too short a time. In fact, all three have taken steps in the past year to “de-risk” their contracts.

Overall, the VA industry posted new sales of $38.7 billion in the first quarter, up 23.2% from the $31.4 billion sold in first quarter 2010. First quarter sales were also 4.3% higher than fourth quarter 2010 sales of $37.1 billion. Net cash flow—the best measure of industry growth—also rose in the first quarter, to $5.8 billion from $5.4 billion in the fourth quarter and $3.6 billion in the first quarter of 2010, up 8.4% and 63.9% respectively.

Assets under management set an all-time record of $1.56 trillion, up 3.6% from the year-end 2010 assets of $1.50 trillion.TIAA-CREF’s group annuity, which is the plan for university and college employees, accounts for almost a quarter of all VA assets, with $383 billion. It is followed by MetLife ($132.4 billion), Prudential ($109.1 billion), AXA Equitable ($91.5 billion) and Lincoln Financial ($85.2 billion). Jackson National is the fastest growing VA seller, but still has assets of just $59.95 billion.

The distribution channel sales leaders continued to be Prudential and MetLife, with Prudential taking the number one spot in the bank, independent planner, and wirehouse channels, MetLife leading in regional firms and Ameriprise ranking first in the captive agency channel (excluding TIAA-CREF).

Rounding out the top 5 in each channel were Jackson National, MetLife, Nationwide, and Pacific Life in the banks; Jackson National, Metlife, Lincoln National and Allianz in the independent shops; MetLife, Nationwide, Lincoln National and Sun Life in the wirehouses; Jackson National, Lincoln Financial, Protective and Prudential in the regional firms; and finally MetLife, AXA, SunAmerica, and Prudential in the captive agency channel.

The April sales estimate of $13.9 billion, which was 13.8% higher than April 2010 estimated sales of $12.2 billion, shows a positive start to the second quarter of 2011. If momentum builds from product and benefit launches and the May sales are strong we could see second quarter sales exceed the $40 billion mark for the first time since the second quarter of 2008.

About 80% of variable annuity contracts sold are either B-shares (54%), where the carrier recoups the up-front commission that it pays advisor from the client through the mortality and expense risk (M&E) charge over time, or L-shares, where the carrier pays a combination of up-front and trail commissions. In other words, relatively few VA contracts are sold without a strong financial incentive for the advisor. Variable annuities are still a product that’s sold, not bought.

© 2011 RIJ Publishing LLC. All rights reserved.