If you’re a plan sponsor or an IRA custodian and you’d like to offer your participants or account holders several annuity options, your IT department traditionally faced the expensive and duplicative hassle of linking to each annuity manufacturer separately.
Enter DST Systems, the Kansas City, Missouri-based financial services technology firm (2010 revenues, $425 million). Last year, Larry Kiefer, head of business development for DST’s US recordkeeping business, convinced his senior executives to support the creation of a hub, leveraging existing DST technology, that would solve that problem—and, in effect, to place a corporate bet that Boomer demand for guaranteed income products will eventually erupt.
If we built it, they—meaning annuity manufacturers, plan sponsors, IRA custodians, and their participants and account holders—will come, Kiefer told them, in effect.
Now the hub, which DST has branded “RICC” (for Retirement Income Information Clearing and Calculation system (RICC), is near completion. Not long ago, Kiefer took a break from pitching the new platform to annuity manufacturers to talk with RIJ about it. with RIJ.
RIJ: Could you give us a quick working definition of RICC?
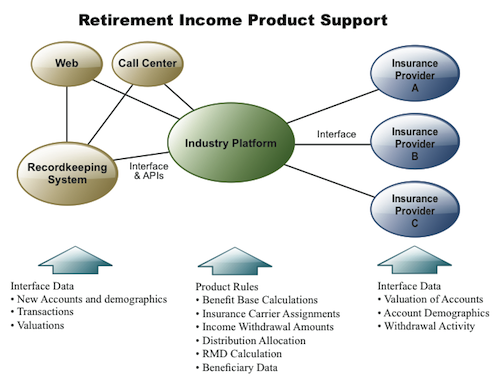
KIEFER: Many people have described it as middleware. It sits in the middle between the recordkeeping systems of either a defined contribution plan or an IRA provider, on the one hand, and the insurers who manufacture the guaranteed income products on the other. It’s also a way for a single annuity manufacturer to distribute its products to multiple users through a single platform.
RIJ: And what is the problem that RICC is designed to address?
KIEFER: The industry faces a chicken-or-egg situation. Without having seen a lot of demand from participants or IRA owners, many of the recordkeepers are reluctant to adapt their systems for retirement income products. At the same time, the manufacturers of those products are reluctant to provide the funds for system development without first seeing a higher adoption rate among the recordkeepers. By eliminating the need for new system development [by manufacturers and recordkeepers], we think we can generate a critical mass of adoption. Our product helps industry get past the existing barriers to entry.
RIJ: Can you offer a specific example of one of the technical barriers?
KIEFER: Let’s say that you’re a participant in a Boeing 401(k) plan that’s record-kept by Aon Hewitt, and that you’re using one of the available lifetime income products. You go into the Hewitt site and see the product listed in your account. But a message will tell you that in order to see the amount in your account, you will have to leave the Hewitt site and log into the manufacturer’s site, with a different user name and password. With our system, you could click on your account and you’d go to our site, with no need to sign on again. Your balances would pop up on the screen. It would be a seamless, secure experience for the consumer.
Another issue is that each of the income products has specific rules, and the recordkeeping system has to adapt to each of them. For instance, you might have to be at least 50 years old to purchase a particular product or benefit. The recordkeeping systems don’t want to have to adapt to a separate set of rules for each product or create a stream back to each insurer. Some recordkeepers have spent as much as seven figures for a single connection with a manufacturer. They don’t want to have to do that with six different manufacturers in order to offer six different options. With the hub, there would be a single connection—with us.

RIJ: Are you using the SPARK data standards for RICC?
KIEFER: The process is still evolving. We started with our own recordkeeping systems that have standard communication protocols and we are publishing them so that any recordkeeper can use them on areal time basis. We participated in the development of the SPARK standards, and we are leveraging those standards as well. The use of those standards is not as prevalent as it will be in the future, and it remains to be seen how those will evolve. We’ll see how prevalent and how deep the usage of standards becomes.
RIJ: Who do you see as the target market for RICC?
KIEFER: The product manufacturers. We want them to put their products on the platform. We talk to the recordkeepers too, but the manufacturers drive the process. The manufacturers call on the plan sponsors to adopt their products. The pressure on manufacturers to expand their distribution is stronger than the demand coming from the plan sponsors.
Years ago, most 401(k) plans had proprietary funds, and now everybody is on open-architecture. You’ll see the same type of wave happening in income products as in funds, as more plan sponsors demand income products and ask their recordkeepers to adapt to them. Our system will make it easier for recordkeepers to adapt. For the manufacturers, there’s a cost to being on the platform. We do not charge the recordkeeper. The challenge is to convince the recordkeeper that it’s worthwhile to build a connection to us using the SPARK standards.
RIJ: It’s my understanding that asset managers, other service providers, and even plan sponsors now see income products as a desirable way retain to assets under management long after employees leave the plan. Is that an accurate assessment?
KIEFER: “It is accurate to say that the asset managers are interested in retention. That is one reason why they are developing the [income] products. There’s also a recognition that participants need to construct a personal retirement plan going forward. Just accumulating a balance in DC plan isn’t enough. Just as participants learned about asset allocation and risk, now they’re learning that planning for longevity is also a part of it. You’re starting to see more and more discussion about building retirement income plans and how to ensure the longevity of the savings. When you’re talking about the mass affluent, it’s even more important.
RIJ: As I understand it, DST isn’t the only company working on this type of technology.
KIEFER: That’s right. SunGard and Blackrock have developed the Lifetime Income Window. SunGard says it is open to anyone who wants to use it. AllianceBernstein has a solution but theirs is more aimed at building a structure that allows multiple insurers to guarantee a single income product. We can also accommodate that on our platform.
RIJ: Where are you in terms of bringing RICC to market?
KIEFER: We’re testing right now, and we expect to be in production this summer. We are talking to a number of manufacturers about putting their products on the platform. We intend to support most of the guaranteed products. You can also have fixed guaranteed products and stand-alone living benefits. [For DST’s purposes], the underlying investment doesn’t matter. As for what products each plan sponsor offers, that’s a decision made by each plan sponsor. We’re not building a supermarket.
RIJ: How big a market do you see for income products in employer-sponsored plans and IRAs?
KIEFER: Our model for compensation is based on the number of participants, not the level of assets. But if you think that there’s in the neighborhood of $11 trillion in qualified plan and IRA assets, and that income products are targeted at the people in the age 55 and older bracket who control 40% to 45% of those assets, and that you might get an adoption rate of between 7% and 15%, that means $200 billion to $500 billion in guaranteed income assets, at today’s rates. Right now the balance between IRAs and in-plan assets is about 45/55. In 2015, it might be up to 65/35.
RIJ: Thank you, Larry.
© 2011 RIJ Publishing LLC. All rights reserved.