While studying a table of annual fixed indexed annuity (FIA) cash flows, I noticed a row labeled “Investment Returns.” The table came from LIMRA’s Secure Retirement Institute (SRI). It covered the flows for fixed annuities, variable annuities and FIAs for the period from 2007 to the first quarter of 2021. SRI had collected the in-flow, out-flow data from US annuity issuers.
It’s almost pointless to try and draw conclusions about the potential yield of any type of financial asset class from historical averages. But it’s rare to find data on the yields of FIAs, so these numbers were noteworthy.
There was another reason to zone in on these numbers. FIA contracts have a current combined account value of about $520 billion. Even today, that’s a large sum. The low interest rate environment makes buying FIAs attractive to older investors looking for better, safer yields can deliver. For different reasons, it makes selling FIAs attractive to advisers, life insurers, and big private equity firms like Blackstone and KKR that want to manage FIA assets.
FIAs can’t lose money over a specified crediting term. Their growth potential is measured by the exposure they offer to a given equity index or hybrid index. The carrier uses a small percentage of the investor’s premium to buy options on the index. If the index goes up, the investor gains a portion of the index gain.
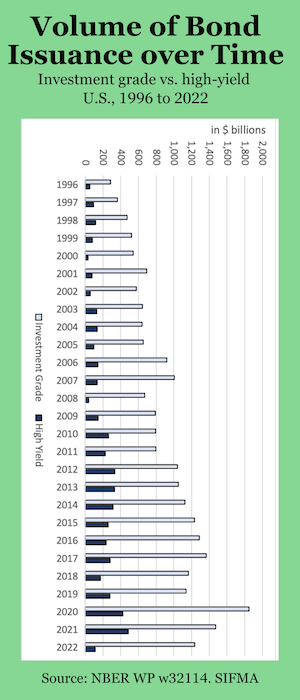
The amount of upside an FIA contract can offer is sensitive to interest rates. The life insurer’s budget for buying options on the index is limited by the yield on its general account investments, which are mainly in bonds. If yields are low, options budgets may shrink. The FIA contract won’t offer as much potential upside.
My calculations, using the LIMRA SRI data, suggested an average return of 3.23% for the period from the start of 2011 to the end of 2020. I took the FIA investment returns for each year, and divided them by the average of the year’s beginning and ending asset levels. The range of annual averages was 1.59% to 3.99%. (See below). Over the same period, the S&P 500, the most popular FIA index, lost money in only one calendar year—a negative 4.38% in 2018—while rising to 3,756 from 1,286 over those 10 years.
The S&P 500 Index includes dividends, but most FIAs offer a no-dividend version of the S&P 500 Index to policyholders. Options on the no-dividend version of the index cost less, so carriers can offer higher caps or participation rates.
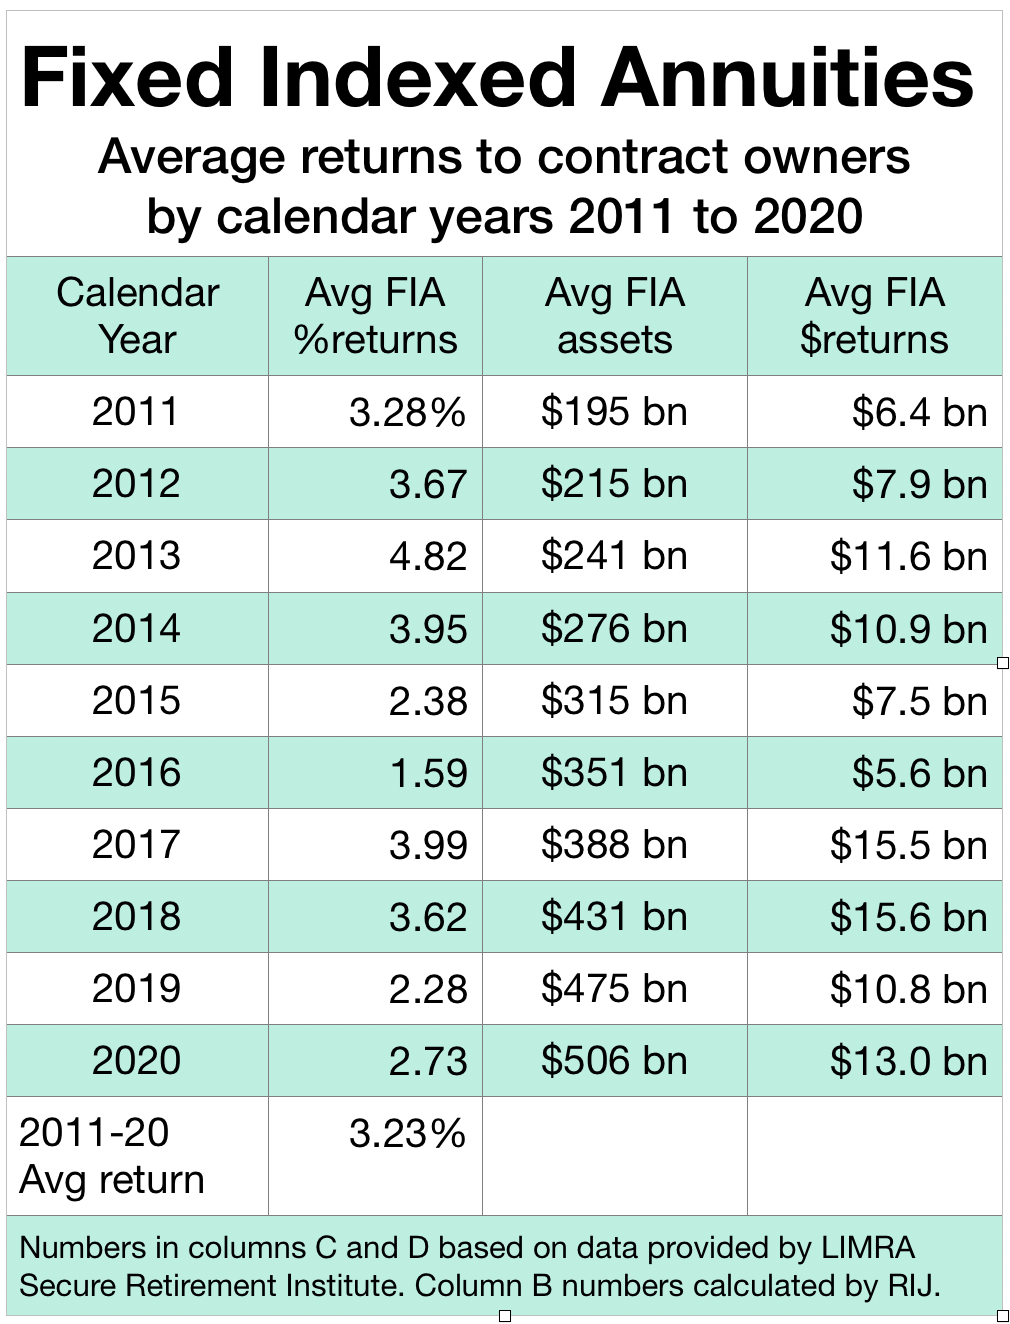
That 3.23% is an average of annual averages, so it might mean nothing. It might well be misleading. It may also mean that contract owners didn’t use the contracts optimally. Or it might suggest that the typical owner of a typical FIA over the decade from 2011 to 2010 would earn about the same yield over that period as a person investing in a total bond market index fund—albeit without fear of ending the decade with a loss.
Todd Giesing, assistant vice president, SRI Annuity Research, explained the data to RIJ. “The investment returns represent what was paid into the contract owners’ accounts based on the crediting formulas specific to the contracts. There are a lot of variables [that affect the year’s returns], including when the credits get paid; some contracts have a two-year or five-year crediting term,” Giesing said.
He noted that the data is based on reports from life insurers accounting for about 75% of the FIA market. LIMRA “grosses it up” or extrapolates from that to create what it believes to be a “reasonable” reflection of the industry’s overall returns to policyholders per calendar year.
The data is based on flows into and out of all FIAs, including those with and without commission, and with and without living benefit riders. No-commission FIAs for fee-based advisers tend to have richer crediting rates than traditional FIAs, because the adviser charges the client an advisory fee instead of receiving a commission from the carrier. FIAs with lifetime income benefits tend to have less rich crediting rates, because of the emphasis on income. The data includes the roughly 10% of assets that typically are allocated to the contract’s fixed account, which would pull down average returns. The LIMRA data is based on calendar years, while an individual’s contract years—the dates that determine returns–depend on the date when he or she happened to buy the contract.
As with any investment product, FIA historical returns do not predict future returns. These averages also don’t reflect the range of returns that individuals might receive—although the range of returns across a period of 10 years might—but wouldn’t necessarily—shed light on that.
“You’ll have some people making seven or eight percent in a year, and other people, especially if they invested in the fixed account, making one percent,” Giesing told RIJ.
“Although investors could earn much more than those returns, it is not surprising that investors have difficulty selecting an appropriate mix of strategies that could result in higher returns,” said Jeremy Alexander of Beacon Research, which tracks annuity sales data.
Sheryl Moore, founder of Wink, Inc., which collects data from issuers of all types of annuities, said my numbers don’t match her experience. She thinks they’re too low. “Until I can validate the source of LIMRA’s data, I cannot comment really,” she told RIJ this week. “This information has not existed before. As recently as six months ago, insurance companies were telling me that this data did not exist.” She did not offer competing data.
Bryan Anderson, an FIA agent and founder of AnnuityStraightTalk in northwest Montana, looked at the data as well. “At first glance the numbers look low. But then I realized that over the time period, most contract were sold with income riders,” he told RIJ.
“Income contracts don’t typically have a high growth factor and the fees along with distributions would further drag down asset values,” Anderson added. “I’m not sure there would be any way to factor those for calculations. But I am certain it would make a meaningful difference. I do my calculations for effective yield for each client on contract anniversaries, but don’t keep a working copy of all combined.”
Another FIA watcher, who asked not to be quoted by name, said the LIMRA data “lines up with the very limited actual policy return data I collected for a few years. My guess is, overall, you’re in the ballpark.”
© 2021 RIJ Publishing LLC. All rights reserved.