Archives: Articles

IssueM Articles

Economy improving amid anxiety about end of QE2: TrimTabs

Income and employment are increasing at much stronger rates than the Bureau of Economic Analysis (BEA) and the Bureau of Labor Statistics (BLS) are reporting, according to TrimTabs Investment Research.

In a research note, TrimTabs’ real-time and near real-time indicators point to a rapid acceleration in economic growth:

  • The TrimTabs’ real-time measure of wages and salaries posted a huge year-ago increase of 8.6% in March, up markedly from 4.7% in February and the largest increase since 2006. TrimTabs’ data for the first six days in April show the strong growth trend is continuing. Meanwhile the BEA just released their data for February documenting an increase in wages and salaries of 4.1% year-over-year. Data for March will not be available until April 29.
  • The TrimTabs tax-based employment model shows that the U.S. economy added 293,000 jobs in March, 36% higher than the BLS estimate of 216,000 new jobs.
  • The TrimTabs Online Job Postings Index is up 11.9% in 2011.
  • The four-week average of new claims for unemployment insurance sits at 394,250, just above the lowest level since July 2008.

“Our real-time data already shows that wage and salary growth accelerated sharply in March,” said Madeline Schnapp, Director of Macroeconomic Research at TrimTabs. “Meanwhile it took the BEA until last week to release an estimate for February while we are already analyzing growth trends for early April.”

While TrimTabs’ research points to healthy economic growth, the company is concerned about the health of the U.S. economy as government stimulus measures begin to wane in the second half of the year.

“We are happy to finally see stronger economic growth in the wake of trillions of dollars in fiscal and monetary stimulus,” Schnapp noted. “Our biggest fear concerns how the economy will perform after the Feds quit QE2 cold turkey in June. We are far from convinced that the recent surge in economic growth is sustainable.”

Schnapp says that TrimTabs’ real-time analysis of daily tax deposits provides a more reliable measure of income and employment because it is a real-time measure of income from all salaried U.S. employees. Meanwhile the BEA and BLS initial estimates rely on either historical data or surveys and are subject to frequent and at times sizeable revisions. 

Additionally, TrimTabs estimates are available immediately after the end of the reporting period, while estimates from the BEA and the BLS are released in lagged fashion. Government statistics reflect critical economic changes only after the fact, not in real time.

After 2010, nowhere to go but up for fixed annuities

The Fed’s loose interest rate policy helps the government finance its bailouts and helps banks recover from the financial crisis, but it has next to pure pain for fixed income investors—and for marketers of fixed annuities.


Estimated fixed annuity sales by banks and other depository institutions were $3.17 billion in fourth quarter 2010, down 48% from fourth quarter 2009, according to the American Bankers Insurance Association.

Quarter-to-quarter sales declined 20%.  Sales in calendar year 2010 fell 53% to an about $15.53 billion. Falling sales of fixed rate annuities without market-value adjustments (MVAs) drove overall results relative to all three periods, according to data from the Beacon Research Fixed Annuity Premium Study.


“The current interest rate environment suggests that fixed annuity sales in banks will gradually increase in 2011,” said Jeremy Alexander, president and CEO of Beacon Research.  “However, fixed annuities may not do as well as expected if banks raise certificate of deposit rates aggressively to attract deposits as the economy improves. Consumers’ inflationary expectations may also limit sales.”

The bank channel, where Western National Life was the sales leader, was an isolated bright spot. One-third of the bank channel carriers tracked by Beacon’s study reported improved fourth quarter sales, and about 22% did better quarter-to-quarter.


Two fixed annuity issuers dropped out of the top ten from third to fourth quarter 2010, and were replaced by Midland National and Genworth.  Fourth quarter 2010 bank channel results for the ten leading companies were as follows:


Fixed annuity issuer 

  Bank sales (000)

Western National Life           

$1,055,552

New York Life                          

     453,393

Great American Financial Resources Inc.

     235,476

Lincoln Financial Group Distributors

     219,337

W&S Financial Group Distributors

     128,577

American National

     121,206

Protective Life                          

       97,213

Midland National                                  

       96,502

Pacific Life                                   

       90,853

Genworth                                          

       66,374


The New York Life Preferred Fixed Annuity moved up one place to become fourth quarter’s bestselling fixed annuity in banks.  Like eight of the top ten, it is a fixed rate non-MVA product. Lincoln Financial Group’s Lincoln New Directions remained the only indexed annuity among the top ten sellers. 

The New York Life Income Annuity continued as the bank channel’s only top-selling income annuity, moving up two notches to come in seventh.  Once again, half of the quarter’s bank bestsellers were fixed rate non-MVA products issued by Western National. Fourth quarter’s leading bank-sold annuities were as follows:                                        

Company

Product

Product type

New York Life

NYL Preferred Fixed Annuity

Fixed Rate Non-MVA

Lincoln Financial Group

Lincoln New Directions

Indexed

Western National Life

Flex 7

Fixed Rate Non-MVA

Western National Life

Flex 5

Fixed Rate Non-MVA

Great American Financial

AssurancePlus 7

Fixed Rate Non-MVA

Western National Life

Proprietary Bank Product A

Fixed Rate Non-MVA

New York Life

NYL Lifetime Income Annuity

Income

Western National Life

Proprietary Bank Product F

Fixed Rate Non-MVA

Western & Southern Life

MultiRate Annuity

Fixed Rate Non-MVA

Western National Life

Proprietary Bank Product B

Fixed Rate Non-MVA


The American Bankers Insurance Association (ABIA) is the separately chartered insurance affiliate of the American Bankers Association (ABA) and is the only Washington, D.C.-based full service association for bank insurance interests. Additional information on the ABIA can be found on the Internet at www.theabia.com.

Beacon Research is an independent research company and application service provider founded in 1997 and based in Evanston, IL. Beacon tracks fixed and variable annuity features, rates and sales. Financial institutions use its systems at www.annuitynexus.com for compliance review of 1035 exchanges, sales support, conservation and product research.


What Advisors Say About Wholesalers, Etc.

Financial advisors will make many of the decisions that determine how Boomer retirees and pre-retirees invest hundreds of billions of dollars in savings. So they’ve always been a critical market for fund companies and variable annuity manufacturers. But what does this market want? 

Well, listen for yourself.

Besides collecting survey data on advisor sentiment every year (see this week’s cover story), Howard Schneider of GDC Research and Dennis Gallant of Practical Perspectives have also gleaned candid, anonymous comments from hundreds of advisors—comments that annuity wholesalers might find useful.   

“Advisors don’t think about retirement income in the same way that the retirement industry does,” Schneider told RIJ. “For advisors, retirement isn’t only about generating income. Clients come into the office and say they want to retire and play golf or visit the grandchildren. The advisor asks, ‘And what will you do with the other 10 months?’ Or the client comes in an asks, ‘Do I have enough money?’ ‘To do what,’ says the advisor? It’s like being asked, is there enough gas in my car? To do what? Drive to the 7-11? Yes. Drive to Florida? No. An advisor has to touch on all of these issues.”

With regard to the economy, advisors “are very concerned about interest rates,” Schneider said. “Their big challenge in building portfolios is deal with risking. They’re looking over their shoulders and wondering when the other economic shoe will drop. They’re saying,  There still seems to be a lot of risk. How do I manage that, especially when fixed income investments have  nowhere to go but down in value and don’t provide enough income to live on. That’s why variable annuities with income riders are something they say they’ll use more of.”

Schneider continued, “Advisors say one of their biggest problems is managing expectations. One manager created a portfolio that could deliver an income of $4,000 a month, but the client said he needed $6,000. The manager said, but your money will probably only last 15 years that way. The client said, ‘You’ll figure something out.’ Advisors say that one of the differences between first-stage Boomers and the Silent Generation is that the Silent Generation was willing to live more conservatively in retirement. Boomers don’t want to make any sacrifices.”

Below are some of the direct comments from advisors that Schneider and Gallant compiled during their most recent survey, Trends in Retirement Income Delivery: Advisor Portfolio Construction, Product Usage and Sales Support:

  • “Annuity dealers are not always right in suggesting an annuity for every account or occasion—it seems they forget the annuities are only as good as the worth of the company behind them as we saw with AIG—they seem to be the only ones really looking and asking for retirement business.”
  • “Income from short term liquid assets is very challenging. CD and money market rates are horrible.”
  • “Wholesalers should keep the golf balls, umbrellas, coffee mugs, etc., and provide as much info, training and current ideas as possible. The wholesalers who get Moshe Milevsky and Nick Murray in front of me will get a large part of my attention and the attention of my clients.”
  • “Our broker back-office doesn’t understand annuities and they are making it impossible to do business. They don’t know how to handle annuities and the annuity companies are being bullied by them into handling annuities in ways good for firm but not for client!!!! Very scary.”
  • “Nothing is guaranteed, therefore [I] can never use that word with clients.”
  • “I am more interested in receiving information and training than in getting meaningless designations.”
  • “Challenging at best, client expectations are far too high; [we] need to do away with 401(k)s and go back to a form of pensions.”
  • “Crucial topic. Very underserved.”
  • “Most of my clients are already retired and I provide risk management and manage the portfolios to provide low volatility and a better than average gain by active management techniques.”
  • “Less concern of suppliers on competitive edge and MORE consistency in support of the available products.”
  • “We have to continue to re-evaluate.”
  • “I view retirement income as simply one very important component of the overall financial planning process.”
  • “Conservative or risk-mitigating retirement income related investment products continue to lag in innovation and flexibility and higher yield possibilities, overall.”
  • “A comprehensive web site that compares all annuity companies and products would be helpful.”

How To Market to Advisors

Are we there yet?

The years have been slipping by, the oldest Boomers are edging into retirement, and manufacturers of income products are still waiting for the so-called tipping point when they feel the tug of serious demand for their wares from retirees and their advisors.

Howard Schneider of GDC Research sees evidence that we’ve reached that point. While most advisors are still fence-sitting with regard to retirement income, he told RIJ, the inexorable aging of their clients is pushing more of them to act.

“It’s here,” Schneider said. “We’re in the early stages of a marketplace that will see tremendous growth. It’s not well developed yet, but retirement income is becoming part of the base of all advisors. Advisors say it’s real.”

Schneider and colleague Dennis Gallant of Practical Perspectives have periodically surveyed advisors in recent years on their attitudes toward retirement income planning. Their latest report, “Trends in Retirement Income Delivery: Advisor Portfolio Construction, Product Usage and Sales Support,” is just out.

One big takeaway: when marketing to advisors, don’t focus entirely on whether they’re in the wirehouse, independent, RIA or bank channel. Focus instead on the number of retired clients they have, which of the three major types of retirement income strategies they practice, and whether they’ve just begun to think about income planning as distinct from accumulation-stage planning.

For instance, one way that Schneider and Gallant segment advisors is by their “Retirement Income Client Quotient,” a ratio they’ve invented that refers to the percentage of an advisor’s clients who are within three years of retirement or retired. There are five levels of RICQ:

  • Fledgling, with a RICQ of 20% or less.      
  • Emergent, with a RICQ of 21% to 40%. 
  • Transitional, with a RICQ of 41% to 60%.
  • Committed, with a RICQ of 60% to 80%.
  • Elite, with a RICQ over 80%. 

Schneider noted that the Fledging group has shrunk to 7% from 15% of the advisor universe in one year, while the Committed group (include Elites) has grown to 20% from 18% in a year. While the Elite group, which Schneider estimates at about 5,000 advisors across all channels, is already receptive to retirement income messages, the bigger opportunity for product marketers may lie with the transitional and emergent groups, which include some 68% of advisors.

Schneider and Gallant also divide advisors by the retirement income philosophy they follow. Advisors tend to use one of three core approaches:

  • Risk-adjusted total return approach, with a focus on optimizing total return of the client portfolio. Also known as the systematic withdrawal method. 
  • Pooled or bucket approach, with an emphasis on managing assets across duration- based short, intermediate and long-term pools.
  • Hybrid or income floor approach, with a goal of providing assured income for client needs while managing risky assets for ongoing growth. It often combines risky and insured products.

“[Retirement] is unlike the accumulation phase, where all the advisors do some version of Modern Portfolio Theory,” Schneider said. “For retirement income, 40% to 45% of advisors do the risk-adjusted total return method. They’ll use income vehicles for diversification. not income. About a quarter of the market uses either the pool or bucket approach. And about 30% use the income floor or hybrid approach, which combines the other two.”

How does a marketer find out which strategy an advisor uses? “You have to know the advisor and how the advisor provides income for their client. You’ve got to say, “If you’re trying to manage a portfolio this way, here’s how you can use our solution.’”

A third way that the researchers segment advisors is by their stage of evolution toward the retirement opportunity. “If you could know only one thing about an advisor, you want to know what their management philosophy is. But you also need to know the stage they’re in,” Schneider said.

He and Gallant identify four stages of familiarity:

  • Unbelievers. This group, which includes many older advisors, doesn’t recognize retirement income planning as a distinct discipline.
  • Uneducated. This group, which includes many younger advisors with younger clients, understands the retirement income challenge but isn’t engaged with it.
  • Aware. This group includes “advisors who understand the potential of the market and are in various stages of transitioning a practice to retirement income.”
  • Best Practice. Members of this group have been serving the retirement income market for many years, and have developed a “deep, well-honed” process that they aren’t going to change.

The greatest opportunity for manufacturers lies among the Aware advisors, Schneider said. “Someone in the aware group may be more receptive [to wholesalers] than someone who is already got things in place, and knows what he or she is doing.  The best- practice group won’t be as receptive to new solutions. They’ve already figured out the puzzle and built a business around it.”

How do manufacturers figure out which segments an advisor falls into? “It requires a lot of pick and shovel work to do that,” Schneider said.

In emphasizing these other forms of advisor market segmentation, it would probably be a mistake to say that channel doesn’t matter for retirement income marketers. The Trends in Retirement Income Delivery study show clear differences between channels in adoption of or interest in annuities.

For instance, 12% of advisors at regional broker-dealers and 11% of bank/insurance channel advisors are big users of variable annuities, while RIAs—the fastest-growing category—rarely use them. Only about 7% of wirehouse and independent advisors are frequent users of variable annuities.

Francois Gadenne, executive director of the Retirement Income Industry Association, which has been promoting its retirement management designation, the RMA, to advisors, said he was encouraged to see Schneider’s estimate of 5,000 to 6,000 adherents to the retirement paradigm among advisors. “If you think of it as a plant, the growth does not take place on the old wood,” he said. “The question is, where are the green tips of growth?”

The way to find retirement-oriented advisors, he said, is to look for those with “constrained” older clients who have considerable savings but not quite enough to cover all their needs and wants.  “This isn’t a top-down movement. What drives the advisors are the clients. So you want to look for advisors with a book of business that is tilted to older clients, and to older clients who are constrained rather than overfunded,” he said.

At independent broker-dealer LPL, “We’re definitely hearing more from advisors in the field that they would like help in developing retirement income solutions,” said Stephen Langlois, LPL’s executive vice president for strategic planning. “It’s mostly anecdotal at this point. They’re not looking for a product, they’re looking for guidance in putting all the pieces together.”

Kevin Seibert, CFP, director of InFre, which provides retirement income planning education and a related certification, says, “I’m having more conversations with advisors who have been proactively seeking information on retirement income management. With the economy turning around, the first Boomers turning 65 and clients becoming better informed and asking the right questions—partly because of all the TV commercials they’re seeing related to retirement—all of a sudden there’s been a renewed positive interest that enables us to tell our story to more advisors.”

© 2011 RIJ Publishing LLC. All rights reserved.

“The Ultimate Ponzi Scheme”

The following excerpt from “Guaranteed to Fail” is reprinted with permission from Princeton University Press and from the authors, Viral Acharya, Matthew Richardson, Stijn van Nieuwerburgh and Lawrence J. White, all of the New York University Stern School of Business. 

In a November 3, 2009, report “An Overview of Federal Support for Housing”, the Congressional Budget Office (CBO) estimated that the federal government provided approximately $300 billion in subsidies to housing and mortgage markets in 2009.

As a comparison, the much maligned farm subsidies and support for energy initiatives each receive approximately $20 billion per year. The degree of support for home ownership is staggering.

In the U.S., home ownership in particular is stimulated by four main government policies: the home-mortgage interest rate and property tax deductibility, the tax exemption of rental income enjoyed implicitly from homeownership, the exemption from income tax of capital gains on the sale of owner-occupied houses, and the lower interest rates that are enjoyed thanks to government support of the GSEs. In addition, there is a myriad of other programs. 

“Too much is never enough” is a reasonable summary of this array of housing policies.

As the CBO report outlined, these programs are expensive: The current home mortgage interest rate deductibility, for example, will cost $105 billion in lost federal tax revenue in fiscal year 2011. Property tax exemption, exclusion of rental income, and exclusion of capital gains taxes upon sale of the house will cost an additional $92 billion in 2011.

These programs come at a cost that is overlooked in the public debate: They make housing relatively cheaper and other goods relatively more expensive. This, in turn, leads to more consumption of housing, more investment in housing and construction, but less business investment and less consumption of non-housing goods and services.

The consensus among economists is that investment in residential real estate is substantially less productive (at the margin) than is capital investment by businesses outside the real estate sector (e.g., plant, equipment, inventories), investment in social infrastructure capital (e.g., highways, bridges, airports, water and sewage systems), or human capital (e.g., more and better education and training).

In other words, every additional dollar that is spent on residential construction instead of on business or other investment reduces economic growth. Careful research has found that all of the incentives for more house has led to a housing stock that is 30% (!) larger than would be the case if all of the incentives were absent, and that U.S. GDP is 10% smaller than it could be.  The U.S. simply has too much house!

Many politicians on the left and on the right equate reducing these housing subsidies to political suicide. After all, many believe that these policies are at the heart of the social contract with America and that they are therefore untouchable. Conventional wisdom has it that home ownership confers such benefits as good citizens, stable neighborhoods, strong communities, and – of course — personal wealth accumulation.

This “conventional wisdom” has met not only with a massive destruction of home equity in recent years, but also with mixed reviews in academic research. Nevertheless, housing subsidies have been and still are the policy tool of choice for combating income inequality, which has been on the rise in the United States since the 1970s.

However, research has shown that these policies predominantly benefit middle- to upper-income groups rather than the low-income group. One recent research paper specifically on the GSE subsidy by Jeske, Krueger, and Mitman (2010) finds that their effect is a loss in overall welfare and an increase in inequality.

Their model indicates that low-income households would be willing to pay 0.3% of lifetime consumption to live in a world without the GSE subsidy. The wealthy, instead, benefit from the subsidy.

In earlier research, academics have reached a similar conclusion regarding the home mortgage interest deduction. It too is regressive, benefiting high-income, high-asset households the most.

Upper-income households are more likely to itemize on their income tax returns and to have higher marginal tax rates (which is what makes the mortgage interest and property tax deductions more valuable), and they are more likely to buy higher priced houses (which would involve larger mortgages and hence more benefits).

Gervais (2001) calculates that abolishing the deduction would benefit the bottom 20% nearly 6 times more than the top 20% of the income distribution. Abolishing the tax advantage from owning would benefit everyone somewhat (in the long-run) because it would lead to a larger business capital stock (and possibly more social infrastructure and more human capital) and a smaller housing capital stock, which would positively affect economic growth.

More recent work by Poterba and Sinai (2008) estimates that the benefits from the home mortgage interest deduction for the average home-owning household that earns between $40,000 and $75,000 are one-tenth of the benefits that accrue to the average home-owning household earning more than $250,000.

The current policies do not discriminate between first-time home purchasers and households simply wanting to buy larger houses or (for the GSE subsidies) even second homes. Rather, the policies promote larger home purchases. Census data show that the square footage of new houses grew by about 50% between the mid 1970s and the mid 2000s. Although some of this increase surely reflected growing household incomes, some of the increase also surely reflected the growing value of the subsidy advantages for buying larger houses.

Finally, the deduction encourages people to borrow as much as possible. Encouraging household leverage does not strike us as the best possible policy. Thus, ironically, although one of the motives for encouraging home ownership was to provide households with a means of building wealth, the process of making borrowing cheap and easy encouraged these households to borrow excessively, and then to borrow again if interest rates declined and/or their house value increased.

In the process, they reduce the amount of net equity that they might otherwise build in their home. The metaphor of the refinancing household’s using their home as an ATM to finance consumption was a strong one in the mid 2000s.

And, of course, the excessive leverage and the cashing out of equity meant that the declines in housing prices after mid 2006 caused more houses to be “underwater”, where the value of the house was less than the outstanding principal on the enlarged mortgages. And, in turn, this meant more instances where households defaulted on their mortgages.

There is no social purpose that is served by such “more house” investments – a fifth bedroom rather than four, a fourth bathroom rather than three, a half acre of land rather than a third of an acre – and no social purpose that is served by excessive leverage.

Clearly, the housing policy of the past is misguided, and there is an urgent need to think of more effective ways to halt the increase in income inequality.

It should be clear, however, what purpose is served by the household leverage that is provided in the form of off-budget guarantees through Fannie and Freddie. This is what so far allowed successive presidential administrations to encourage ever-larger short-term consumption and spending during their tenures.

It might seem odd that in a game between two political parties to get to the seat, both would agree on a strategy to promote housing finance at successively higher levels over time. The game, however, is not between the two parties, but between each current administration and the future ones (and ultimately current and future taxpayers).

No President would want to shut down or bring onto the federal budget Fannie and Freddie’s debt or guarantees – until they have to be honored. Doing so would seriously alter the shape of that administration’s fiscal budget and force them to make hard choices that would produce long-term gains that would accrue only to future administrations. Instead, as long as possible, it would be better to let households spend more on housing, passing on the problem of dealing with housing guarantees to the next government, and so on.

And while each presidential administration is working its way through its term, aided by Fannie and Freddie’s balance sheets and off-balance sheet guarantees, the competitive landscape of the financial sector is altered as they enter more mortgage markets, contributing to a downward spiral of lending standards, excess leverage, and an unsustainable bubble in housing prices and construction.

In many ways, this is the ultimate Ponzi scheme of all.  

© 2011 Princeton University Press.

Republican budget manifesto released

Congressman Paul Ryan, chairman of the House Committee on the Budget, released a Fiscal Year 2012 Budget Resolution entitled, “Path to Prosperity: Restoring America’s Promise,” at his website yesterday.

The resolution, much of which is based on the “supply-side” economics principle that lower taxes will lead to economic expansion, outlines a plan to cut federal spending by $6.2 trillion relative to the Obama administration projections over the next decade. 

Under the proposal, the top individual and corporate tax rate would drop to 25% from 35%. The proposal also repeatedly calls for repeal of the Affordable Health Care Act passed by Democrats on a near-party line vote in 2010.   

The resolution, a polemic that characterizes Democratic policies as “reckless”  but blames both parties for helping to create the country’s huge debts and fiscal imbalances, also calls on the government to:

  • Reduce the federal workforce by 10% over the next three years attrition, coupled with a pay freeze for the next five years and reforms to government workers’ benefit packages.
  • Reduce inefficient spending by $178 billion, following guidance from Defense Secretary Robert Gates. Reinvest $100 billion of these savings into key combat capabilities, and put the rest toward deficit reduction.
  • Privatize the business of government-owned housing giants, Fannie Mae and Freddie Mac, so that they no longer expose taxpayers to trillions of dollars’ worth of risk.
  • Convert the federal share of Medicaid spending into a block grant tailored to meet each state’s needs, indexed for inflation and population growth.
  • Provide younger workers, when they reach eligibility, with a Medicare payment and a list of guaranteed coverage options from which they can choose a plan that best suits their needs.

Hedge fund managers bearish on U.S. equities and Treasuries

Hedge fund managers remain bearish on U.S. equities, according to the TrimTabs/BarclayHedge Survey of Hedge Fund Managers for March. 

About 36% of the 77 hedge fund managers the firms surveyed in the past week are bearish on the S&P 500, down from 40% in February, while 28% are bullish, up from 26%.

“While hedge fund managers remain bearish, hedge fund investors are showering them with fresh cash,” said Sol Waksman, founder and President of BarclayHedge. “Hedge funds posted the heaviest inflow on record in February, which probably owes in part to superior performance.  The Barclay Hedge Fund Index has posted a positive return for seven straight months.”

About 33% of hedge fund managers are bearish on the 10-year Treasury note, while 16% are bullish.  These figures have remained largely unchanged for three months.  In contrast, hedge fund managers have turned extremely bearish on the U.S. Dollar Index.  Bearish sentiment vaulted to 43% in March from 31% in February, while bullish sentiment sank to 22% from 31%.

“Poor Japan sports a disaster of biblical proportions, a gargantuan debt burden, and deflation—and yet managers would rather own yen than dollars,” notes Vincent Deluard, Executive Vice President at TrimTabs.  “Additionally, hedge fund managers strongly prefer the Canadian dollar to its American counterpart.  In fact, the futures positions of speculative traders reveal that the loonie is much more of a safe haven than the greenback.”

About 18% of hedge fund managers aim to lever up in the near term, while 14% plan to decrease leverage.  Meanwhile, most managers cite Portugal as the next victim of the European debt crisis.  About 78% expect the country to need a sovereign bailout in 2011, while 37% of respondents feel Spain will also earn the honor.

“Managers reported an interest in adding leverage in each of our past 10 surveys, and margin debt stands at the highest level since July 2008,” notes Deluard.  “Gambling with borrowed cash will prove popular until the Fed makes money more expensive.  As to Portugal and Spain, hedge fund managers feel strongly that these are the next debt-crisis dominoes to fall.  Seasoned investors might consider using the credit-default swaps market to bet against the Iberian Peninsula.”

The TrimTabs/BarclayHedge database tracks hedge fund flows on a monthly basis.  The Survey of Hedge Fund Managers appears monthly in the TrimTabs/BarclayHedge Hedge Fund Flow Report, which provides detailed analysis of hedge fund flows, assets, and returns alongside topical studies.  

Retirement confidence low, survey shows

The 21st wave of the Retirement Confidence Survey (RCS), sponsored by the Employee Benefit Research Institute and conducted by Mathew Greenwald & Associates, finds that Americans’ confidence in their ability to afford a comfortable retirement has plunged to a new low at the same time that the recent declines in other retirement confidence indicators appear to be stabilizing.

Instead of making fundamental adjustments to their spending and saving patterns in response to the decline in confidence, workers continue to change their expectations about how they will transition from work to retirement in what has been called an age of “the new normal.”

Workers not confident: The percentage of workers not at all confident about having enough money for a comfortable retirement grew from 22% in 2010 to 27% this year, the highest level measured in the 21 years of the RCS. At the same time, the percentage very confident shrank to the low of 13% that was first measured in 2009.

Income breaks: The increase in the percentage of workers not at all confident about having enough money for a comfortable retirement appears to be largely due to a loss of confidence among those who have less than $100,000 in savings. This percentage increased sharply among those with savings less than $25,000 (up from 19% in 2007 to 43% in 2011) and between $25,000–$99,999 (up from 7% in 2007 to 22% in 2011).

Retirees: Retiree confidence in having a financially secure retirement is stable, with 17% saying they are not at all confident and 24% very confident (statistically equivalent to 2010 levels).

Saved for retirement? Sixty-eight percent of workers report they and/or their spouse have saved for retirement (down from 75% in 2009, but statistically equivalent to the 2010 level). Fifty-nine percent say they and/or their spouse are currently saving (down from 65% in 2009, but statistically equivalent to earlier years).

Little or no savings: A sizable percentage of workers report they have virtually no savings or investments. Among RCS workers providing this type of information, 29% say they have less than $1,000. In total, more than half of workers (56%) report that the total value of their household’s savings and investments, excluding the value of their primary home and any defined benefit plans, is less than $25,000.

No retirement savings goal: Many workers continue to be unaware of how much they need to save for retirement. Only 42% report they and/or their spouse have tried to calculate how much money they will need to have saved by the time they retire so that they can live comfortably in retirement.

Expected retirement age rising: The age at which workers expect to retire continues its slow, upward trend. In particular, the percentage of workers who expect to retire after age 65 has increased over time, from 11% in 1991 and 1996 to 20% in 2001, 25% in 2006, and 36% in 2011.

More expecting to work in retirement: More workers now expect to work for pay in retirement. Seventy-four percent report they plan to work in retirement (up from 70% in 2010), three times the percentage of retirees who say they actually worked for pay in retirement (23%).

Here are the reasons workers say are causing them to delay retirement:

  • Poor economy: 36%.
  • Lack of faith in Social Security/government: 16%.
  • Change in employment situation: 15%.
  • Finances, can’t afford to retire: 13%.
  • Cost of living in retirement will be higher than expected: 10%.
  • Want to be sure you have enough money to retire comfortably: 10%.
  • Need to pay current expenses first: 9%.
  • Health care costs: 7%.
  • Need to make up for losses in the stock market: 6%.
  • Law changed minimum retirement age: 5%
  • Poor health or disability: 1%.

According to the survey, the age at which workers expect to retire is gradually rising. In 1991, half of workers planned to retire before age 65 (50%), compared with 23% in 2011.

How to solve Social Security’s solvency problem

To restore Social Security to long-term solvency, a leading authority on retirement financing recommends four measures:

  • Indexing the full retirement age (after it reaches 67) to improvements in longevity;
  • Switching to a measure of inflation that grows more slowly than the one now used to calculate Social Security’s cost-of-living adjustment;
  • Gradually increasing the earnings subject to the payroll tax (and the basis for benefits) to about $180,000 from $106,800 today; and
  • Gradually subjecting both employer and employee premiums for group health insurance to payroll and income taxes.

So wrote Alicia H. Munnell, director of the Center for Retirement Research at Boston College, in an op-ed piece published in the New York Times yesterday. Such measures would brighten the long-term fiscal outlook in the U.S., she added.

“Scheduled Social Security benefits and current payroll taxes are included in long-term deficit projections by the Congressional Budget Office, the Office of Management and Budget and the Government Accountability Office,” she wrote.

“These projections matter: policymakers, investors and the bond markets use them to gauge the nation’s fiscal health. Since a shortfall in Social Security is embedded in these projections, eliminating that shortfall would substantially improve the long-term budget outlook and the nation’s creditworthiness.”

Fear of Social Security insolvency compels many people to claim benefits at age 62, thus locking themselves into the system’s lowest payout rate for life. Restoring solvency to the system would give them the confidence to delay claiming and maximize their benefit.   

© 2011 RIJ Publishing LLC. All rights reserved.


The Bucket

Jason D. Nicoloff Joins Lincoln’s Advisor Recruitment Team

Lincoln Financial Network, the retail distribution division of Lincoln Financial Group, today announced that Jason D. Nicoloff has joined its Advisor Recruitment team as field recruitment director.

Nicoloff will report to John DiMonda, managing director for the Defined Metro New York/New Jersey and North Central Ohio regions. Nicoloff will be responsible for overseeing the recruitment of qualified financial representatives in the Cleveland, Columbus and Akron, Ohio, areas as well as Fort Wayne, Ind.

Prior to joining LFN, Nicoloff was an investment consultant for TIAA-CREF in West Lafayette, Ind., where he focused on growing defined and supplemental plan assets, as well as individual money management services. He has worked at Allstate Financial Distributors, LLC, in Chicago, Hillyard Lyons in Lafayette, Ind., and Fifth Third Securities in Indianapolis. He received a bachelor of science degree in economics from Purdue University in West Lafayette, Ind., and holds FINRA registrations 7, 24, 63 and 66.


New episode in AXA Equitable’s “Retirement Reality Show” series

AXA Equitable Life has released the latest episode in its “Retirement Reality Show” video series exploring the attitudes, behaviors and experiences of soon-to-retire and retired Americans.   

“Life, Liberty and the Pursuit of Financial Freedom,” is set against the backdrop of the Statue of Liberty. On the occasion of National Retirement Planning Week, AXA Equitable went to Liberty Island to ask people how much time they spend planning their vacations versus planning for financial freedom in retirement.

“People told us they spend three to six months, and in some cases up to a year, planning a one-week vacation but not nearly as much time planning for a retirement that could last hopefully for decades,” said Chris Winans, senior vice president, External Affairs at AXA Equitable.

AXA Equitable’s “Retirement Reality Show” video series complements the company’s ongoing research and thought leadership programs on the issues surrounding retirement and serves as a platform for taking the public’s pulse on financial risks and preparedness. The purpose of the series is to learn firsthand what real retirement savers and retirees are thinking and doing.

To access the video, go to The Source, AXA Equitable’s multi-media Web page that provides information and thought leadership on a wide array of financial protection and retirement planning topics.


Retirement advisors ignore middle-income market: Bankers Life

The tendency of the financial services industry to cater to wealthy Americans could leave many middle income Americans without adequate plans for retirement, according to the Bankers Life and Casualty Company’s Center for a Secure Retirement (CSR).

The CSR’s Middle-Income Retirement Preparedness Study, which focused on pre-retirees and retirees with incomes from $25,000 to $75,000, found that 51% had not been contacted by any kind of retirement professional in the past 12 months. Further, 84% of the study participants who work with a retirement professional said that they initiated contact with the advisor.

The study showed that two in three (68%) middle-income Americans who work with a professional feel better prepared for retirement than their peers, and 76% said they were extremely or very satisfied with their retirement professional.

The CSR says that retirement professionals are not just portfolio managers for the wealthiest retirees. Many products and services exist for people with virtually any level of income and assets that can help make your income last.

To locate a professional retirement advisor and learn more about retirement planning, visit your local library, senior center, or search online.

The Bankers Life and Casualty Company Center for a Secure Retirement Middle-Income Retirement Preparedness Study was conducted in August of 2010 by the independent research firm The Blackstone Group.  The complete report may be viewed at www.CenterForASecureRetirement.com


FundQuest announces milestones for its ActivePassive Funds

FundQuest, a provider of wealth management solutions and investment research, announced that its ActivePassive Funds have reached their 3-year track record as of December 31, 2010.

The funds, available through major custodial platforms, are the building blocks for the ActivePassive Portfolios, a suite of FundQuest-managed solutions designed for investors across the risk spectrum.

FundQuest now offers advisors direct access to the portfolios through the ActivePassive Portfolio Console, an exclusive portal that allows financial advisors swift access to active/passive products. The console includes a complete proposal system, fund data and robust reporting capabilities, along with the firm’s extensive global research and analysis.

Visit these links to learn more about FundQuest distribution channels for the ActivePassive Funds or for information on ActivePassive construction and philosophy.


New website from The Principal explains Tax Relief Act  

The Principal Financial Group has developed a website  to help advisors and their clients navigate the changes created by the passage of the Tax Relief Act of 2010.   

The website offers step-by-step guidance on the law including who it impacts and how to work with clients on new planning techniques. Some of the new and updated tools include:

  • TRA 2010 White Paper
  • TRA 2010 Planning Guide
  • Updated Estate Protection Calculator
  • Client profiles and sales ideas 


Securian Retirement and Securian Life make announcements

Securian Retirement added six American Funds to the separate account investment options available through its qualified retirement plans.

Effective March 1, these six Class R-5 investment options became available through Securian retirement plans: 

·        American Funds The Growth Fund of America 

·        American Funds The Investment Company of America 

·        American Funds New Perspective Fund 

·        American Funds New World Fund 

·        American Funds Capital World Bond Fund 

·        American Funds US Government Securities Fund 

With these latest additions, employers can select from 110 investment options and 37 fund managers.   

Meanwhile, Securian Life Insurance Company has introduced its first annuity product in New York. IncomeToday! is a single payment immediate annuity that offers clients the security of a guaranteed retirement paycheck and the flexibility of a unique feature called the Advance Withdrawal Benefit.

IncomeToday! was introduced two years ago elsewhere in the US by Securian Life affiliate Minnesota Life Insurance Company.

Find a complete description of IncomeToday! online. Features include:

  • a range of income choices and guarantees to meet client needs
  • competitive income payouts
  • protection from the ups and downs of the markets

More information about IncomeToday! is available on the CANNEX Financial Exchange.

Have Investment Managers Earned Their Fees?

Despite the continuing global financial crisis, the uprisings in the Middle East and the Japanese disaster, global stock markets delivered very good results in the first quarter of 2011.

These upheavals test the mettle of investment managers, so you need the proper perspective to evaluate investment performance. The question, “Is performance good?” requires an answer to yet another question: “Relative to what?”

As usual, some styles, sectors and countries performed better than others in this first quarter. Have your managers seized upon the better segments and/or selected exceptional securities? Where have they succeeded and failed?

Bottom line: Have they earned their fees?

Of course, one quarter is too short a timeframe to get excited about winners and losers, but we should get excited about the emerging importance of real due diligence, which is about to become a fiduciary obligation. 

In October of 2010, the Department of Labor issued a recommendation to remove a 35-year old fiduciary exclusion for advisors who select investment managers. If adopted, many advisors who prefer to not be held to a fiduciary status will have a decision to make: stop providing manager recommendations or get serious about manager research.

Those of you who accept this responsibility will want to tighten up your due diligence processes.  You will need to conduct manager research like it’s never been done before. When you do, you will discover something you’ve never had before, namely good active management performance versus passive alternatives. Clients will finally get what they deserve.

Insights into the first quarter of 2011

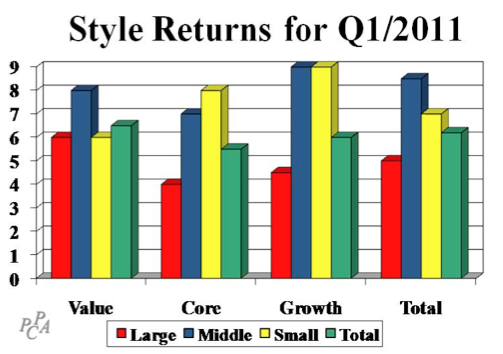
U.S. markets in the first quarter of 2011 delivered three consecutive positive monthly returns, although March was a squeaker, eking out a modest 0.2% gain. As the chart on the right shows, every US style posted a positive return for the first quarter of 2011, continuing the recovery that began in March of 2009.

This quarter’s 6.2% market return brings the 25-month return from March 2009 to March 2011 to a whopping 100%. Consequently we’ve turned the corner in recovering from 2008 losses; the 39-month return for January 2008 through March 2011 is a positive 1.4% un-annualized, or about 0.4% per year. It’s taken all the running we can do to stay in the same place.

As the optimist plummeting off a skyscraper said, “so far, so good.” We might not continue this recent recovery. A look at what has been working, and what has not, offers some clues.  Mid-sized companies fared best, while value and growth styles fared about the same in aggregate, although core lagged.

This was one of those time periods where the stuff in the middle surprised by not performing in between the stuff on the ends—mid-cap outperformed large and small while core underperformed value and growth.  I use Surz Style Pure® style and country definitions throughout this commentary, as described here.    

Performance by sector

On the sector front, energy stocks fared best, earning 15% in the quarter, as concerns about the Middle East drove up oil prices. Industrials and healthcare were the next best performers, earning 9% and 7% respectively. Rounding out the range of sector results, the remaining sectors returned around 3.5%, far less than the leaders.

Looking outside the US, foreign markets earned less than half as much as the US in US dollars, delivering a 2.7% return, led by Canada and Europe ex-UK, each with 8.5% returns. Europe ex-UK benefitted from a weakening dollar, so currency effects added 5% in the quarter.

Several regions lost value in the quarter: Japan, Emerging Markets and Latin America. For Japan, which lost 3.5%, it was a continuation of a decade-long sequence of disappointing returns, in this case caused by the earthquake and nuclear reactor problems. For Emerging Markets and Latin America, this quarter marked a reversal because these regions had been leading foreign markets. As a result, the EAFE index, which had been lagging the total foreign market for some time, was in line with the total market for the quarter.


Now you have several frameworks for evaluating investment manager performance in the first quarter of 2011. But this is only one small aspect of the overall due diligence process – a process which should be forward looking, focused on developing confidence in managers’ abilities to add value. After all, clients always have the choice between active and passive management. Your recommendations of active managers are very important, which is good, and they are likely to become much more important.


One Reason the Crisis Got So Bad

The following excerpt from “Guaranteed to Fail” is reprinted with permission from Princeton University Press and from the authors, Viral Acharya, Matthew Richardson, Stijn van Nieuwerburgh and Lawrence J. White, all of the New York University Stern School of Business. 

With the deregulation of the mortgage finance market, the decade of the 1980s was a period of substantial growth for Fannie and Freddie. At the end of the decade, Fannie and Freddie were fundamentally entrenched as parallel GSEs, with similar structures, privileges, responsibilities, and limitations.

The last major legislation to impact the GSEs until the financial crisis of 2007-2009 was the Federal Housing Enterprises Financial Safety and Soundness Act (FHEFSSA) of 1992. It produced a number of important rules, one in particular related to capital requirements.

In particular, a risk-based capital regulatory regime was specified for Fannie and Freddie and their two main functions: (i) securitizing and guaranteeing the credit risk of MBS, and (ii) investing in MBS or other similar portfolios of mortgages.

With respect to (i), the capital buffer that the GSEs were required to hold against these guarantees was 0.45% (i.e., 45 cents per $100 of guaranteed mortgages), which implied that the Congress believed that residential mortgages were quite safe instruments to guarantee against credit risk – or that the Congress meant to subsidize these guarantees and was (if push came to shove) prepared to cover any losses.

With respect to (ii), the GSEs were to hold 2.50% capital against their balance sheet assets (of which mortgages are by far the largest category). Thus, for every $100 in mortgages held, they could (in principle) fund those mortgages with $97.50 in debt and only $2.50 in equity.

In comparison to any other financial institution, Fannie and Freddie were afforded extraordinarily light capital requirements. For example, the capital requirement for federally insured banks and thrifts to hold residential mortgages was substantially greater: 4%. As a result, Fannie and Freddie had much higher leverage ratios – total assets to shareholder equity – than did comparable banking institutions.

To many fixed-income practitioners and analysts, the GSEs’ growth and the expansion of securitization markets for mortgage finance should be considered a success story. But there was a darker side to the interaction between the GSEs and the banking sector: While banks were charged a 4% capital requirement for holding a portfolio of mortgage loans, they were charged only 40% of this, or 1.60%, if they held GSE MBS instead. Within the financial sector, this creates perverse incentives for banks to load up on GSE MBS, thereby increasing leverage all the way around the sector.

To see this, note that if a bank originated $100 worth of mortgage loans, they would have to hold a minimum $4 of capital to be considered adequately capitalized. If the bank sold these loans to the GSEs and the GSEs securitized them into MBS, however, the banks could buy back the GSE MBS and hold only $1.60 in capital, even though their portfolio holdings are identical.

Because the GSEs are only required to hold $.45, this means that, for the same level of risk, the capital requirement for the financial sector as a whole now is just $2.05, or 51% of what it used to be. There is little doubt that the growth in securitization is related to this type of regulatory arbitrage.

*            *            *

The mortgage credit risk of Fannie Mae and Freddie Mac combined grew at an astonishing 16% (11%) annual growth rate from 1980 (1992) through 2007. We saw that this growth was financed using borrowed money and levels of leverage far in excess of other financial institutions.

Why would debt investors finance such growth? Because of the special status and treatment of the GSEs, the financial markets have historically treated them specially: The financial markets believed (correctly, as it turned out, or as a self-fulfilling prophesy) that if either company ever experienced financial difficulties, the federal government would likely intercede to make sure that the company’s creditors did not suffer any losses.

This belief persisted despite the explicit statement on all GSE securities that these securities were not full-faith-and-credit obligations of the U.S. Government. The belief seems largely rational given that for most practical purposes, GSE debt is on par with Treasuries as “liquidity” or “risk-free securities” and therefore is held in hoards by financial firms much like Treasuries (in fact, 50% of GSE debt was held by financial firms in 2008).  The “halo” effect of all of the special features of the GSEs was just too strong for them not to be deemed as too-big-to-fail.

With an implicit guarantee on their debt, Fannie and Freddie were able to borrow at interest rates that were below what the financial markets otherwise would have demanded. This meant that it was quite profitable for the GSEs to purchase mortgages and offer credit default guarantees below fundamental rates, allowing them to vanquish any competition and grow unfettered.

Because fixed income investors – either those holding Fannie and Freddie debt or MBS guaranteed by Fannie and Freddie – believed that there was a government backstop, market discipline went out the window, and there was no one left to restrain Fannie and Freddie.

As described above, adding to this subsidy was the fact that Fannie and Freddie had much lower capital requirements than did commercial banks and investment banks, for guaranteeing as well as holding MBS. With such a lack of a level-playing field, there was really no free market. Instead of capital flowing to its most efficient use, as the deregulation of mortgage markets in 1980’s had anticipated, capital was in fact flowing to its most levered use.

There was no one left to restrain Fannie and Freddie, of course other than the federal government, but in the pursuit of myopic goals of boosting home ownership at all costs, each successive presidential administration turned a blind eye.

© 2011 Princeton University Press.

Plan Sponsor Group Joins Hueler SPIA Platform

Big news in the still-small world of single-premium income annuities: Hueler Companies and the Profit-Sharing Council of America have entered into a relationship. 

The deal, announced late Tuesday after a year of negotiations, is significant. It allows the 1,200 defined contribution plan sponsors who are members of the PSCA to give their six million plan participants access to the Hueler’s Income Solutions, an online platform where 401(k) participants and fee-only advisors can get competitive, no-load bids on SPIAs.  

To put it another way, Kelli Hueler, the purposeful Minneapolis entrepreneur behind Income Solutions, has apparently persuaded David Wray, the president of PSCA, and his board of directors that her platform can give retiring plan participants a transparently-priced, multi-insurer, “out of plan” income option that—and this is key—won’t expose plan sponsors to fiduciary liability.

The PSCA board includes representatives of plan sponsors or providers such as McDonald’s, Playboy Enterprises, Procter & Gamble, New York Life, MGM Resorts International, and The Hartford, as well as small and mid-sized firms. 

“Plan sponsors want to help but they don’t want to be directive,” Wray told RIJ. “They’re concerned with the liability that directive means and they don’t want to be wrong.” With the Hueler option, ‘if a participant comes to them and says, ‘I need an income solution,’ they can accommodate them by saying, ‘Here’s access to a transparent, low-cost annuity platform that has educational material.’ There are no endorsements or recommendations.” 

The agreement doesn’t compel PSCA members to do anything; it simply allows them to offer an access code to the platform to  ready-to-retire participants who are interested in converting some of their qualified savings to a guaranteed lifetime income stream. Under the agreement, PSCA plan sponsors won’t have to pay the $5,000 fee that Hueler usually charges for setting up an interface between a plan and the platform.

Income Solutions, for those unfamiliar with it, is a website where members of certain 401(k) plans and certain financial advisors can log on and request competitive real-time quotes on single-premium immediate annuities from eight or nine different highly-rated insurance companies who’ve been vetted by Hueler and who agree to offer special prices with no embedded distribution expenses.

Hueler, a successful provider of stable value fund data, created Income Solutions in 2004 after four years of research. She has spent the past six years talking about it and promoting it at conferences, hearings, roundtables and executive suites all over the country. She has formed partnerships with plan providers Wells Fargo, ING, T. Rowe Price and Hewitt Associates.

In 2007, Hueler and the National Association of Personal Financial Advisors entered into an agreement that would give NAPFA’s fee-only advisors access to Income Solutions for their clients. In 2010, Hueler and Vanguard agreed that Vanguard’s 401(k) participants could have access to the platform. The deal with PSCA marks an new milestone in the ongoing growth of Income Solutions.

While SPIA sales are currently tiny—low interest rates aren’t helping—Hueler doesn’t think they will necessarily stay that way. “There’s an appetite out there that hasn’t been reflected in the sales  numbers,” Hueler told RIJ. “Our volume has dramatically increased. And if every plan sponsor communicated this to employees and employees had a chance to consider this option, you would see substantially higher usage of [SPIAs].”

In essence, Income Solutions is using the Internet to do for SPIA transactions what it has done for books, cars and other products: drive prices down, make transactions more transparent, and put more control in the hands of the consumer.

Just as consumers can compare car prices on cars.com, they can compare the prices of annuities at Income Solutions. Hueler isn’t the first to venture into that territory; for years, New Jersey-based insurance general agent Hersh Stern has been offering competitive annuity quotes through his site, immediateannuities.com. Others use a similar formula.

Both types of sites allow shoppers to see the highest available SPIA payout. That alone is important, because a client who sees only one annuity quote at a time is as helpless as someone who visits one car dealer and sees one isolated offer at a time. On any given day, the spread between the highest and lowest annuity prices can be as wide as 10%. For example, a couple might pay anywhere from $190,000 to $210,000, depending on the issuer, for $1,000-a-month in retirement.

But Hueler’s platform is different in a couple of crucial ways. Most importantly, it eliminates the commissioned salesperson. That makes the transaction cheaper and more transparent. Hueler discloses a flat two percent fee (one percent to finance the Income Solutions platform; the other one percent is paid to the plan provider or charged by the fee-only advisor who mediates the transaction for the participant or investor). In a typical agent-mediated transaction, the buyer pays up to five percent and doesn’t know exactly what the underlying cost structure looks like.

For plan sponsors, these differences matter a lot. The combination of lower, transparent pricing and a choice of bids from a screened selection of multiple high-quality annuity issuers—plus the fact that the SPIA purchase on Income Solutions involves a rollover to an IRA outside of the plan—makes Income Solutions acceptable to the many plan sponsors who are afraid that income options that involve in-plan purchases of annuities from single issuers would expose them to immeasurable liability should the issuer fail.

“The key for us was the transparency,” Wray said. “In the world we live in today, anything that has to do with our system has to be transparent. This platform provides the kind of thing that plan sponsors should be comfortable informing their participants about.” Nineteen percent of his member companies still have programs where they refer participants to a single insurance company for purchasing an income annuity inside the plan, he noted. But the Hueler concept is emerging as a successor to that practice. 

Income Solutions also claims to offer “institutional pricing.” Hueler says that participating carriers have agreed to offer SPIAs to her clients at the “same prices they offer to their best institutional clients.” That pricing remains something of a black box at the carrier end, but it is said to be the stripped-down price with no distribution fees layered on. 

SPIA pricing is the subject of an upcoming article in Retirement Income Journal. So far, comparisons of SPIA prices at Income Solutions, Immediateannuities.com, AARP, Fidelity’s SPIA platform, and Cannex, the independent data provider, show a small but consistent advantage at Income Solutions.

The insurers currently listed as participants in the Income Solutions platform are American General Life, Integrity Life, Lincoln National Life, Mutual of Omaha, Pacific Life, Principal Life and Western National. The largest seller of SPIAs, New York Life, is not listed. Its products are primarily sold through career agents. It also has an exclusive marketing relationship with AARP. MetLife also offers quotes for participants in certain plans. 

© 2011 RIJ Publishing LLC. All rights reserved.

Events that may interest you

Events on retirement income and related issues this spring and early summer include:

April 5-6. CFA Institute Conference: 2011 Asset and Risk Allocation. Spertus Institute, Chicago, IL. 

April 11-12. Investment Symposium, hosted by the Society of Actuaries. Millenium Broadway Hotel, New York, NY. 

April 13-15. The Retirement Industry Conference, hosted by LIMRA, LOMA and the Society of Actuaries. Caesar’s Palace, Las Vegas, NV.

May 16-17. Life and Annuity Symposium, hosted by the Society of Actuaries. Sheraton New Orleans, New Orleans, LA. 

May 18-20. NAPFA National 2011, the annual conference of the National Association of Personal Financial Planners. Grand America, Salt Lake City, UT.

June 26-28. The Insured Retirement Institute’s 2011 Government, Legal and Regulatory Conference. Omni Shoreham, Washington, DC.

June 26-28. The Boulder Summer Conference on Financial Decision Making. St. Julien Hotel, Boulder, CO.

Corporate pension funded status improved by $12.4 billion in 2011: Milliman

Milliman, Inc., has released the results of its annual Pension Funding Study, which consists of 100 of the nation’s largest defined benefit pension plans. In 2011, these plans experienced asset returns of 12.8% (a $115 billion improvement) that were offset by a liability increase of 7.7% (a $103 billion increase) based on a decrease in the discount rate.

The decline in discount rates fueled record levels of pension expense for these plan sponsors. Collectively, these pensions went into the year expecting a $30 billion charge to earnings, with the final number almost doubling that estimate, at $59.4 billion.

“This was a record year for pension contributions, though the number could have exceeded $60 billion if a few things had gone differently,” said John Ehrhardt, co-author of the Milliman Pension Funding Study.

“Pension funding relief enacted last summer helped reduce the funding burden, along with positive investment performance.  If interest rates remain at current levels (or decline), contributions will be even higher in 2011.”

While the funded status for the year changed only modestly, the year was marked by several significant events. In August, falling interest rates drove up the projected benefit obligation and resulted in a record deficit for the 11 year history of this study.

Over the course of the year, several companies adopted new accounting approaches, which involved full or substantive recognition of accumulated losses and a larger charge to 2010 balance sheets.

Had similar accounting changes been instituted across all of the companies in this study, the resultant charge would have totaled $342 billion.

Despite the eventful (and sometimes volatile) year, pension investment strategies remained relatively consistent.

“For the year, the asset allocation of these 100 pension plans did not change significantly, as investment in equities only decreased from 45% to 44%,” said Paul Morgan, co-author of the Milliman Pension Funding Study. “Fixed income allocations were unchanged at 36%, but allocations to other (alternative) investments increased from 19% to 20%. On average, there were not many changes, though we did see eight of the 100 companies decrease their equity allocations by more than 10%.”

Morningstar gives just six fund families an “A” for stewardship

Morningstar, Inc. released the findings from its 2011 Mutual Fund Stewardship Grade research study, which evaluated more than 1,000 funds from more than 40 fund families on how well each fund treats its fund shareholders’ capital.

The study calculated an average Stewardship Grade for all of the funds it grades within 44 different fund families. Six fund families currently earn an average overall Stewardship Grade of “A”: American Funds, Clipper, Davis, Diamond Hill, Dodge & Cox, and PRIMECAP.

Average overall Stewardship Grades of “B” are assigned to another 16 fund families, and 17 fund families receive “C” grades. Five fund families receive “D” grades in the report. No fund family currently receives an average overall Stewardship Grade of “F.”

Grades assigned to fund families                                by Morningstar, Inc.

 “A”

“B”

“C”

“D”

American Funds

Bridgeway

Allianz

Alliance Bernstein

Clipper

FPA

Artisan

ING

Davis

Franklin

Aston

John Hancock

Diamond Hill

Harbor

BlackRock

Principal

Dodge & Cox

Invesco

Columbia

Putnam

PRIMECAP

Janus

DWS


JPMorgan

Federated


Longleaf

Fidelity


MFS

Legg Mason


Osterweis

Neuberger Berman


Perkins

Oppenheimer


Royce

PIMCO


T. Rowe Price

RiverSource


Thornburg

Sentinel


Vanguard

TCW


Weitz

TIIA-CREF


Source: Morningstar Inc.’s 2011 Mutual Fund Stewardship Grade Research Paper

The study looked at how funds have performed since Morningstar first issued its Stewardship Grades in 2004 and again after the company revised its Stewardship methodology in 2007.

It concluded that funds with high Stewardship Grades (those receiving grades of “A” or “B”) are very likely to survive in the long-term, and more likely to provide competitive risk-adjusted returns in the ensuing period.

For purposes of the study, funds are considered successful if they have a Morningstar Rating of three stars or higher, a metric that broadly measures whether a fund’s shareholders have fared well relative to peer funds on a risk-adjusted basis. Funds were deemed unsuccessful if they received a Morningstar Rating of two stars or lower or if the funds did not survive.  

Morningstar uses five major criteria to arrive at a Stewardship Grade: the corporate culture of a fund’s parent organization; the quality of the board of directors overseeing the fund; the fund managers’ financial incentives; the fund’s fees; and the fund firm’s regulatory history.

Morningstar analysts assign each component an individual grade, and combine the scores to provide an overall Stewardship Grade. Funds that are determined to be the best stewards of capital receive an “A” grade, while the worst receive an “F.”  Morningstar currently assigns Stewardship Grades to more than 1,000 of the approximately 1,750 funds that its analysts actively follow.

The study found that of the funds Morningstar graded in 2004 and 2007:

  • About 99% of funds that received “A” Stewardship Grades survived.
  • More than 80% of the funds earning grades of “A” or “B” in 2007 had competitive risk-adjusted returns relative to their peers.
  • Approximately one-third of funds receiving an “F” grade in 2004 didn’t survive to today.
  • About one-quarter of funds receiving a “D” grade were liquidated or merged away.

Other positive correlations include:

  • Approximately 87 percent of funds that earned “A” grades for corporate culture in 2007 were successful in the ensuing period;
  • Managers who have their own financial incentives aligned with fund shareholders had good results—more than 75 percent of the equity funds earning “A” grades in 2007 in the manager-incentive category were successful in the ensuing period;
  • Funds with low fees had the best risk-adjusted returns, primarily over long-term periods.

Among all current fund evaluations, the most common Stewardship Grade is a “C,” which Morningstar assigns to 455 funds. On the high end of the scale, 90 funds currently earn an “A” overall grade and 359 funds receive a “B.” On the lower end, 145 funds currently receive a “D,” and just two funds receive an overall Stewardship Grade of “F.”

Morningstar assigns Stewardship Grades only to funds that Morningstar analysts actively follow, meaning an analyst reviews and writes an analysis on the fund at least once per year. Every one to two years, the analysts review and update the Stewardship Grades for the families’ funds that are listed below.

The overall grades are based on the sum of the points associated with each of the five methodology areas: corporate culture, board quality, manager incentives, fees and regulatory history. The maximum Stewardship Grade score is 10 points, with corporate culture contributing up to 4 points; board quality, manager incentives, and fees each contributing up to 2 points; and regulatory history contributing up to 0 points but as low as negative 2 points for funds with poor regulatory histories.


The Bucket

Janus hires Malinsky as regional retirement director for the Financial Institutions team

Janus Capital Group Inc. has appointed Mike Malinsky to be regional retirement director of Financial Institutions. He reports to Chris Furman, vice president and managing director of Financial Institutions.

Malinsky will partner with divisional managers and wholesalers in the insurance industry to promote Janus’ strong product options. He will also be responsible for facilitating sales, servicing and strategy implementation within the Financial Institutions team.

Malinsky had been vice president and funds manager at Genworth Financial. He has more than 17 years of experience in the financial services industry, including 11 years with Genworth. He managed all mutual fund relationships within Genworth’s variable annuity and group annuity policies, which represented approximately $12 billion of assets under management. 

Malinsky earned a bachelor of science degree in finance and a master of business administration from Virginia Commonwealth University.

ING hires Cruz to lead individual retirement investor channel

ING has named Orlando R. Cruz as president of its Individual Retirement Investor Channel.  Reporting to ING Individual Retirement CEO Lynne Ford, he will lead a team responsible for providing phone-based guidance and support to both new and existing ING customers looking for help with their retirement savings and income needs.  

Cruz had been at Wells Fargo, where he most recently served as senior vice president and head of internal retirement consultant program for its Retail Retirement Group. In this capacity he led a team whose members were the “advisors’ advisors” for retirement and guaranteed income planning.

In more than 20 years at Wells Fargo and its predecessor companies, Cruz served as senior vice president and director of the internal retirement consultant program, as national sales manager of offshore products, as Southern Divisional sales manager of the field-based retirement consultant program, and as director of global and intermediary distribution.  He has extensive experience with retirement and insurance product distribution in the U.S., Latin America and Europe as well as experience with institutional products, including 401(K) retirement plans.

Cruz earned a bachelor’s degree in finance from the University of Miami, and a certificate from SIFMA’s Securities Industry Institute at The Wharton School.  He is a general securities principal and investment advisory representative holding FINRA Series 7, 9, 24 and 63 licenses.  Cruz also serves on the membership committee of the Insured Retirement Institute (IRI).

AXA Equitable offers turn-key service for small, mid-sized plans

AXA Equitable Life has launched Retirement Gateway, a group variable annuity, to fund retirement plans for the small- to mid-size market. Nick Lane, president of the Retirement Savings division of AXA Equitable, described it as a full service retirement benefit for plan sponsors.   

Retirement Gateway includes a broad range of investment options; fiduciary support; administration support and service; and ongoing, interactive and customizable employee education and service. In addition to the traditional 401(k) plan, Gateway supports other retirement benefit plan types including profit-sharing, age-weighted/new comparability plans, money purchase plans, Safe Harbor plan provisions and a Roth 401(k) feature.

Gateway gives plan sponsors more than 100 investment options from well-known fund families and all major investment categories.

Options include:

  • A choice of Target Date and Risk-Based Asset Allocation Portfolios for investors who want a one-step approach.
  • Individualized investment options that include active, passive (index) and multi-manager styles for those who want to take a more active role in managing their portfolios.
  • A Guaranteed Investment Option (GIO) with a guaranteed fixed rate of return.
  • A Stable Value Fund that offers potential for principal protection with investment diversification.
  • Automatic Asset Rebalancing, a feature that periodically rebalances an employee’s account so the ratio of stocks to bonds resets to the account’s target asset allocation.

Gateway’s investment options can satisfy Safe Harbor provisions under ERISA Section 404(c) provisions, including Qualified Default Investment Alternatives (QDIAs) – the default investment options when employees do not indicate how they wish to invest.

Plan sponsors can choose from co-fiduciary or full fiduciary services for investment selection and monitoring offered by an independent third-party investment advisory firm. Sponsors receive quarterly plan reports including investment updates, a model investment policy statement, a performance summary, a review of investment alternatives, a summary of changes and additions, and an investment watch list.

The plan also offers a choice of bundled and unbundled recordkeeping services. With the bundled service option, an AXA Equitable retirement account manager and plan design specialist work together to create a retirement plan based on the company’s objectives and employee base. With the unbundled services, sponsors choose their own Third-Party Administrator (TPA); AXA Equitable works with the TPA to prepare compliance forms, plan testing and reports.

Gateway provides a secure web-based automated recordkeeping platform to help minimize recordkeeping tasks, increase accuracy and reduce data entry time. The platform provides extensive online reporting capabilities and enables sponsors to submit enrollment data for new plan participants; update plan information; perform numerous transactions; and access plan reports and forms.

AXA Equitable has created a proprietary education program to support the Gateway plan. An innovative, needs-based system, it is designed to aid participant’s decisions. The centerpiece is a multi-media online interactive tool that can be customized to the plan and individual participants.

Morningstar to provide mutual fund platform to eRollover

eRollover, a free online consumer destination focused on retirement planning, today announced it will provide the U.S. open-end mutual fund platform from Morningstar to eRollover members to research trailing performance, as well as the Morningstar Rating for Funds, via proprietary analytical tools.

 “This agreement with Morningstar will allow our members access to the Morningstar platform via various investment tools and screeners. Specifically, our members will be able to research mutual fund performance as well as current Morningstar Ratings for funds,” said Tim Harrington, CEO of eRollover.

eRollover was formed to fill a void in the availability of retirement planning information to the public at a time when people were frustrated over diminishing value in their IRAs and 401(k)s, and not knowing what to do, he added. “The mission of eRollover is to enable people to take control of their retirement and achieve financial independence by providing unique, independent content, so they can make informed decisions about their future.”

At eRollover, a Rollover Center enables people to  complete a 401(k) or IRA rollover.  An Education Center provides unbiased content previously not available to the general public for retirement planning. A Financial Advisor Center will provide access to professional financial advisors via an easy to use database. eRollover is headquartered in Atlanta.

Curian Capital to offer ‘income-oriented’ investment strategy

Curian Capital, LLC, a registered investment advisor that provides a fee-based wealth management platform to financial professionals, today announced the launch of the Curian Income Dynamic Risk Advantage (IDRA) Strategy.

 Designed for investors who want to generate a steady stream of income while protecting against market volatility, IDRA is available as a standalone strategy or within Curian’s new Research Select portfolios.

IDRA builds on Curian’s existing Dynamic Risk Advantage Strategy by incorporating securities that can generate income in the form of dividend payments. The strategy uses a tactical asset allocation process to shift between a group of higher-risk income-oriented investments and a lower-risk portfolio of high-quality, short-term Treasury investments. Through this process, the investor’s exposure to risk is reduced when equity markets are in decline, and increased when markets appreciate.

Curian’s Income Dynamic Risk Advantage Strategy is part of the company’s new Research Select offering, which includes two distinct sets of portfolios that focus on either asset accumulation or income distribution, and can help advisors meet a range of client objectives in a single account. The IDRA strategy is managed by Curian, with Mellon Capital Management Corporation acting as a non-discretionary sub-advisor.

Economy ‘hopelessly addicted’ to federal support: Trimtabs

The U.S. economy added 293,000 jobs in March, the sixth consecutive monthly increase, according to TrimTabs Investment Research.

“Economic growth is stronger than many forecasters and market participants realize,” said Madeline Schnapp, Director of Macroeconomic Research at TrimTabs. “Trillions of dollars in fiscal and monetary stimulus are finally producing the desired increases in growth and employment.”

She added, however, that “while the improvement is welcome, we believe the economy is hopelessly addicted to fiscal and monetary support. Growth slowed last summer after QE1 ended, and we think it could do so again after QE2 is scheduled to end in June.”

TrimTabs’ employment estimates are based on analysis of daily income tax deposits to the U.S. Treasury from all salaried U.S. employees.  They are historically more accurate than initial estimates from the Bureau of Labor Statistics.

In a research note, TrimTabs points out that various indicators suggest the economy is strengthening:

  • Wages and salaries increased an adjusted 7.8% year-over-year in March, up from 3.3% y-o-y in January and 4.7% y-o-y in February.  Moderate economic growth is characterized by year-over-year increases between 5.0% and 5.5%. 
  • The TrimTabs Online Job Postings Index was flat in March, probably because the disaster in Japan disrupted supply chains and made hiring managers more uncertain.  Nevertheless, the index is up 11.0% this year.
  • The four-week average of new claims for unemployment insurance declined to 385,250 in the latest reporting week, the lowest level since July 2008.

Vanguard announces active, multi-manager emerging markets equity fund

Vanguard has filed a registration statement with the U.S. Securities and Exchange Commission for a new actively managed emerging markets equity fund that will complement the firm’s existing emerging markets index fund.

The Vanguard Emerging Markets Select Stock Fund is expected to have an expense ratio of 0.95%, or about 40% less than the 1.68% expense ratio of the average actively managed emerging markets fund (Source: Lipper, December 31, 2010).

The fund will require a $3,000 minimum initial investment and is available only to individual investors who invest directly with Vanguard. As with many of its other international stock funds, Vanguard will assess a 2% redemption fee on shares held less than 60 days in an effort to deter short-term trading. The fee, which is not a load, is paid directly back to the fund to offset transaction costs.

The fund’s four advisors will each oversee 25% of the assets initially. They are:

  • M&G Investment Management Limited, which advises the $5 billion Vanguard Precious Metals and Mining Fund and a portion of the $18.3 billion Vanguard International Growth Fund. Portfolio managers Matthew Vaight and Michael Godfrey will use a valuation-based, return on capital-focused approach to create a portfolio with no country or sector constraints.
  • Oaktree Capital Management, L.P., which advises the $2 billion Vanguard Convertible Securities Fund. The portfolio managers, Tim Jensen and Frank Carroll, will employ a bottom-up research process to invest in a diversified portfolio, limiting exposures by country and industry to avoid concentrated bets.
  • Pzena Investment Management, LLC, which advises the $47 million Vanguard U.S. Fundamental Value Fund. (This fund is domiciled in Dublin, Ireland, and is available only to non-U.S. investors.) The firm will follow a deep value strategy to invest in stocks based on the research of the three portfolio managers, John Goetz, Caroline Cai, and Allison Fisch, supported by a team of analysts.
  • Wellington Management Company, LLP, which advises 19 Vanguard funds representing $195 billion in assets.  Portfolio manager Cheryl Duckworth, along with the deep experience of Wellington’s team of global industry analysts, will seek to add value through in-depth fundamental research.

In a recent article posted on Vanguard.com, “Practice portion control with emerging markets” (www.vanguard.com/portioncontrol), the company encouraged investors not to load up on emerging market equities.   

“Emerging markets can be an important part of an overall investment portfolio, but we suggest that investors use market capitalization as a yardstick for the appropriate amount of an investment,” said Joseph H. Davis, Ph.D., Vanguard’s chief economist.

“Today, emerging markets make up 25% of the international stock market, so we recommend that emerging markets represent no more than 25% of an investor’s international equity holdings.”

Past strong economic growth of emerging markets may not necessarily lead to strong stock returns in the future, he said. A Vanguard research paper (Investing in emerging markets: Evaluating the allure of rapid economic growth, www.vanguard.com/emresearch) published in April 2010 showed virtually no correlation between the average cross-country correlation between long-run GDP growth and long-run stock returns.

State pension reform may undermine Britain’s DB plans

Last week’s announcement by the UK Chancellor of the Exchequer that the UK will simplify its two-tier state pension to a one-tier, £140-per-week ($227) plan has roiled the providers of employer-sponsored defined benefit plans in Britain, IPE.com reported.

The new reforms will disrupt the practice of “contracting out,” whereby employees could contribute to a workplace DB plan instead of making full contributions to the second-tier of the state pension, consultants warn.

Pension experts at Aon Hewitt and PwC expect that the end of contracting-out will increased the costs of DB plans by about 3.4% of employees’ salaries and lead to the closure of the few remaining DB schemes. 

Marc Hommel, pensions partner at PwC, said: “The end of this incentive will make up the minds of those few remaining employers to accelerate defined benefit closures.”

Paul McGlone, principal consultant at Aon Hewitt agreed, saying those employers that had not yet closed their DB schemes had not done so because of the complexity of such a step.

“The danger with the proposal to abolish contracting-out is that, if companies are going to have to go through a painful consultation process anyway, then they may take the opportunity to simply close the scheme at the same time and use other arrangements to fulfill their forthcoming auto-enrolment obligations,” he said.

Did Income Inequality Cause the Crisis?

The disparity between the incomes of the wealthiest Americans and the incomes of the rest—especially the 180 million folks in the lowest three wealth “quintiles”—has widened over the past three decades. Lots of evidence shows this.

That widening has coincided with: a) bull markets in equities and bonds; b) ballooning public and personal indebtedness; c) a halving of the marginal tax rates on the highest earners (69.125% in 1981 to 35% in 2003).

Hmm. Are there causal links among those phenomena, or just associations? Lately, as the country has struggled to find solutions (or scapegoats) for its massive debt and deficits, that question seems worth asking. 

A recent paper, “Inequality, Leverage and Crises,” by Michael Kumhof and Romain Ranciére of the International Monetary Fund, provides some answers. The authors describe a mechanism whereby, just as the cycle of freezing and thawing splits pavement, a cycle of lending and borrowing worsens income disparity. 

Here’s how Kumhof and Ranciére explain our recent economic history:

“The key mechanism is that investors use part of their increased income to purchase additional financial assets backed by loans to workers. By doing so, they allow workers to limit their drop in consumption following their loss of income, but the large and highly persistent rise of workers’ debt-to-income ratios generates financial fragility which eventually can lead to a financial crisis,” they write.

“Prior to the crisis, increased saving at the top and increased borrowing at the bottom results in consumption inequality increasing significantly less than income inequality. Saving and borrowing patterns of both groups create an increased need for financial services and intermediation.

“As a consequence the size of the financial sector, as measured by the ratio of banks’ liabilities to GDP, increases. The crisis is characterized by large-scale household debt defaults and an abrupt output contraction as in the 2007 U.S. financial crisis.”

Sounds familiar, doesn’t it?  The downward spiral was also driven by our economy’s dependence on personal consumption and the country’s failure to put borrowed money to more productive uses:

“With 71% of the economy’s final demand coming from workers’ consumption, this output cannot be sold unless a significant share of the additional income accruing to investors is recycled back to workers by way of loans. With workers’ bargaining power, and therefore their ability to service and repay loans, only recovering very gradually, the increase in loans is extremely persistent.

“If a large share of the funds is invested productively, higher debt is more sustainable because it is supported by higher income. If instead the majority of the funds goes into investors’ consumption, or into loan growth, in other words an increasing “financialization” of the economy, the system becomes increasingly unstable and prone to crises.”

The least effective solution to the crisis, the authors claim, would be the bailouts that we’ve seen, because they perpetuate the conditions that caused the crisis. A better long-term solution, they say, would be to reduce the debt load and increase the purchasing power of rank-and-file citizens. Inequality of income hurts the rich, the poor, the economy and the country.  

© 2011 RIJ Publishing LLC. All rights reserved.